4496
A novel compartmental model of 129Xe gas exchange using blind estimation of blood concentration
Yohn Taylor1, Geoffrey J. M. Parker1,2, Mina Kim1, and Pilar Jimenez-royo3
1Centre for Medical Image Computing, Quantitative Imaging Group, Department of Medical Physics & Biomedical Engineering, University College London, London, United Kingdom, 2Bioxydyn Limited, Manchester, United Kingdom, 3GlaxoSmithKline, Stevenege, United Kingdom
1Centre for Medical Image Computing, Quantitative Imaging Group, Department of Medical Physics & Biomedical Engineering, University College London, London, United Kingdom, 2Bioxydyn Limited, Manchester, United Kingdom, 3GlaxoSmithKline, Stevenege, United Kingdom
Synopsis
Keywords: Hyperpolarized MR (Gas), Modelling, Blind deconvolution
Preclinical to clinical translation of pulmonary gas exchange measurements utilising hyperpolarised 129Xe MRI is limited by the overlapping spectral peaks of dissolved 129Xe MR red blood cell (RBC) and tissue compartments in some preclinical species. We present a novel kinetic model of 129Xe exchange (KMXE) in conjunction with blind estimation techniques to evaluate 129Xe exchange between pulmonary tissue and blood without needing an explicit measurement of RBC signals. Using simulations, we show that kinetic parameter estimates are comparable to those estimated using conventional methods, demonstrating feasibility for evaluating gas exchange kinetics when no distinct RBC spectral peak can be measured.Introduction
129Xe is highly lipophilic and soluble, permitting the evaluation of gas exchange dynamics within the alveoli, tissue, and blood compartments – red blood cells (RBC) and plasma – of the human, dog, and rat lung [1,2]. Gas exchange mechanisms can be modelled and assessed utilising characteristic spectroscopic peaks generated from the presence of 129Xe within gaseous (airways and alveoli) and dissolved (tissue, plasma, and RBC) compartments.Unlike other species, mice and rabbits do not possess unique 129Xe spectroscopic dissolved compartment peaks for tissue and RBC [3]; only a single combined peak. Translational research commonly makes use of mice, because of numerous anatomical, physiological, and genetic features shared with humans. As a result, 129Xe modelling in mice would help to characterise gas exchange over a wide range of pulmonary diseases and assist in the measurement of drug pharmacodynamics within the pre-clinical and clinical stages of drug development.
To this end, we present a novel compartmental model in conjunction with blind estimation techniques [4,5] for the extraction of kinetic parameters, without requiring separate compartment-specific spectroscopic peaks for tissue and RBC.
Methods
We developed a compartmental model describing the kinetics of 129Xe exchange within the separate compartments of the lung. The kinetic model of 129Xe exchange (KMXE) is summarised in Figs. 1 and 2 and was simulated for chemical shift saturation recovery (CSSR) [6] measurements using similar values for the surface area, air-capillary barrier thickness, and septal thickness as have been reported for the MOXE model [7].$$$S_{t}$$$ is the normalised non-vascular 129Xe signal contribution from the lung tissue and $$$S_{b}$$$ the normalised contribution from the plasma and RBC. $$$S_{total}$$$ refers to the normalised total lung contribution, a combination of the signal contribution from the plasma, RBC, and non-vascular tissue.
The combined blood 129Xe signal contribution in the pulmonary vein or aorta is a representation of the blood concentration exiting the lung. We use this venous exit function (VEF) within a blind estimation process in a manner analogous to how the arterial input function (AIF) has been used in dynamic contrast-enhanced (DCE) MRI. Using a similar approach to the alternating minimization with model (AMM) method [4], we simulated VEF blind estimation to extract the kinetic parameters associated with gas exchange between compartments in the lung.
Simulations of the MOXE model and MOXE equivalent (Fig. 3) were implemented for KMXE comparison and validation. $$$S_{total}$$$ curves were simulated using a parameterised functional form (pFF) of the VEF (Fig. 1, eq.7) and kinetic parameters drawn from a random uniform distribution with limits based on literature values. Simulated $$$k_1$$$ was constrained within [0.008, 0.01] (m$$$^3$$$/s), $$$k_2$$$ within [0.05, 0.1] (m$$$^3$$$/s), $$$V_t$$$ within [0.1, 0.15] $$$10^{-3}$$$ (m$$$^3$$$), and $$$V_b$$$ within [0.6, 0.9] $$$10^{-3}$$$ (m$$$^3$$$). Zero mean Gaussian noise with a standard deviation of 0.8$$$\times 10^{-3}$$$ was added to the simulated $$$S_{total}$$$ curves. $$$S_{total}$$$ curves were grouped using an unsupervised k-means clustering algorithm and then averaged as displayed in Figs. 4A&B. Implementation of the AMM method allowed for convergence of the kinetic and pFF parameters to the clustered averaged $$$S_{total}$$$ curves (Fig. 3C). The final extracted pFF parameters provide an estimate of the functional form of $$$S_{b}$$$ in each cluster. The mean across the clusters of the estimated $$$S_{b}$$$ is equivalent to a blind estimated version of the VEF (Fig. 4D). Parameter extraction was performed by a python-based non-linear least squares algorithm. The blind estimate VEF was then used to extract the kinetic parameter values for each cluster. The following pFF and kinetic parameter constraints were applied in the nonlinear regression algorithm: $$$A_1 \in $$$ [0, $$$\infty $$$], $$$A_2 \in $$$ [-8, 0], $$$A_3 \in $$$ [0, $$$\infty $$$], $$$A_4 \in $$$ [0, $$$\infty $$$], $$$k_1 \in $$$ [0, 0.1], $$$k_2 \in $$$ [0, 0.1], $$$V_t \in $$$ [0, $$$\infty $$$], and $$$V_b \in $$$ [0, $$$\infty $$$]. $$$k_1$$$ and $$$k_2$$$ constraints reflect literature values for their corresponding $$$x_1$$$ and $$$x_2$$$ values [8,9].
Results
Comparison of the MOXE equivalent and KMXE plots (Fig. 3) demonstrates that the signal representations are equivalent when the lack of a distinct RBC signal is accounted for (i.e. when grouping the observed signals into whole blood (plasma and RBC) and tissue (without plasma) components). The KMXE model successfully fitted to the simulated $$$S_{total}$$$ curves representing tissue clusters via the blind estimation of the VEF (Fig. 4), with resulting estimates for the kinetic parameter values shown in Table 1.Discussion
We have shown using simulations that the KMXE model generates equivalent compartmental time courses to the MOXE model (Fig. 3) and that, using blind estimation methods, it is possible to extract exchange parameter estimates without the need for explicit measurement of RBC signal. The derived pFF provides an accurate representation of the VEF and can be used successfully in the calculation of kinetic modelling parameters. Kinetic parameter values extracted after blind estimation present comparable results to representative literature values [8,9].Conclusion
We have demonstrated the feasibility of applying a kinetic model using blind estimation to hyperpolarised 129Xe MRI data and show the potential of this approach to probe gas exchange within separate blood and tissue compartments from a single combined measurement series.Acknowledgements
This work is co-funded by an EPSRC Industrial CASE award (Voucher No. V20000074)aligned to the EPSRC UCL Centre for Doctoral Training in Medical Imaging(EP/S021930/1) and GlaxoSmithKline Research and Development Ltd (BIDS3000035683).References
- Swanson, S. D., Rosen, M. S., Coulter, K. P., Welsh, R. C., & Chupp, T. E. (1999). Distribution and dynamics of laser‐polarized 129Xe magnetization in vivo. Magnetic Resonance in Medicine: An Official Journal of the International Society for Magnetic Resonance in Medicine, 42(6), 1137-1145.
- Ruppert, K., Brookeman, J. R., Hagspiel, K. D., & Mugler III, J. P. (2000). Probing lung physiology with xenon polarization transfer contrast (XTC). Magnetic Resonance in Medicine: An Official Journal of the International Society for Magnetic Resonance in Medicine, 44(3), 349-357.
- Freeman, M. S., Cleveland, Z. I., Qi, Y., & Driehuys, B. (2013). Enabling hyperpolarized 129Xe MR spectroscopy and imaging of pulmonary gas transfer to the red blood cells in transgenic mice expressing human hemoglobin. Magnetic Resonance in Medicine, 70(5), 1192-1199.
- Fluckiger, J. U., Schabel, M. C., & DiBella, E. V. (2009). Model‐based blind estimation of kinetic parameters in dynamic contrast enhanced (DCE)‐MRI. Magnetic Resonance in Medicine: An Official Journal of the International Society for Magnetic Resonance in Medicine, 62(6), 1477-1486.
- Schabel, M. C., Fluckiger, J. U., & DiBella, E. V. (2010). A model-constrained Monte Carlo method for blind arterial input function estimation in dynamic contrast-enhanced MRI: I. Simulations. Physics in Medicine & Biology, 55(16), 4783.
- Butler, J. P., Mair, R. W., Hoffmann, D., Hrovat, M. I., Rogers, R. A., Topulos, G. P., ... & Patz, S. (2002). Measuring surface-area-to-volume ratios in soft porous materials using laser-polarized xenon interphase exchange nuclear magnetic resonance. Journal of Physics: Condensed Matter, 14(13), L297.
- Chang, Y. V. (2013). MOXE: a model of gas exchange for hyperpolarized 129Xe magnetic resonance of the lung. Magnetic resonance in medicine, 69(3), 884-890.
- Grosjean, D. (1977). Ozone and other photochemical oxidants. National Academy of Sciences, Washington DC
- Krüger-Genge, A., Blocki, A., Franke, R. P., & Jung, F. (2019). Vascular endothelial cell biology: an update. International journal of molecular sciences, 20(18), 4411.
- Patz, S., Muradyan, I., Hrovat, M. I., Dabaghyan, M., Washko, G. R., Hatabu, H., & Butler, J. P. (2011). Diffusion of hyperpolarized 129Xe in the lung: a simplified model of 129Xe septal uptake and experimental results. New Journal of Physics, 13(1), 015009.
Figures
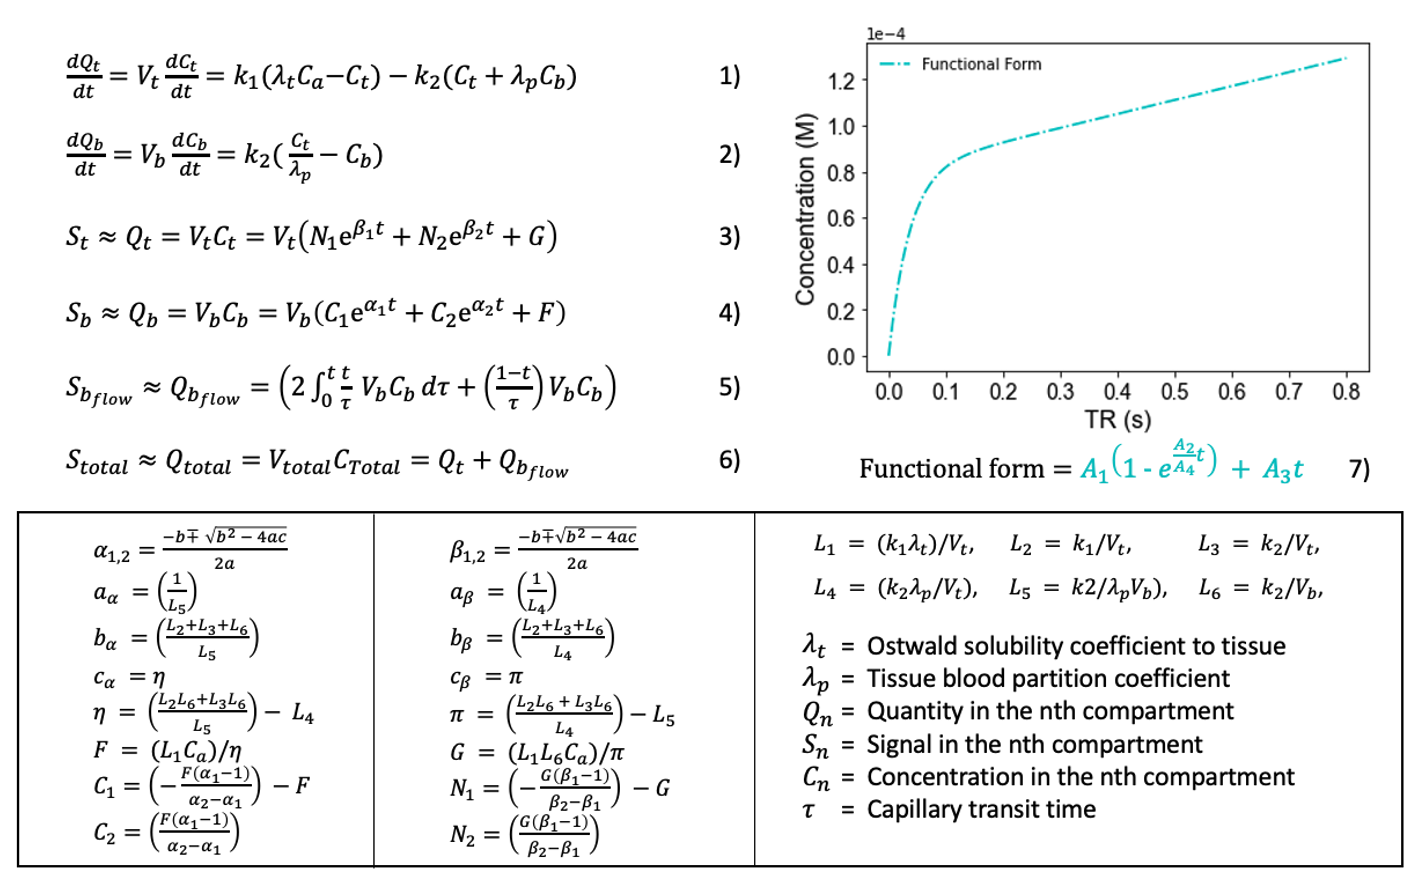
Figure 1. Alveolar, tissue, and blood compartments have 129Xe concentrations Ca, Ct, and Cb respectively. 129Xe freely diffuses into tissue and blood compartments with rate constants k1 and k2. We model VEFs with a flexible parameterized functional form as highlighted in eq.7.
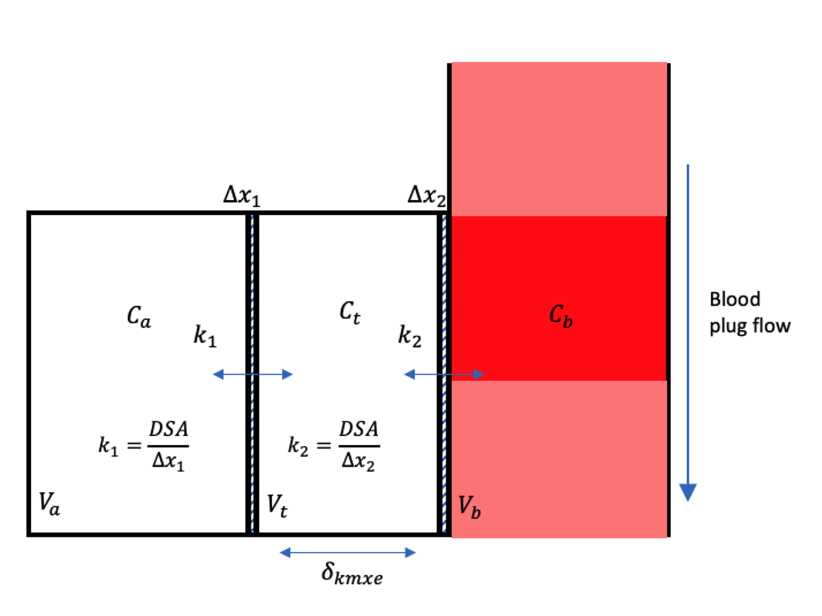
Figure 2. Schematic of the different lung compartments where D is the diffusion coefficient, SA is the surface area, and Va, Vt, and Vb are the volumes of the alveolar, tissue, and blood compartments. Δx1 and Δx2 are considered to represent the lung lining fluid and endothelium respectively.
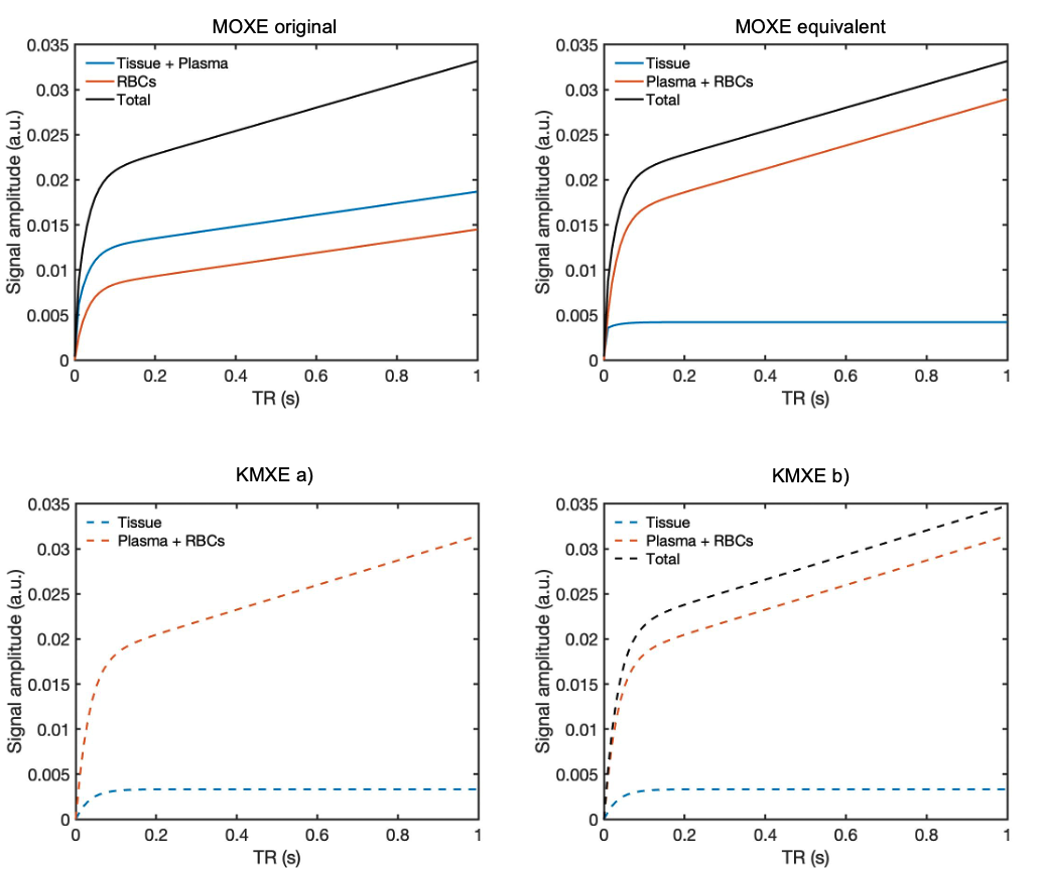
Figure 3. MOXE original, equivalent, and KMXE spectroscopic plots simulated for a healthy lung. A step change in alveolar 129Xe input is assumed. The MOXE original plot conventionally equates the tissue signal as both tissue and plasma, and the blood signal as RBCs. The MOXE equivalent and KMXE figures depict the total blood signal as a contribution of the plasma and the RBCs, demonstrating the lack of separation of blood and RBC signals in species such as mice. KMXE b) highlights the total lung tissue signal (blood + plasma + tissue), akin to the Patz model [10].
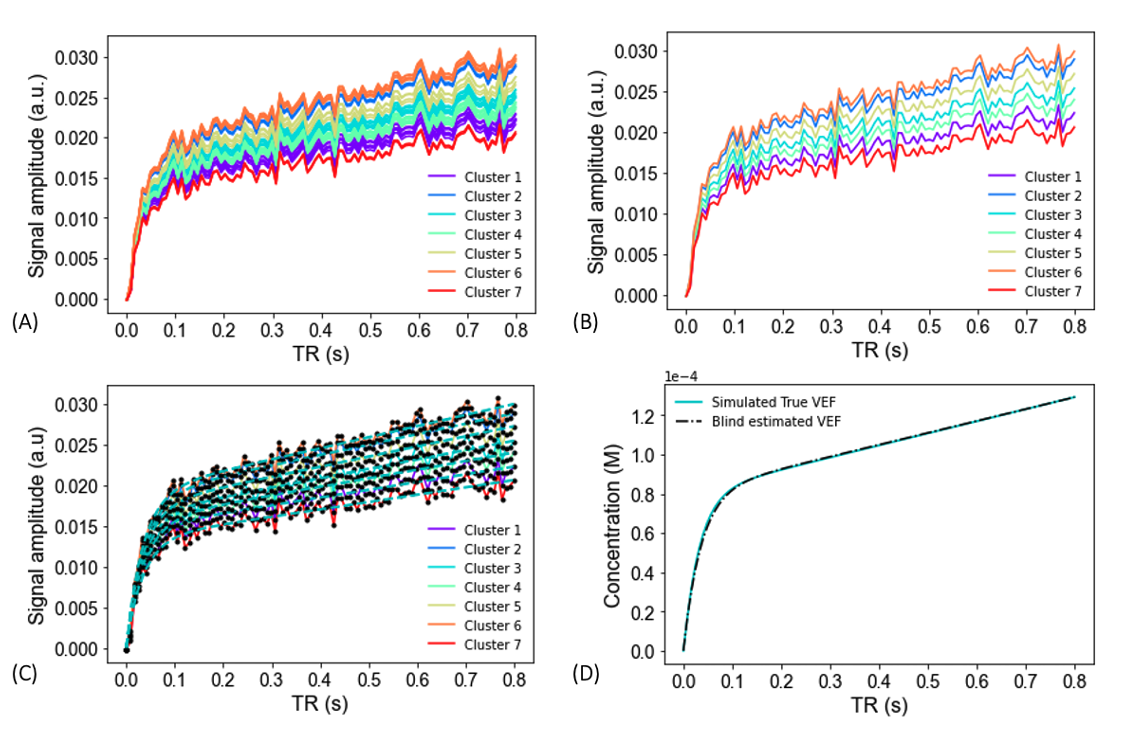
Figure 4. Simulated clustered A) and averaged curves B), alongside model convergence D), and final VEF blind estimate D) plots.
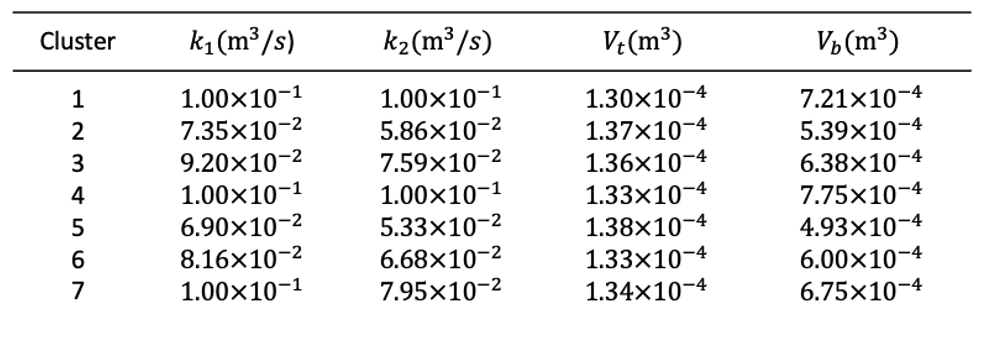
Table 1. Blind estimated kinetic parameter values within each cluster.
DOI: https://doi.org/10.58530/2023/4496