4495
Investigating Rb vapor density and temperature distributions in a high throughput 129Xe-Rb polarizer1University of Sheffield, Sheffield, United Kingdom
Synopsis
Keywords: Hyperpolarized MR (Gas), Hyperpolarized MR (Gas)
Accurate knowledge of the Rb vapor density, [Rb], is essential for optimizing 129Xe polarization (PXe) and production rates in clinical-scale 129Xe-Rb SEOP hyperpolarizers, used for hyperpolarized 129Xe MRI. We used atomic absorption spectroscopy to measure [Rb] for multiple Rb transitions to assess [Rb] measurement accuracy and extend [Rb] measurement range sensitivity. It was shown that [Rb] is significantly lower than saturation [Rb] and that [Rb] homogeneity was improved by implementing a larger Rb source distribution or a presaturator. The 129Xe-Rb spin-exchange cross section, $$$\gamma^\prime$$$, was determined to be $$$\gamma^\prime$$$= (1.2± 0.1) ×10−21m3s−1 for our operating conditions.
Introduction
Hyperpolarized 129Xe MRI is enabled by clinical-scale 129Xe-Rb SEOP hyperpolarizers, with high 129Xe polarization (PXe) and on-demand hyperpolarized 129Xe doses. Accurate knowledge of the Rb vapor density, [Rb], is essential for optimizing PXe and production rates in these hyperpolarizers. [Rb] differences have been shown to significantly contribute to the discrepancy between theoretical and measured PXe in continuous flow (CF) 129Xe-Rb SEOP hyperpolarizers [1]. [Rb] in many SEOP polarizer systems has been shown to be lower than saturation levels [2,3]. In addition, [Rb] heterogeneity in large SEOP cells, such as those implemented on our hyperpolarizer (cell volume = 3.5L), is suspected from previous simulations to be due to laser heating and Rb source distribution, reducing polarizer performance as a result [4].Atomic absorption spectroscopy can be used to directly measure [Rb] within SEOP cells [5-7]. Consideration of the optical thickness must be accounted for as deviation from Beer’s law can occur at high optical thickness, resulting in reduced accuracy of determined [Rb] when Beer’s law is assumed. However, reduced optical thickness typically also comes at the expense of lower signal-to-noise ratio (SNR), making large ranges of [Rb] difficult to measure. Previous simulation work suggested a large range of [Rb] may be present in our setup [4].
In this work we simultaneously probed multiple Rb absorption lines with different oscillator strengths, which determines the absorption coefficient for each Rb line, to characterize [Rb] measurement accuracy over a range of SEOP cell conditions. Near-infrared (52S1/2 → 52P1/2 (D1)/52P3/2 (D2)) and violet (52S1/2 → 62P1/2/62P3/2) absorption lines were used to determine [Rb]. We also assessed the accuracy of pseudo-Voigt lineshape fitting8 for low SNR violet absorption spectroscopy spectra by processing synthetic absorption spectra data with known parameters and varying SNR values. Different Rb source distributions were tested in order to assess their role in [Rb] distribution within large SEOP cells during CF-SEOP. We determined the 129Xe-Rb spin exchange cross section, $$$\gamma^\prime$$$, using [Rb] measured from absorption spectroscopy and found it to be in agreement with the range of values given in the literature.
Methods
Atomic absorption spectroscopy was performed to measure [Rb] for a range of oven temperatures (Fig. 1). Absorbance spectra, $$$S (\nu)$$$, were acquired, and pseudo-Voigt fitting applied to each transition (Fig. 2), $$$S\left ( \nu \right ) + B = \ln \left ( \frac{I_0 (\nu)}{I (\nu)} \right ) + B = A \left [ \eta L \left ( \nu \right ) + \left ( 1 - \eta \right ) G \left ( \nu \right ) \right ] + B$$$, where $$$L \left ( \nu \right )$$$ is the normalised Lorentzian, $$$G \left ( \nu \right )$$$ is the normalised Gaussian, $$$\eta$$$ is the relation coefficient between $$$L \left ( \nu \right )$$$ and $$$G \left ( \nu \right )$$$, $$$B$$$ is the baseline correction and $$$A$$$ is the baseline-corrected integral of $$$S (\nu)$$$. Rb vapour density is then calculated from Beer’s law as $$$[Rb]=1/(\sigma_0 l) \int S(\nu)d\nu= A/(\pi r_0 cfl)$$$, where $$$\sigma_0$$$ is the Rb electronic absorption cross section and $$$f$$$ is the transition-specific oscillator strength.[Rb] and cell temperatures were measured for 3 different Rb source distributions; 1g localized Rb cell, 5g spread Rb cell and 2g Rb presaturator cell. Synthetic violet absorbance spectra were also produced, with different amounts of Gaussian noise added to vary the SNR. Pseudo-Voigt fitting was then applied and the mean absolute percentage error of $$$A$$$ for each SNR was determined. Spin-down (129Xe T1 relaxation) measurements were performed for different [Rb] in order to determine $$$\gamma^\prime$$$.
Results and Discussion
We were able to quantify deviation from Beer's law at high optical depth for D2 and 62P3/2 absorption by comparison with measurements of the D1 and 62P1/2 absorption line, respectively. D2 absorption deviates from Beer's law at [Rb]D2 > 4 ×10⁻¹⁷m-3 whilst 62P3/2 absorption deviates from Beer's law at [Rb]6P3/2 > 6.22 ×10⁻¹⁹m-3 (Fig. 3).Fig. 4 shows that violet absorbance spectra SNR of greater than 8 lead to a mean absolute percentage error of less than 20%, which we used to threshold our data.
Fig. 5 shows that significant [Rb] heterogeneity was observed in a SEOP cell containing 1g of Rb localized at the back of the cell. While [Rb] homogeneity was improved for a greater surface area of the Rb source distribution in the cell, or by using a Rb presaturator, the measured [Rb] was consistently lower than that predicted by saturation Rb vapor density curves.
The 129Xe-Rb spin exchange cross section was measured to be $$$\gamma^\prime$$$ = (1.2± 0.1) ×10−21m3s−1, consistent with spin-exchange cross sections reported in the literature.
These results demonstrate accurate [Rb] measurement using atomic absorption spectroscopy. [Rb] homogeneity improvement is also shown by implementing a presaturator or a higher surface area Rb source.
Conclusions
We show here that [Rb]D2 and [Rb]6P3/2 accuracy is reduced significantly due to deviation from Beer’s law at [Rb]D2 > 4 ×10⁻¹⁷m-3 and [Rb]6P3/2 > 6.22 ×10⁻¹⁹m-3 respectively. [Rb] homogeneity in SEOP cells is improved with a 5g Rb cell or presaturator, compared to a localized 1g Rb cell.Future work will look to optimize thermal conditions for a presaturator cell to maximize PXe and production rates in 129Xe-Rb SEOP hyperpolarizers.
Acknowledgements
The authors are grateful to Oliver Rodgers and Ryan Munro for help assembling the polarizer. We are also thankful for helpful discussions with Earl Babcock and Boyd Goodson about Beer’s law and atomic absorption spectroscopy considerations. This work was funded by the Academy of Medical Sciences Springboard award grant R/162501-1; the Medical Research Council grant MR/M022552/1; and Linde gas recycling grant R/158129.References
1. Kelley, M.; Branca, R.T. Theoretical models of spin-exchange optical pumping: Revisited and reconciled. Journal of Applied Physics 2021, 129, 154901
2. Kelley, M.; Burant, A.; Branca, R.T. Resolving the discrepancy between theoretical and experimental polarization of hyperpolarized 129Xe using numerical simulations and in situ optical spectroscopy. Journal of Applied Physics 2020, 128, 144901.
3. Plummer, J.W.; Emami, K.; Dummer, A.; Woods, J.C.; Walkup, L.L.; Cleveland, Z.I. A semi-empirical model to optimize continuous-flow hyperpolarized 129Xe production under practical cryogenic-accumulation conditions. Journal of Magnetic Resonance 2020, 320, 10684
4. Ball, J.; Wild, J.M.; Norquay, G. Modelling realistic Rb density and temperature distributions in a high throughput xenon-129 polariser. In Proceedings of the ISMRM 2021-Annual Meeting of the International Society for Magnetic Resonance in Medicine, 2021
5. Vliegen, E.; Kadlecek, S.; Anderson, L.W.; Walker, T.G.; Erickson, C.J.; Happer, W. Faraday rotation density measurements of optically thick alkali metal vapors. Nuclear Instruments and Methods in Physics Research Section A: Accelerators, Spectrometers, Detectors and Associated Equipment 2001, 460, 444–450
6. Chann, B.; Babcock, E.; Anderson, L.W.; Walker, T.G. Measurements of 3He spin-exchange rates. Physical Review A 2002, 66, 3270
7. Antonacci, M.; Burant, A.; Wagner, W.; Branca, R. Depolarization of nuclear spin polarized 129Xe gas by dark rubidium during spin-exchange optical pumping. Journal of Magnetic Resonance 2017, 279, 60–67
8. Stancik, A.L.; Brauns, E.B. A simple asymmetric lineshape for fitting infrared absorption spectra. Vibrational Spectroscopy 2008, 47, 66–69
Figures
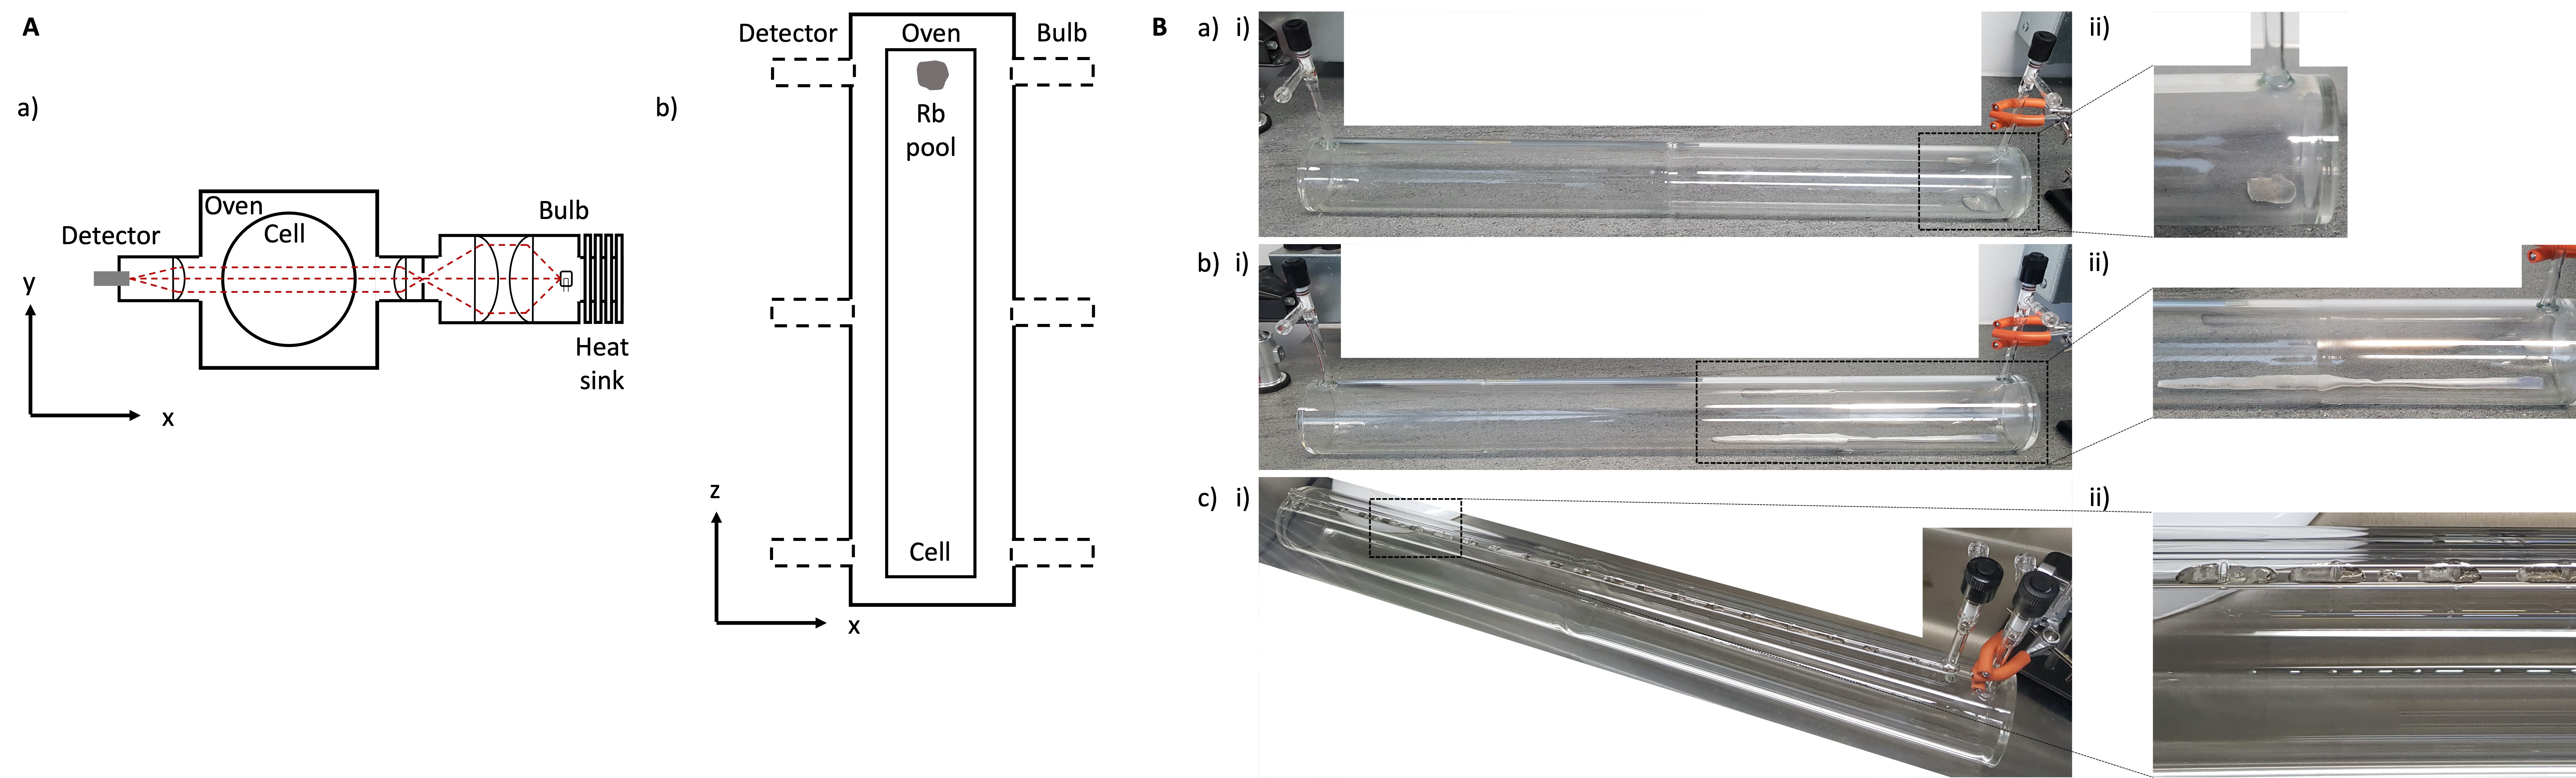
Fig. 1: (A) a) Setup for absorption spectroscopy consisting of a halogen bulb as the broad spectral light source. A series of lenses directs a parallel light beam onto the SEOP cell. A lens collects light and couples it to the optical fibre and to the spectrometer. (b) This was placed at 3 different positions along the length of the cell. (B) SEOP cells with different Rb source distributions; (a) 1g of Rb placed at the back of the cell; (b) 5g of Rb placed in the cell; (c) 2g of Rb distributed along the presaturator, (i) showing the geometry of the cell and (ii) showing a close-up of the Rb distribution.
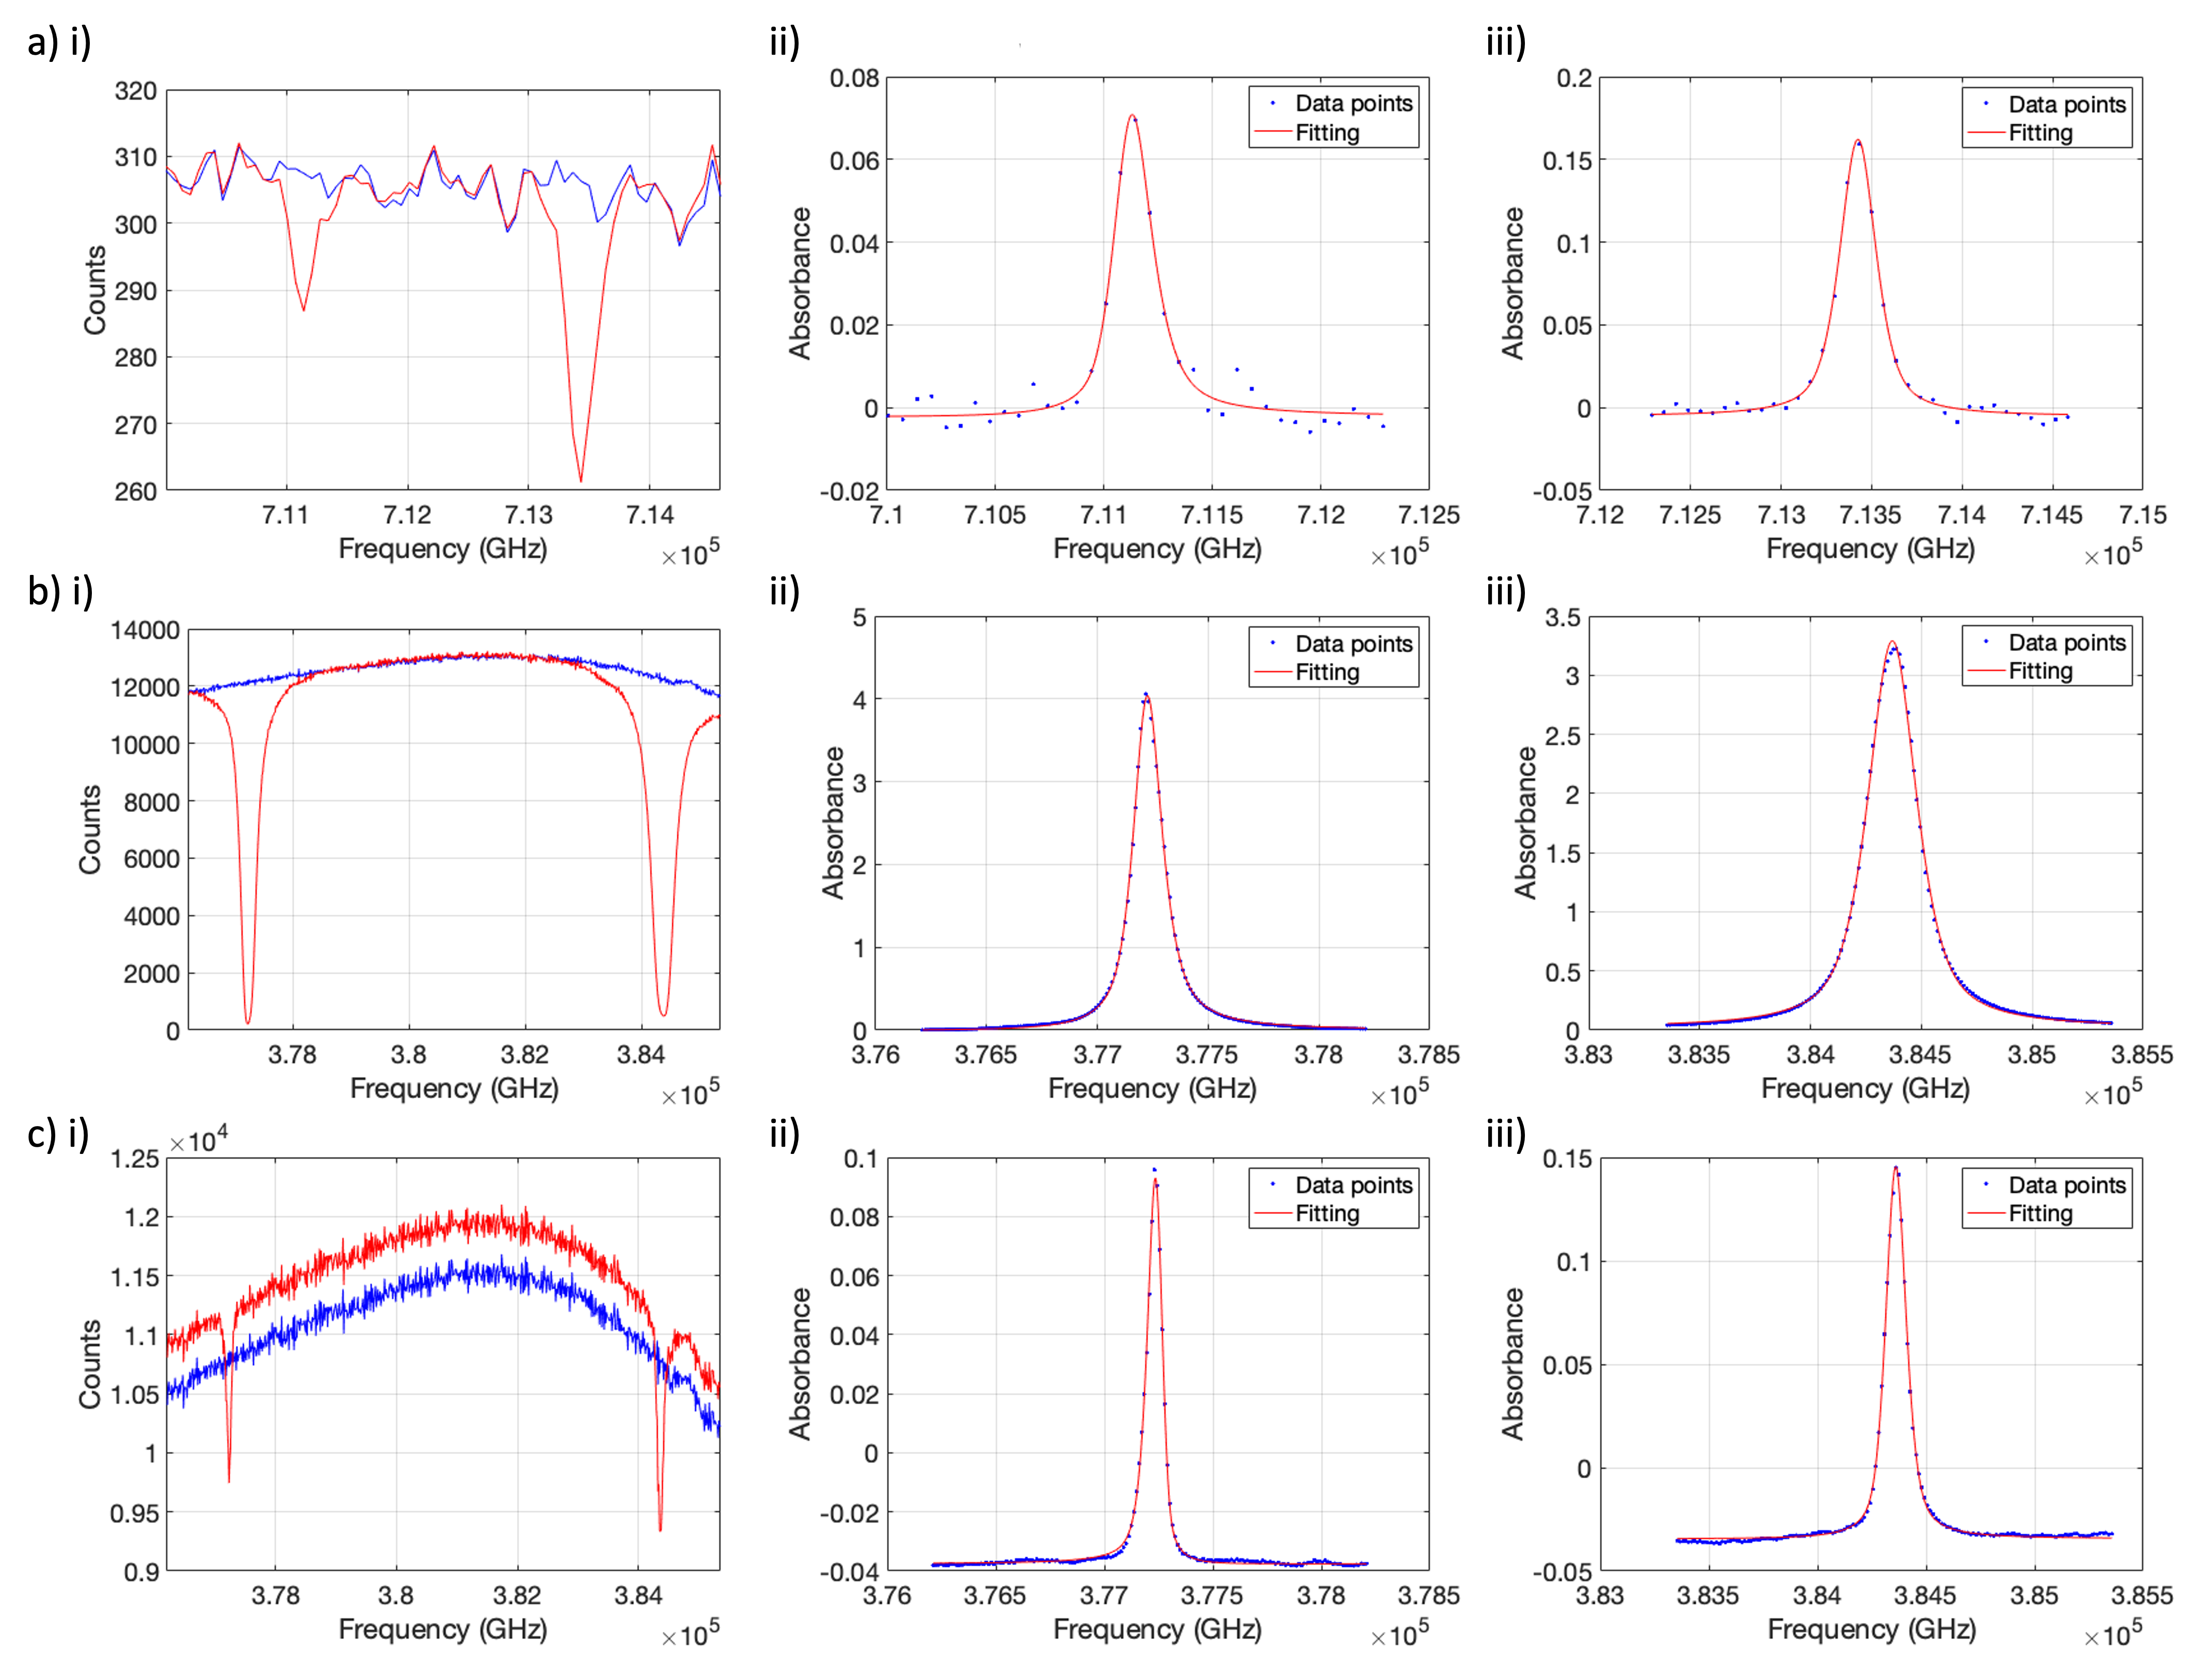
Fig. 2: (a) Violet and (b) NIR spectra acquired at cell position = −36cm, at oven temperature, Toven ∼20◦C, I0(ν) (blue) and Toven = 145◦C, I(ν) (red). Corresponding pseudo-Voigt fitted absorbance spectra for the 5S1/2 → (aii) 6P1/2, (aiii) 6P3/2, (bii) 5P1/2 (D1), (biii) 5P3/2 (D2) transitions. (c) Example of NIR spectra acquired at cell position = 36cm, at Toven ∼20◦C I0(ν) (blue) and Toven = 125◦C, where low [Rb] is observed.
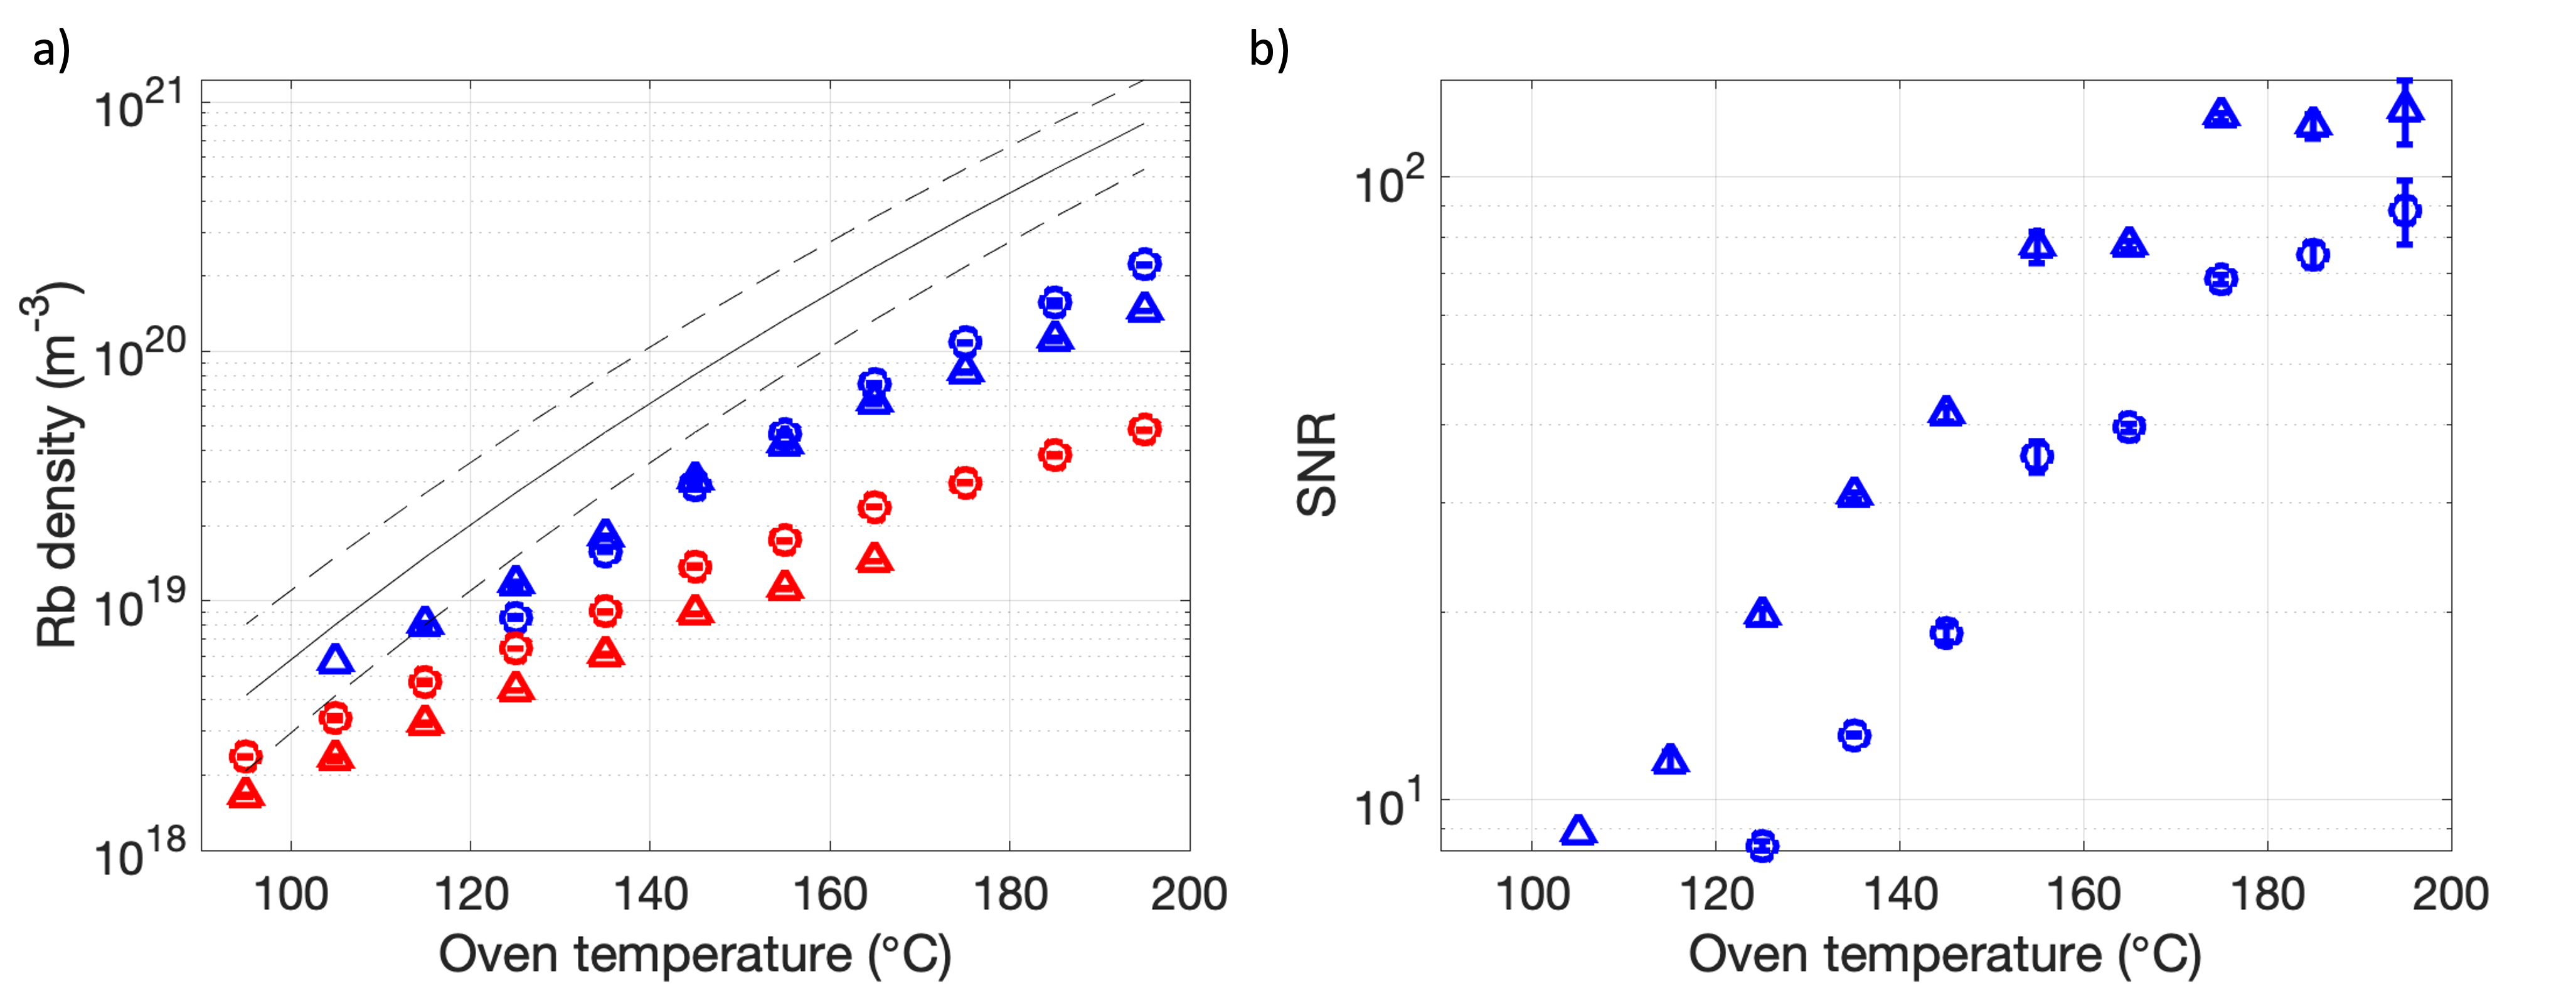
Fig. 3: (a) Rb densities measured from the 5S1/2 → 6P1/2 (blue circles), 6P3/2 (blue triangles), 5P1/2 (D1) (red circles), 5P3/2 (D2) (red triangles) transitions vs. Toven. The black line is saturation Rb density calculated based on Toven and dashed lines indicate Toven ± 10◦C. (b) Corresponding signal-to-noise ratio (SNR) for violet absorbance spectrum.
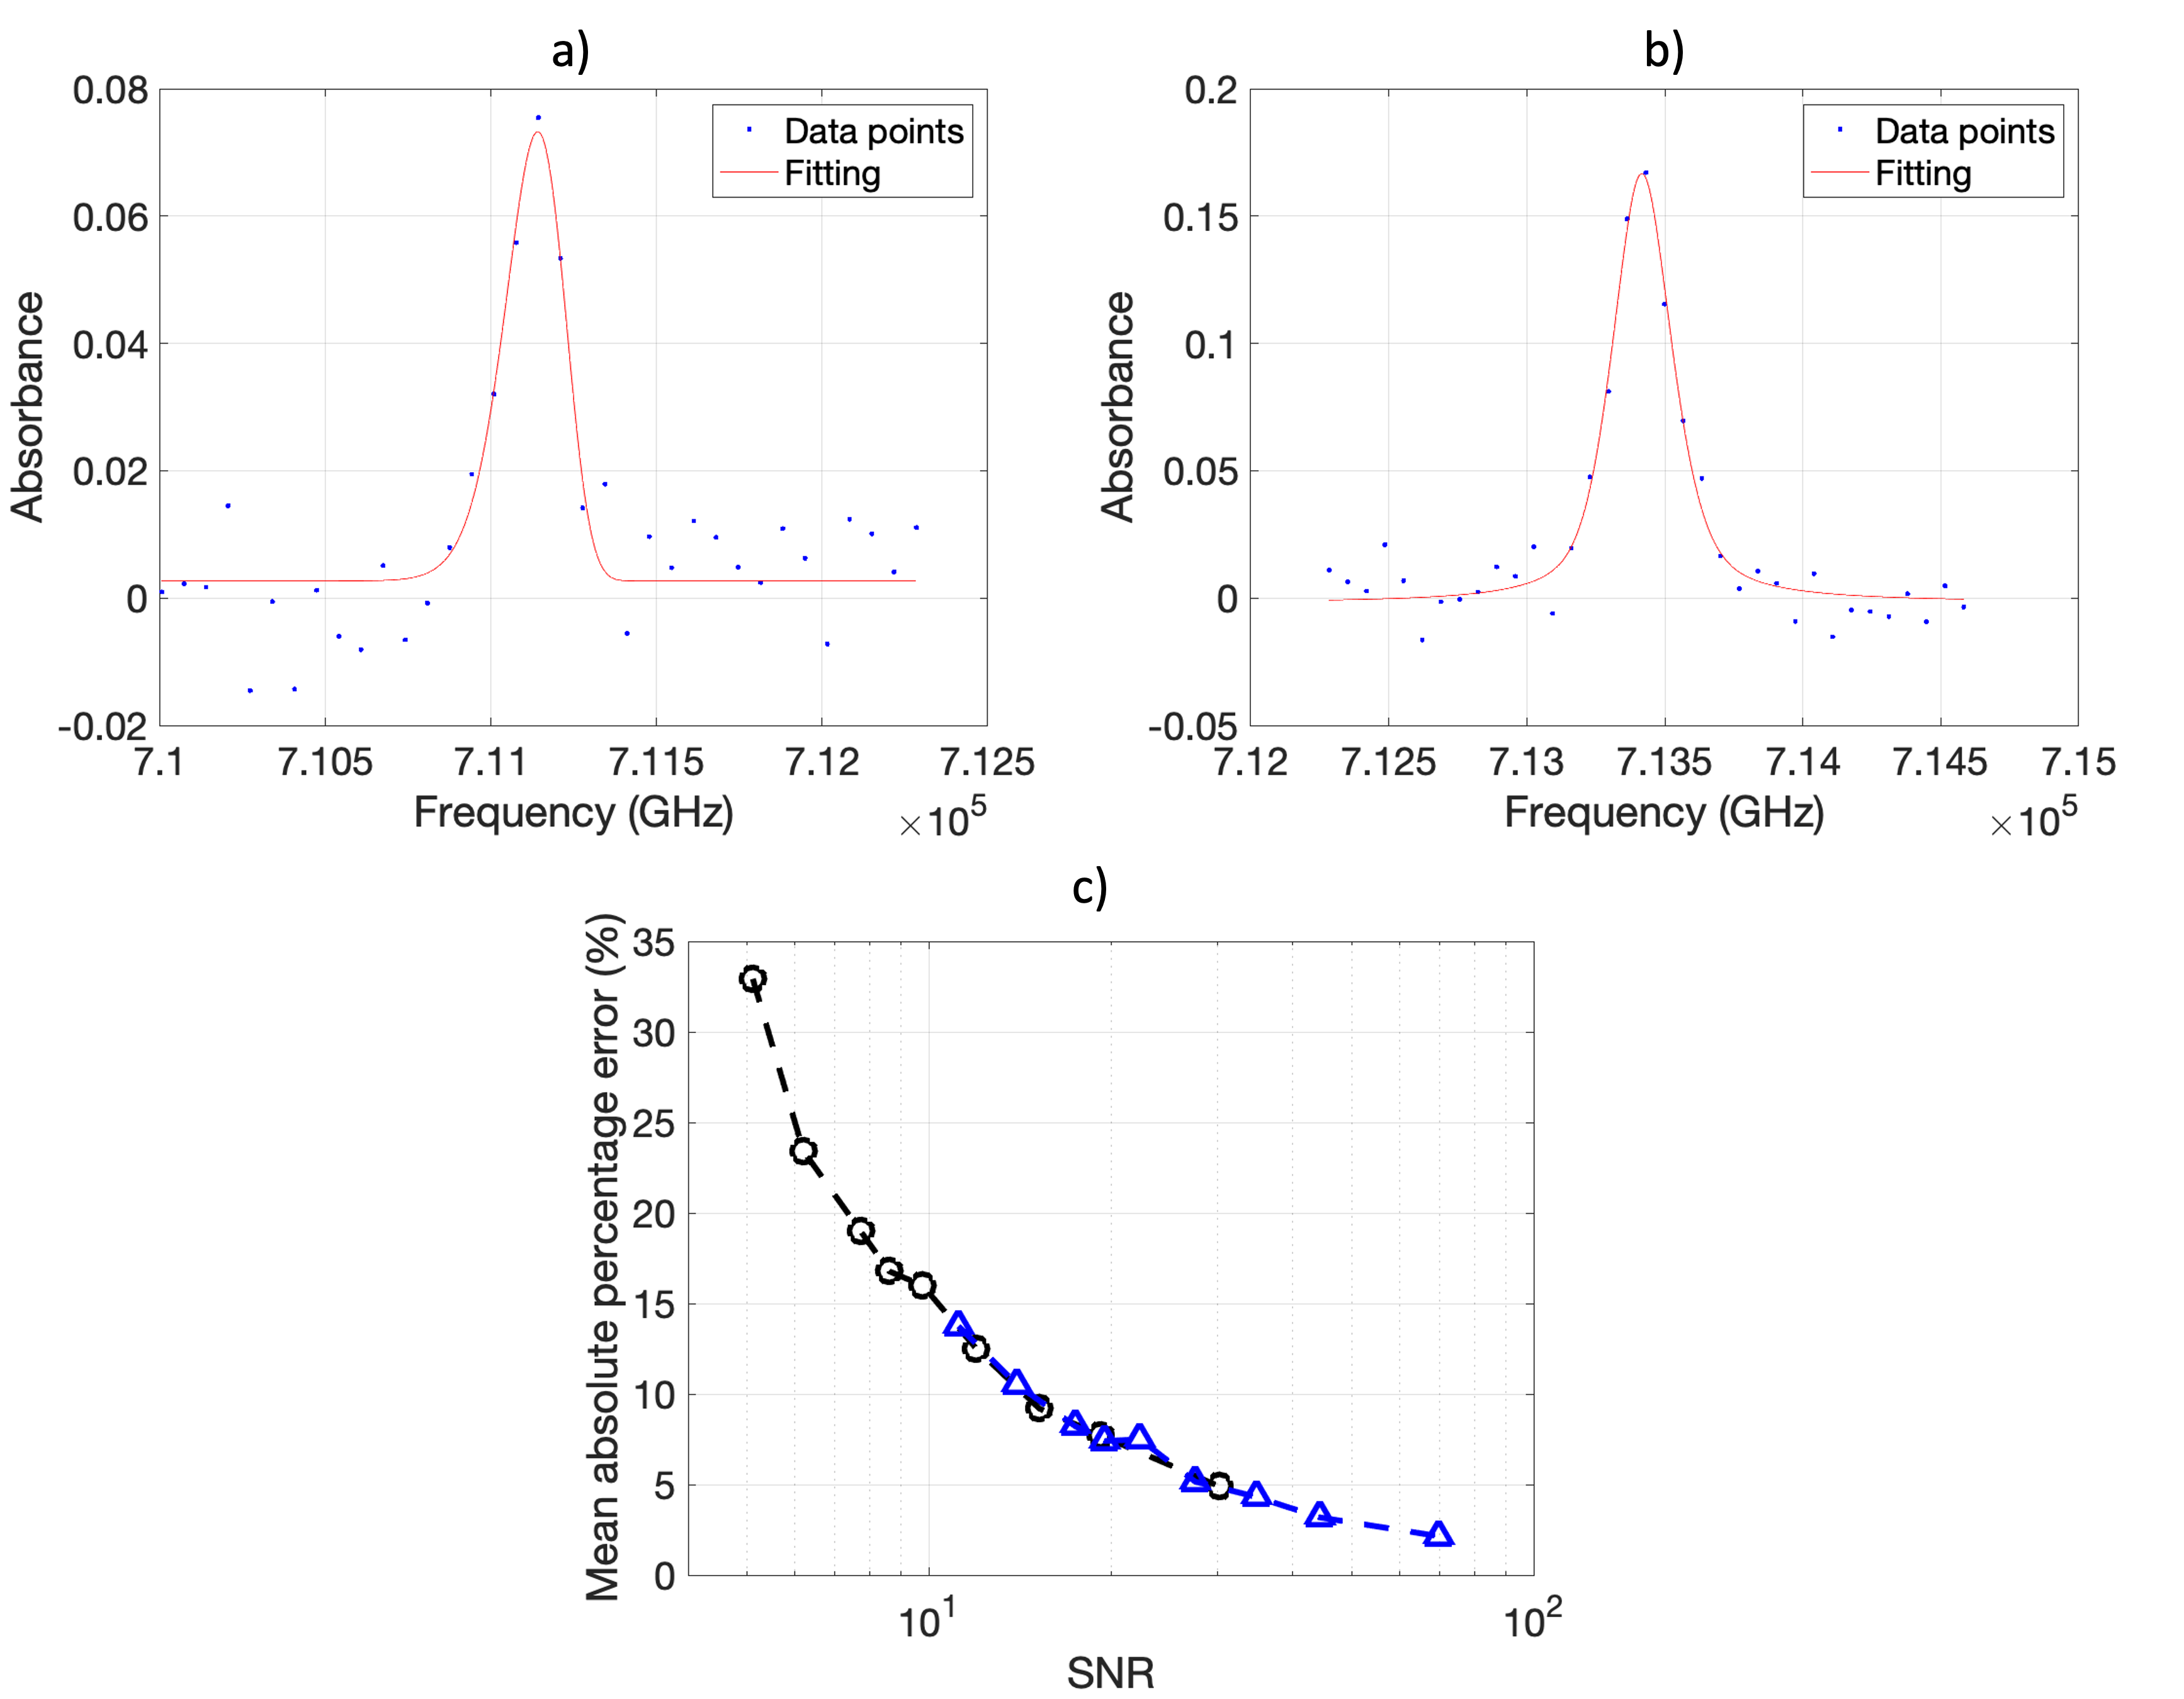
Fig. 4: Synthetic absorption spectroscopy spectra and pseudo-Voigt fitting for (a) 5S1/2 → 6P1/2 transition and (b) 5S1/2 → 6P3/2 transition (c) Mean absolute percentage error vs SNR for 5S1/2 → 6P1/2 (black circles), 6P3/2, (blue triangles). n = 200, number of repeats. Dashed lines are to guide the eye only.
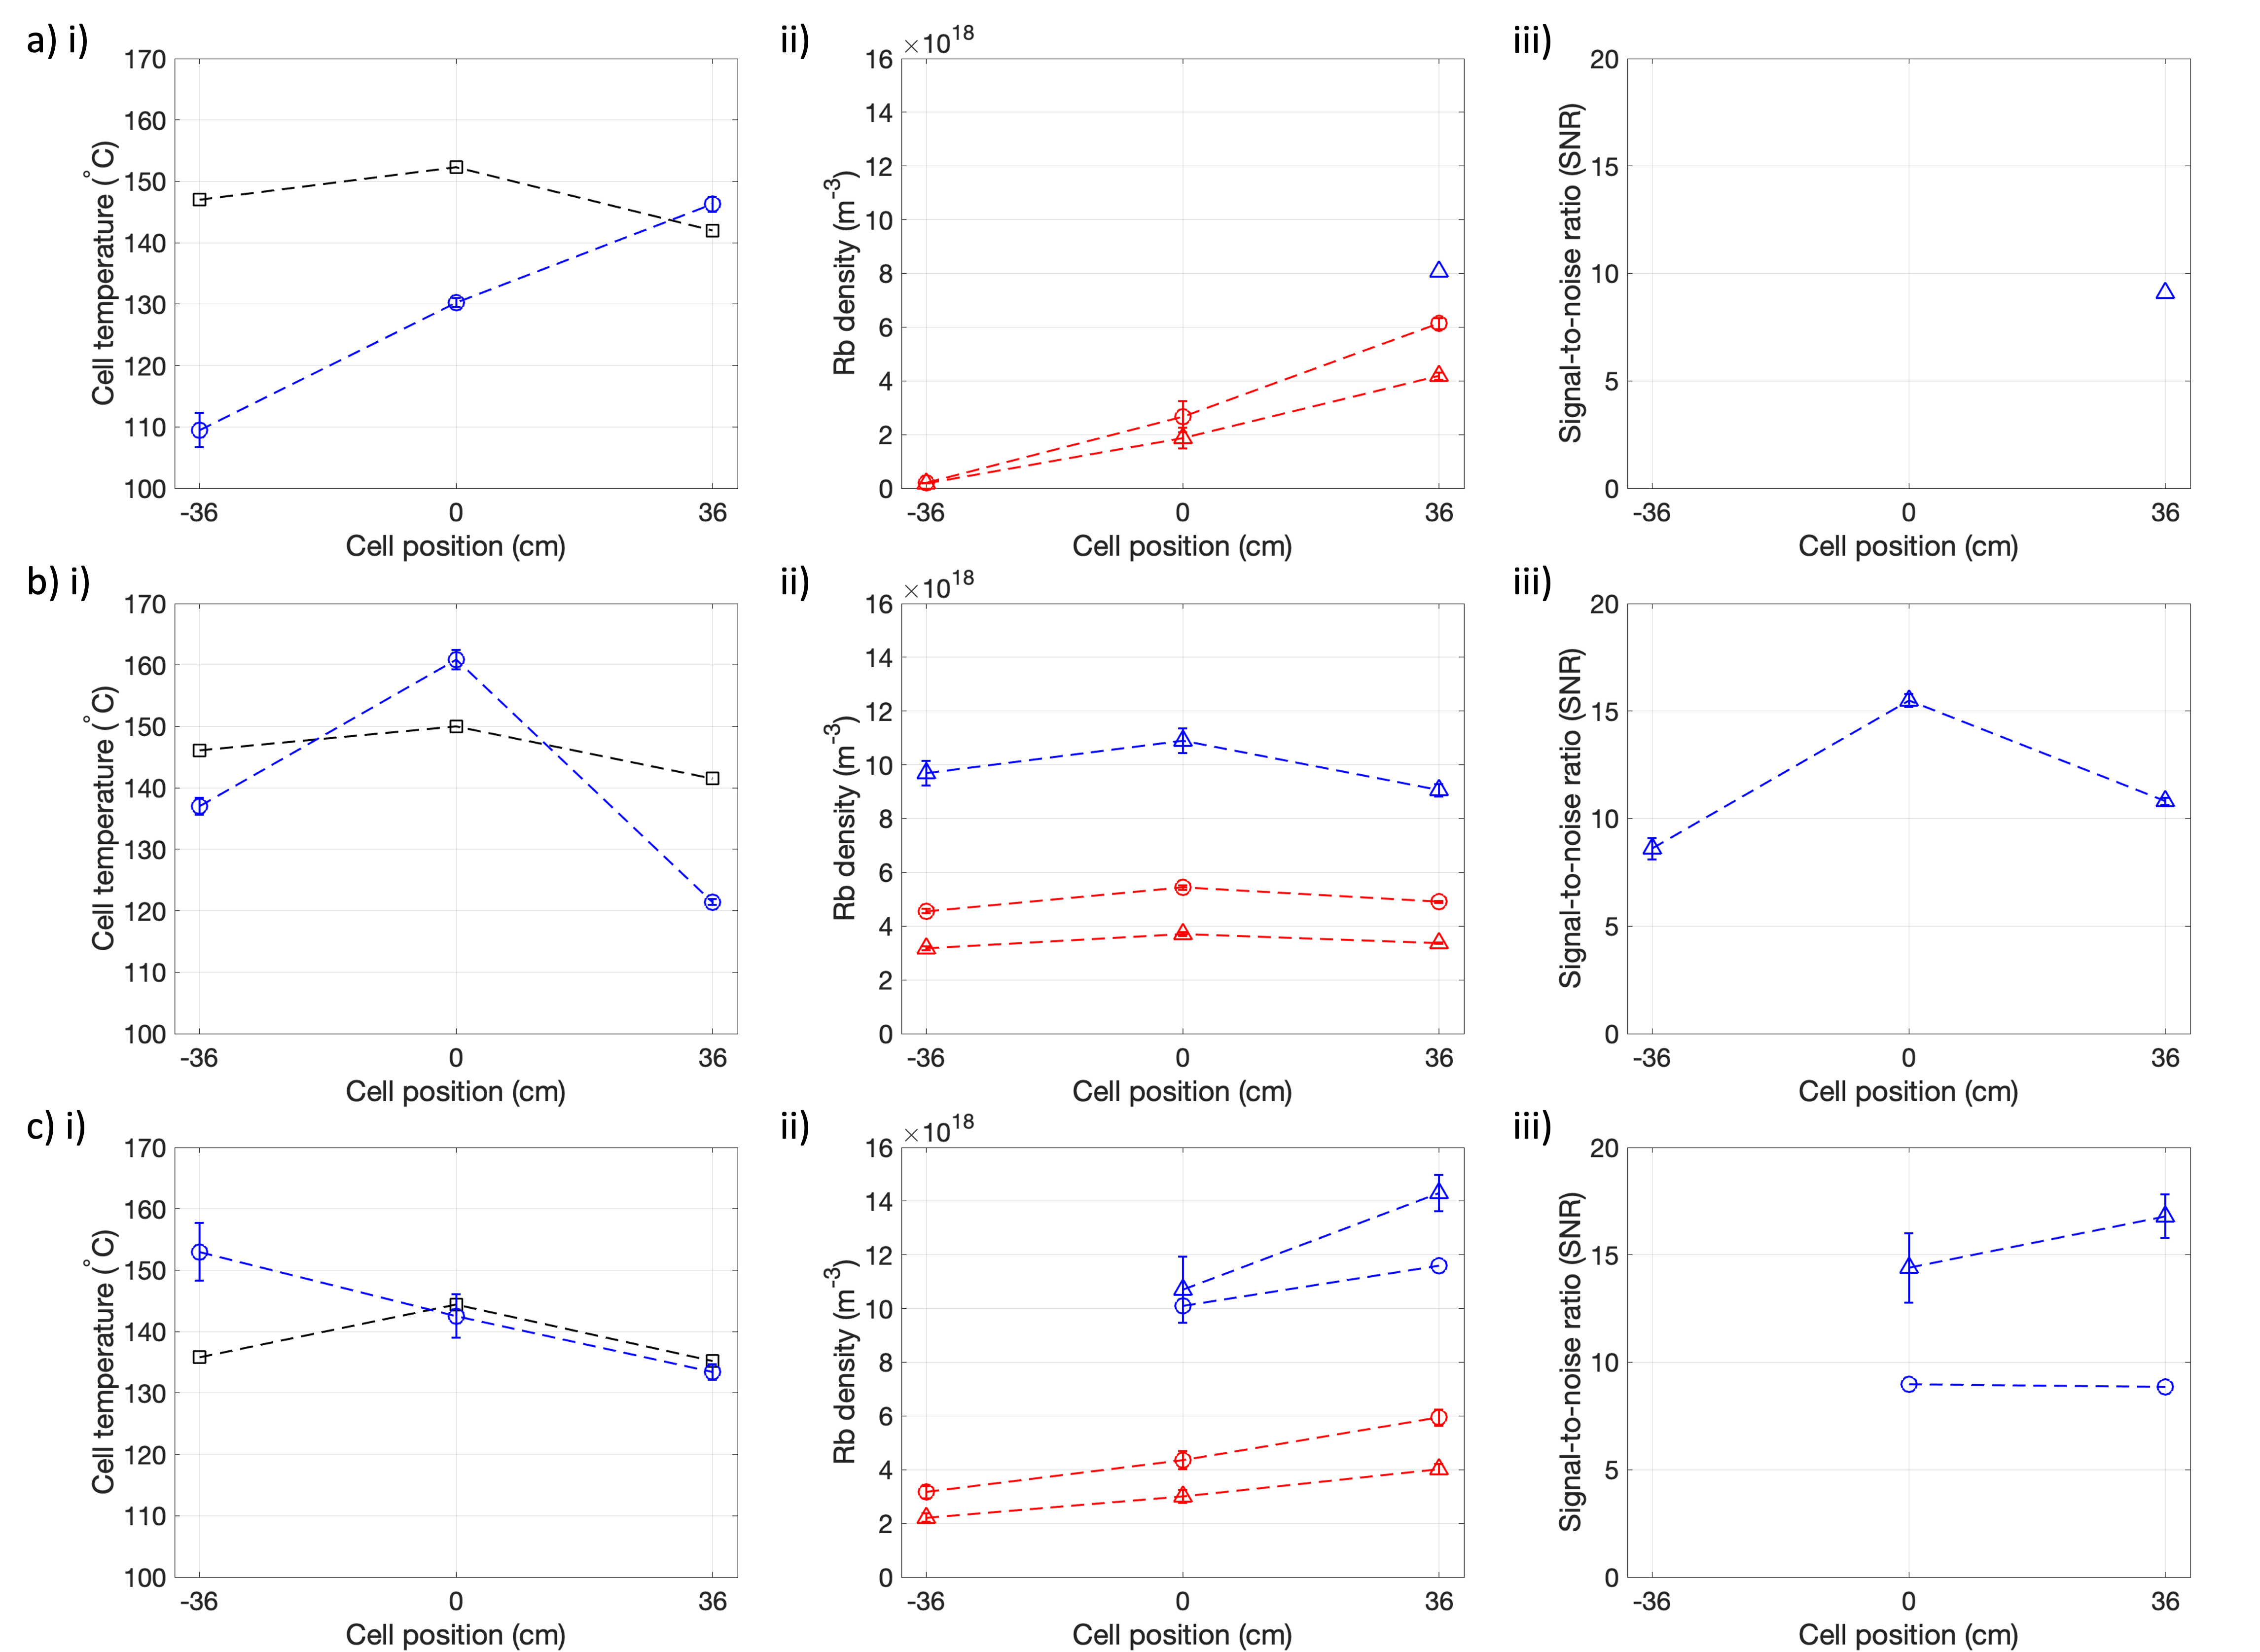
Fig. 5: (i) Cell temperature, Tcell, (ii) Rb density, [Rb] (iii) signal-to-noise ratio (SNR) in violet absorbance spectra for different cell positions for (a) 1g Rb main body cell, (b) 5g Rb main body cell and (c) 2g Rb presaturator cell. Tcell was measured during continuous flow SEOP (blue triangles) and with the cell closed without the pumping laser present (black squares). Rb densities measured from the 5S1/2 → 6P1/2 (blue circles), 6P3/2 (blue triangles), 5P1/2 (D1) (red circles), 5P3/2 (D2) (red triangles) transitions.