4494
T1 Relaxation Anisotropy in White Matter is Directly Linked to the Axon Fibre Orientation in the Magnetic Field1University of Bristol, Bristol, United Kingdom, 2University of Minnesota, Minneapolis, MN, United States, 3University of Eastern Finland, Kuopio, Finland
Synopsis
Keywords: Relaxometry, Contrast Mechanisms
Interrelationships between T1 relaxation time and axon fibre orientation in midsagittal corpus callosum (CC) were studied in human brain in vivo at 3T and 7T as well as in a rat brain ex vivo at 9.4T. It was observed that in the same CC tracts in vivo the change in T1 results from altered fibre orientation with respect to B0. In the rat brain, ex vivo rotation of a given midsagittal CC ROI produced angular T1 plots that match those observed in vivo. Thus, axon fibre orientation is directly linked to T1 relaxation anisotropy.Introduction
It has been observed that T1 in white matter (WM) is influenced by axon diameter [1] and its orientation relative to the direction of B0 [2, 3]. The studies on orientation dependency of T1 in WM have used dMRI microstructural indices, such as fractional anisotropy (FA), to select structurally anisotropic tissue where axon orientation is estimated from the principal diffusion direction [2-4]. Plots of T1 versus orientation angle have shown a broad peak centered around 50o at 3T and that T1 is shorter in fibres that are perpendicular to B0 at 7T. However, to unambiguously demonstrate that WM microstructure causes T1 anisotropy, one must show that T1 in the same WM tract changes when the orientation of the given tract is rotated in B0 [5]. Here, we have studied T1 relaxation and WM fibre orientation in human corpus callosum (CC) exploiting the inherent variation of fibre tract orientations in vivo as well as rotated rat CC ex vivo preparation in B0.Experimental
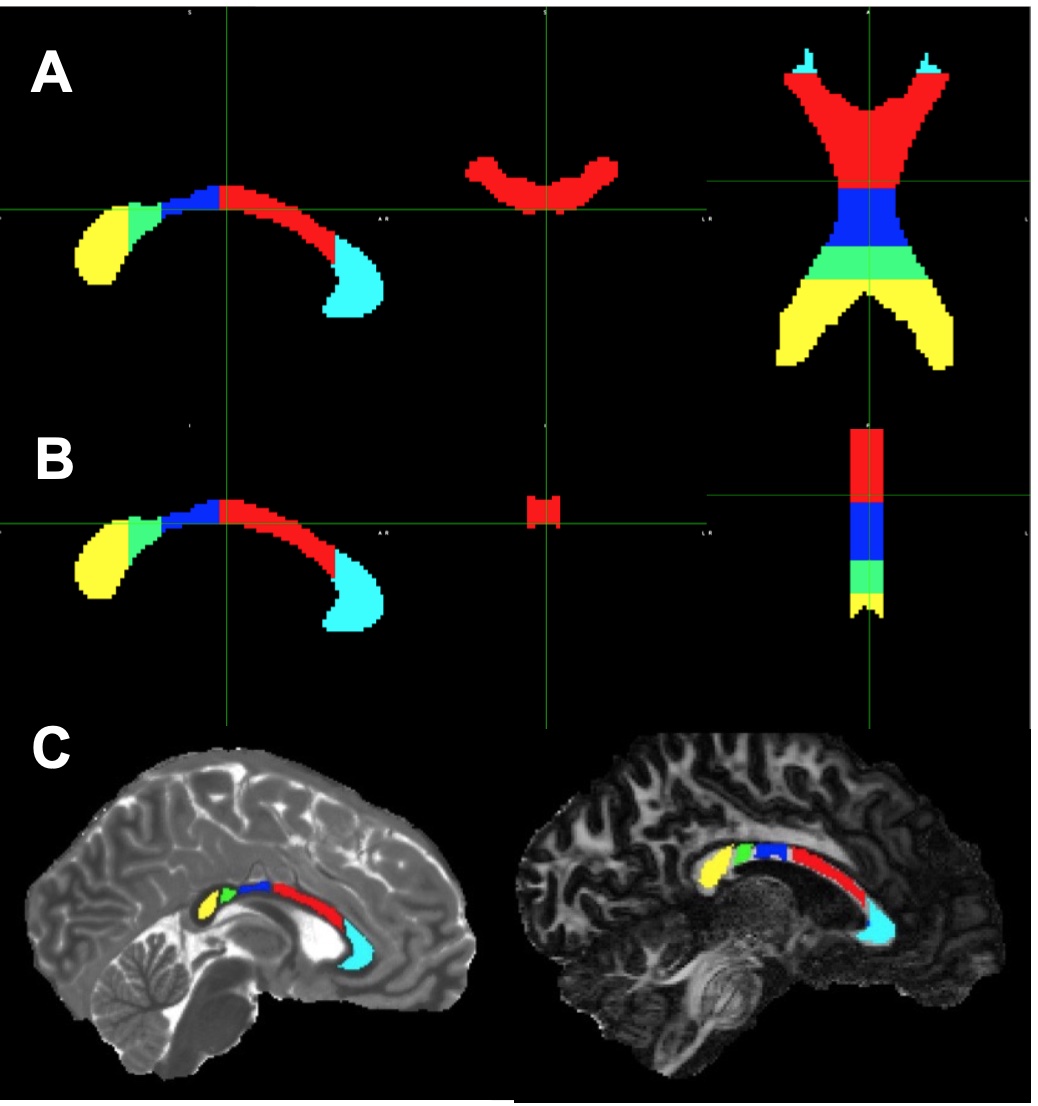
The University of Minnesota IRB approved the protocol. Six healthy volunteers (mean age 27 years, 2 females) consented to participate and underwent brain MRI as described previously [4]. dMRI scans were corrected for distortion artifacts and subject motion using TOPUP and EDDY in FSL [6, 7]. A DTI model was fitted to the corrected data using DTIFIT in FSL [8]. Fibre-to-field angle maps (qFB) were computed using the principal eigenvector images [2]. We segmented the CC for the ROI analyses using the JHU ICBM atlas [9]. Two sets of the CC masks were registered to T1 and FA maps (Fig. 1), anatomical match of ROIs with the CC were visually inspected. An adult male rat was transcardially perfused under deep anaesthesia and a brain specimen prepared for MRI as described [10]. The CC specimen was cut to harvest the posterior CC using a 6 mm biopsy punch, placed in a sample holder and inserted into a rotation device [11] positioned into a 9.4T magnet interfaced to a Varian DirectDrive console. The set up allowed rotation of the specimen in the B0 around the cranio-caudal axis. 3-D dMRI were collected at 0o rotation when the slice orientation matched the axial plane of the brain. Both IR-TSE and IR-Look-Locker pulse sequences were used to acquire images for T1 maps. T1 maps for each rotation (0° -- 120°) were co-registered to the T1 map at 0° rotation.Results
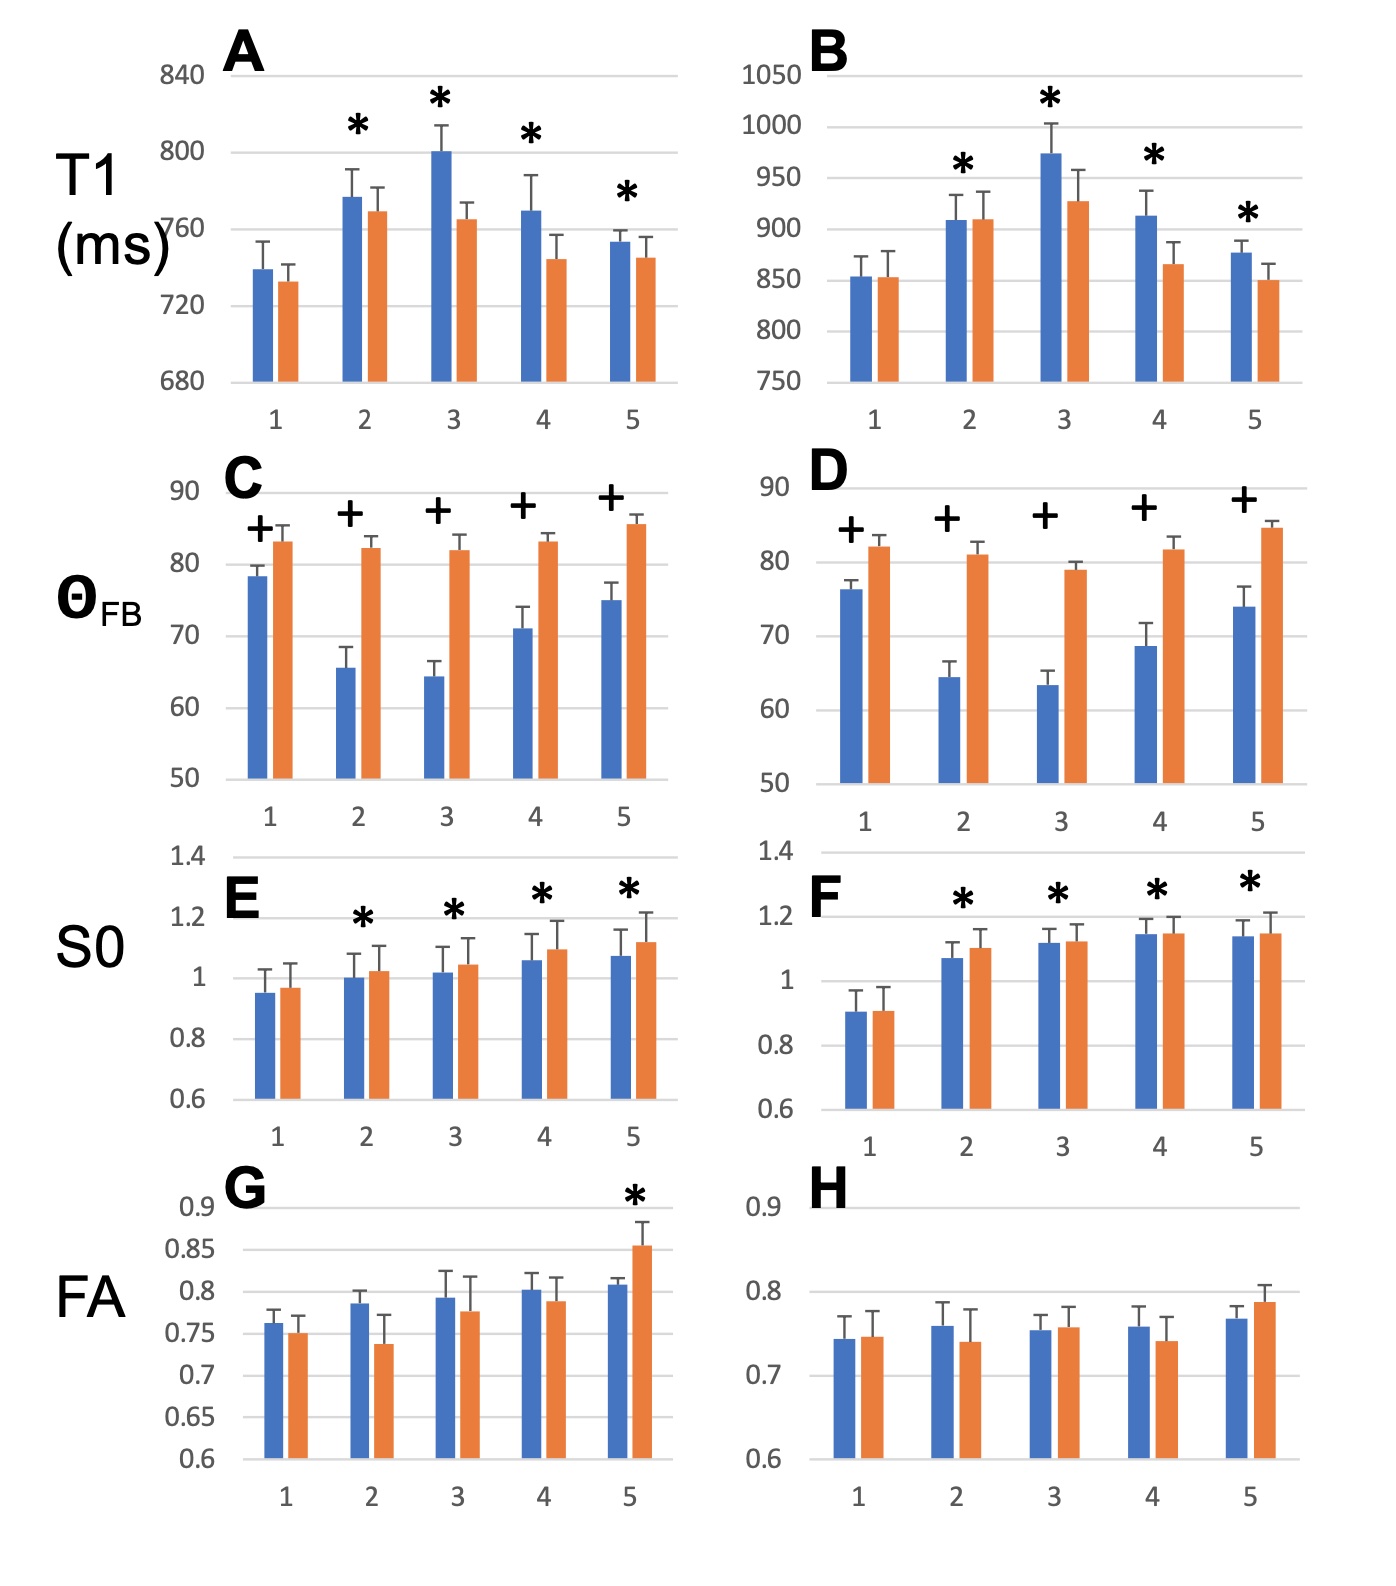
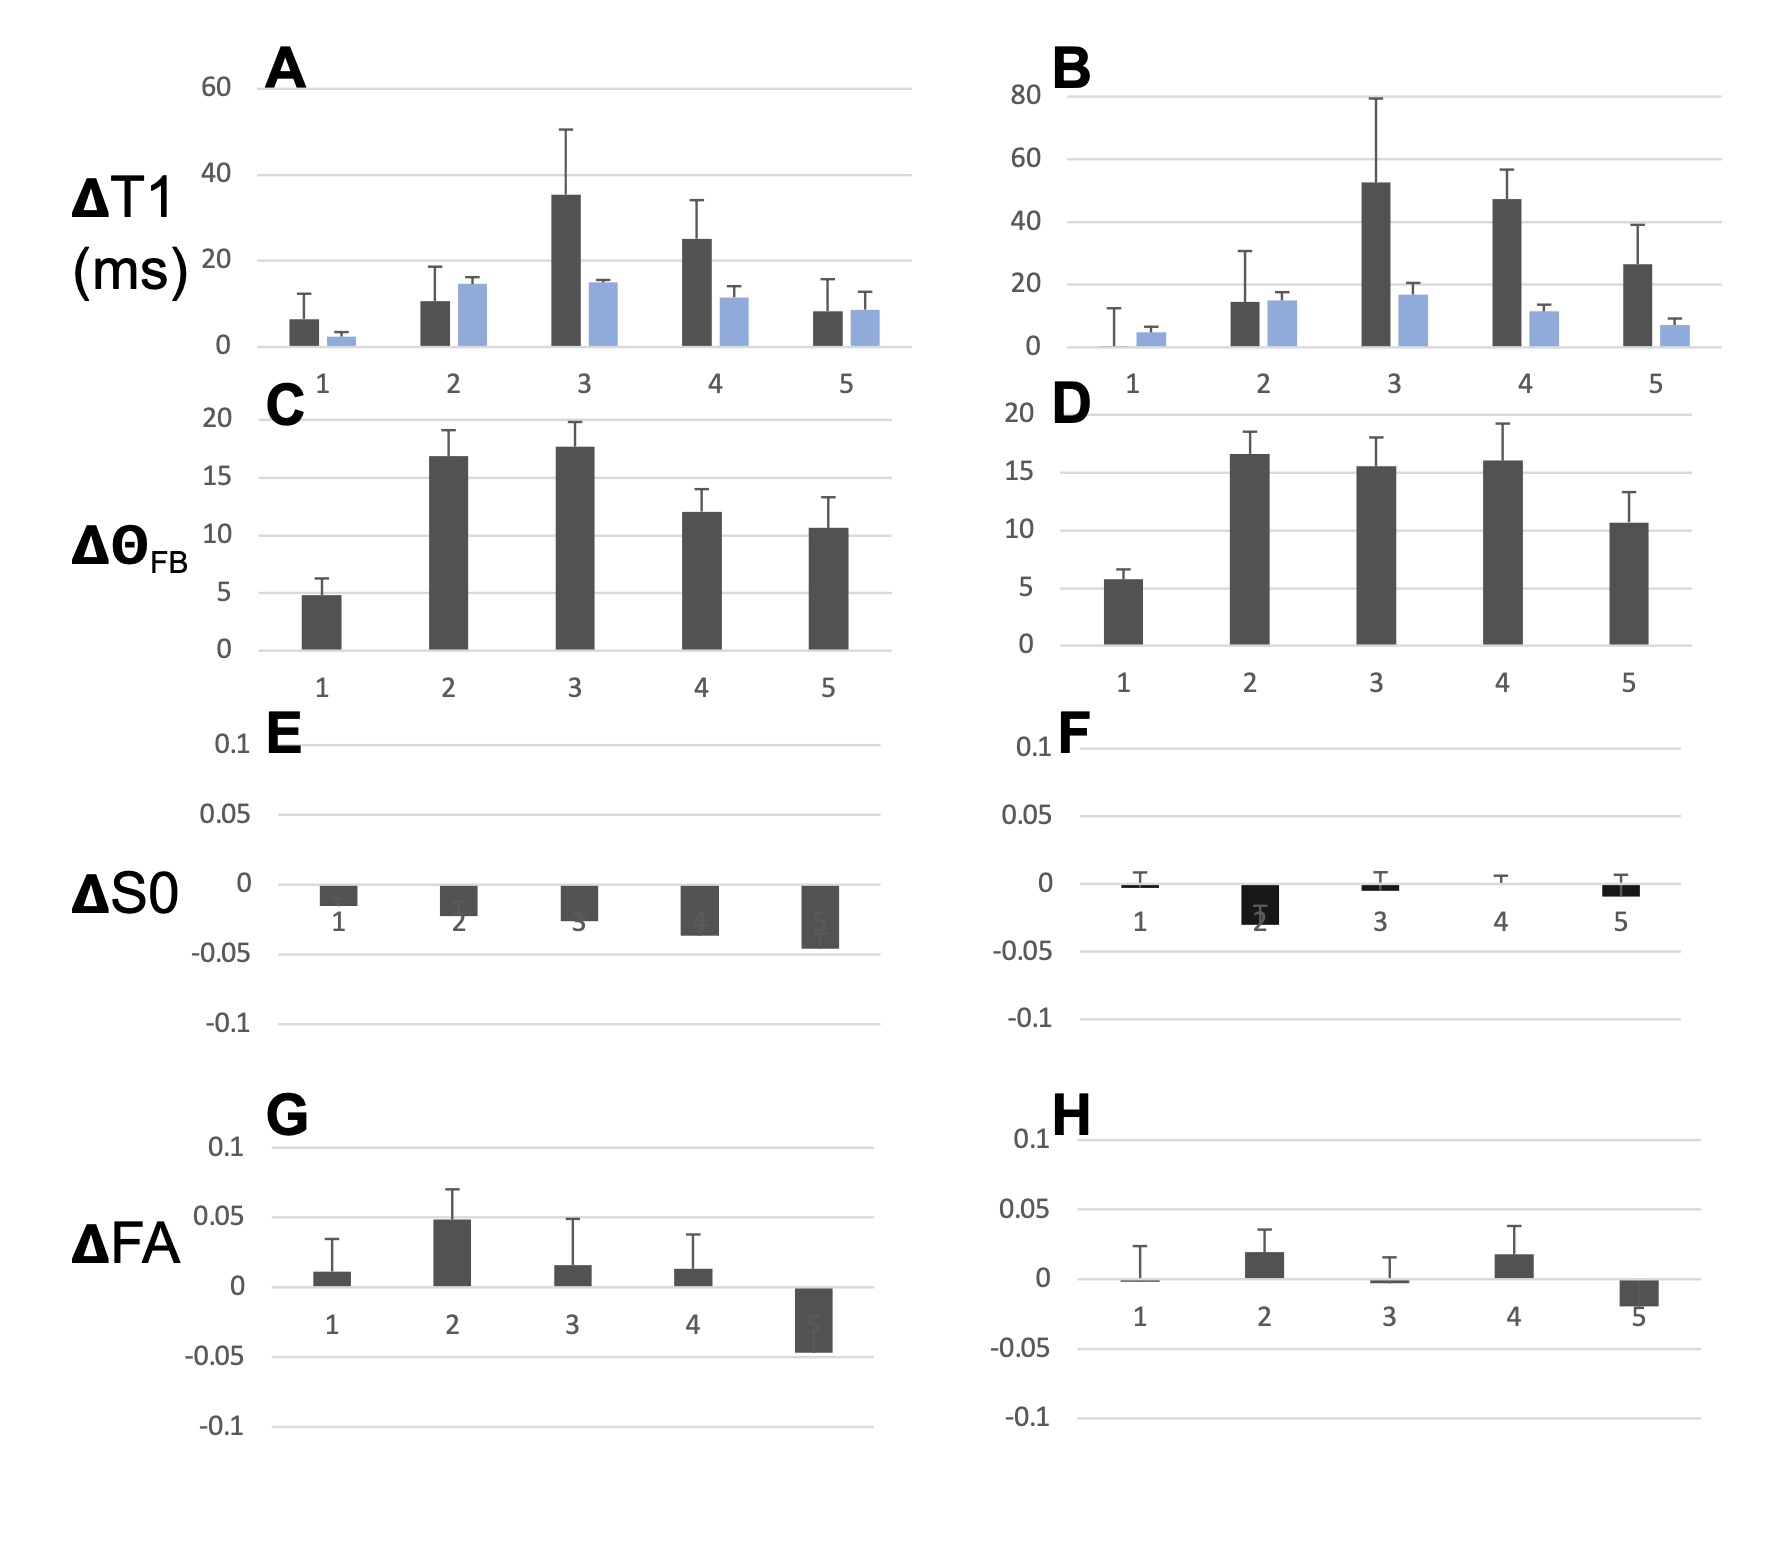
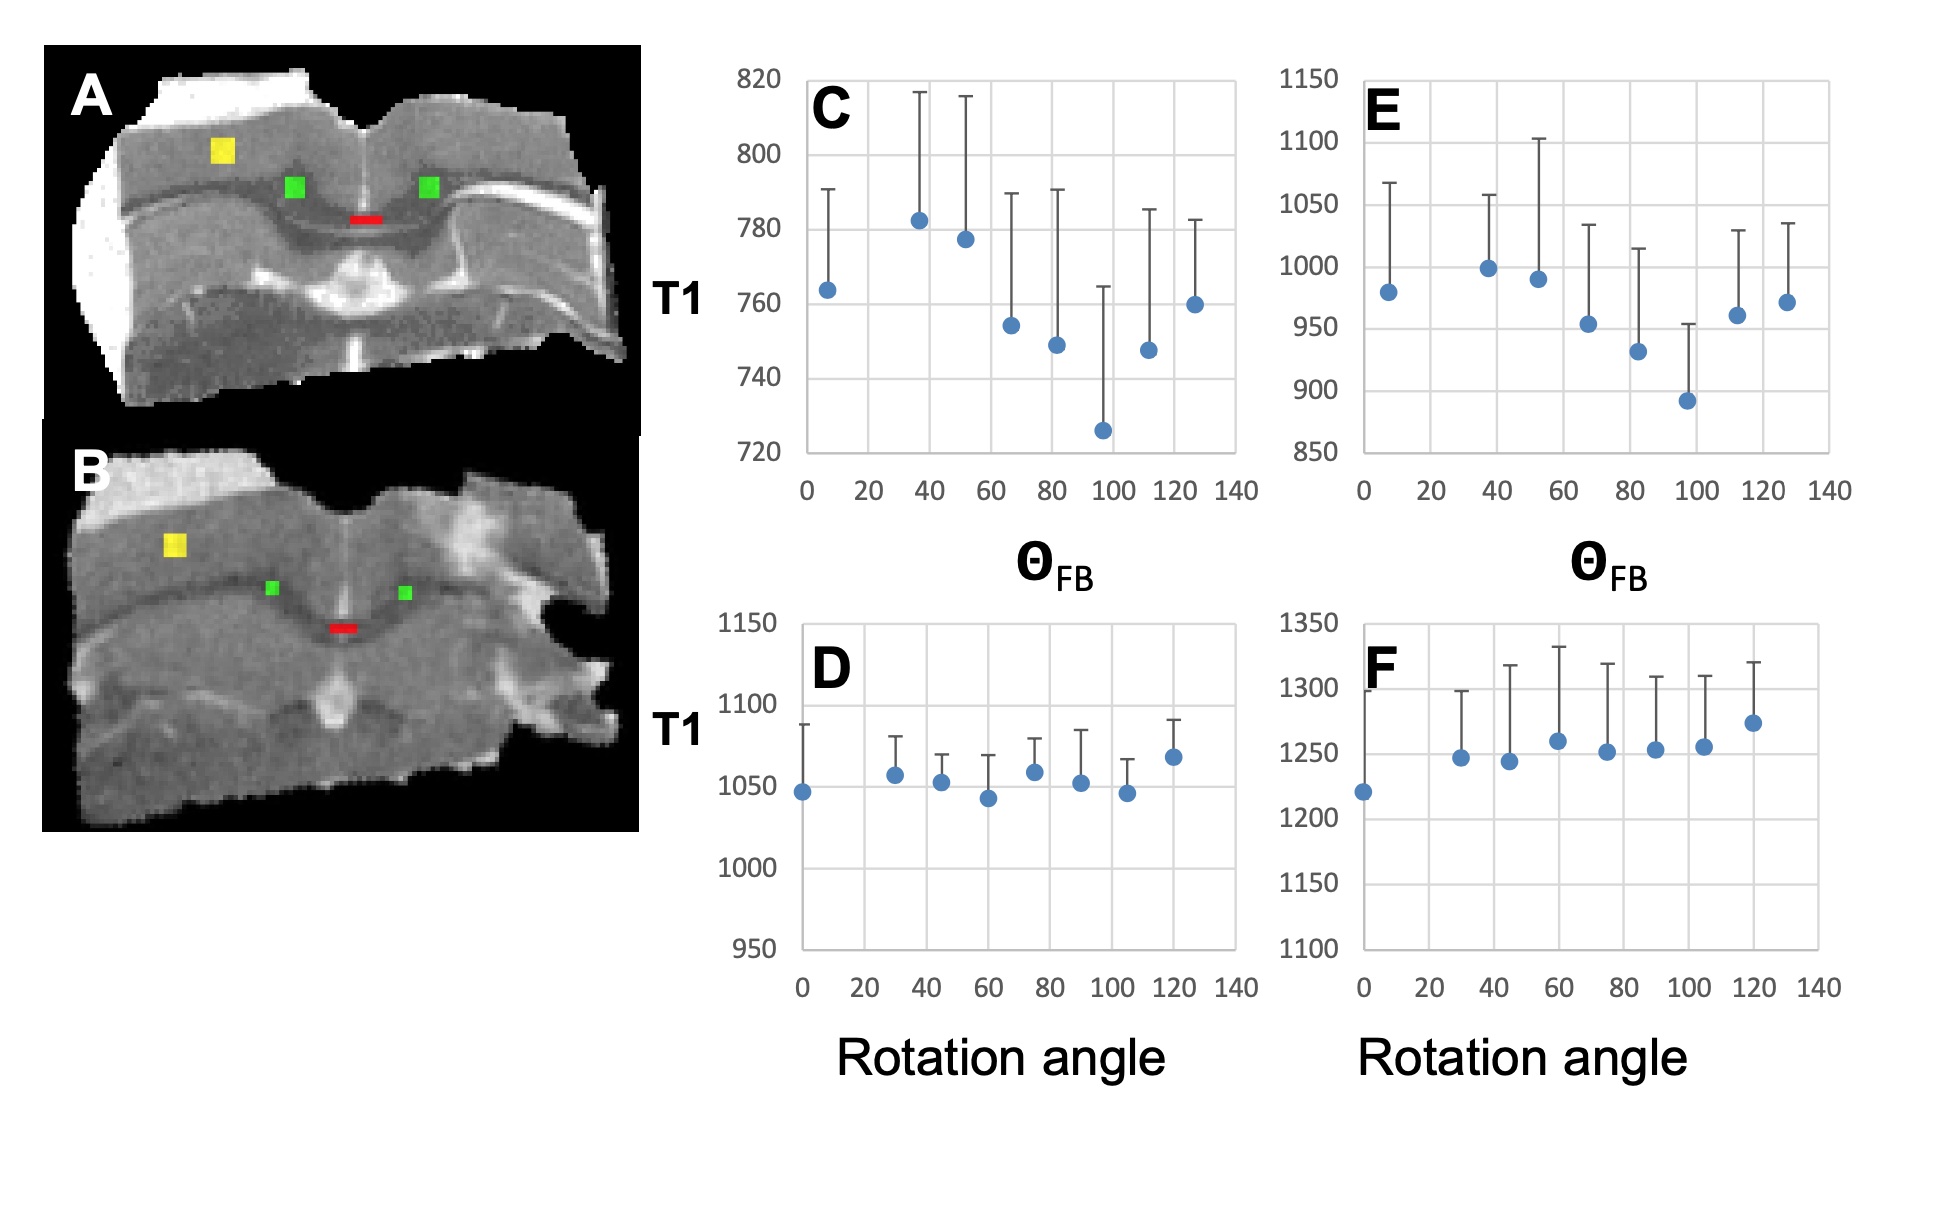
T1, qFB, S0 and FA values from the two sets of CC ROIs (Fig. 2A-F) show that T1 in ROIs 2-5 were longer than in ROI 1 at both B0 (Fig. 2 A and B). In the midsagittal ROIs 3, 4 and 5, T1 values were shorter than those in the respective large ROIs at both B0s and also in ROI 2 at 3T (Fig 2A and B). qFB in all midsagittal ROIs were greater than those in the respective large ROIs (Fig. 2C and D). Normalised S0 values are shown (Fig. 2E and F). The differing qFB between the ROIs allows to measure T1 at inherently varying fibre orientations in the CC tracts (Fig. 3C and D). We estimated the DT1 for each ROI from the global WM angular T1 plots and the measured DqFB. The measured and estimated DT1 data (Fig. 3A and B) show agreeing values for ROIs 1, 2 and 5 at 3T and ROIs 1 and 2 at 7T. Instead, the measured DT1 values in ROIs 3 and 4 at 3T and 3, 4 and 5 at 7T far exceeded the estimated ones. These data indicate that natural fibre orientation within a given CC tract is associated with T1 variation.A coronal T1 map of rat splenium (Fig. 4A) and a more anterior CC (Fig. 4B) are shown. T1 values in the red (CC) ROIs were 726.0±38.8 ms and 892.3±61.9ms for qFB of 83.2±3.1o and 82.4±3.8o, respectively. In the green (CC) ROIs, with qFB of 47.1±5.6o (Fig. 4A) and 46.4±6.0o (Fig. 4B), T1 values were 739.7±31.8ms and 934.2±57.0 ms, respectively. T1 as a function of seven rotations in B0 are shown for the red ROIs (Fig. 4C and E). T1 in both angular plots for CC were longer close to 0o than those close to 90o with the longest values for qFB around 40o. In yellow (GM) ROIs no evidence for variation of T1 in rotations was observed (Fig. 4D and F).Discussion and Conclusions
The human MRI data strongly argue that axon fibres microstructure per se influences T1 in a B0-orientation dependent manner. In the anterior mid-body where small diameter axons are prominent [12] the measured and estimated DT1 closely match. Instead, in motor and somato-motor sections the measured DT1 are much larger than the estimated ones. We believe that prominently present giant axons in these sections augment the orientation dependency of T1. The rotations of a rat ex vivo brain preparation reveal angular T1 plots in the same CC ROIs that match those observed in WM in vivo [4]. The current results both from in vivo and ex vivo CC demonstrate that WM microstructure directly causes T1 relaxation to have a dependence on axon fibre orientation.Acknowledgements
Supported by a RO3 EB027873 from NIBIBReferences
1. Harkins, K.D., et al., The microstructural correlates of T1 in white matter. Magn Reson Med, 2016. 75(3): p. 1341-5.
2. Knight, M.J., R.A. Damion, and R.A. Kauppinen, Observation of angular dependence of T1 in human white matter at 3T. Biomed Spectr Imag, 2018. 7: p. 125-133.
3. Schyboll, F., et al., The impact of fibre orientation on T1-relaxation and apparent tissue water content in white matter. MAGMA, 2018. 31: p. 501-510.
4. Kauppinen, R.A., et al., White matter microstructure and longitudinal relaxation time anisotropy in human brain at 3and 7 T. NMR Biomed, 2022. in press.
5. Lee, J., et al., T2*-based fiber orientation mapping. Neuroimage, 2011. 57(1): p. 225-234.
6. Andersson, J.L., S. Skare, and J. Ashburner, How to correct susceptibility distortions in spin-echo echo-planar images: application to diffusion tensor imaging. Neuroimage, 2003. 20(2): p. 870-88.
7. Andersson, J.L. and S.N. Sotiropoulos, An integrated approach to correction for off-resonance effects and subject movement in diffusion MR imaging. Neuroimage, 2016. 125: p. 1063-78.
8. Smith, S.M., et al., Tract-based spatial statistics: voxelwise analysis of multi-subject diffusion data. Neuroimage, 2006. 31(4): p. 1487-505.
9. Atlas, J.I. JHU ICBM labels 1mm. 2016; Available from: https://neurovault.org/images/1401/.
10. Chary, K., et al., Quantitative susceptibility mapping of the rat brain after traumatic brain injury. NMR Biomed, 2021. 34(2): p. e4438.
11. Hanninen, N., et al., Orientation anisotropy of quantitative MRI relaxation parameters in ordered tissue. Sci Rep, 2017. 7(1): p. 9606.
12. Aboitiz, F., et al., Fiber composition of the human corpus callosum. Brain Res, 1992. 598(1-2): p. 143-53.
Figures