4493
The Value of Neurite Orientation Dispersion and Density MR Imaging in Diagnosing Temporal Lobe Epilepsy with Hippocampal Sclerosis
Xiaonan Zhang1, Guohua Zhao1, Huiting Zhang2, Eryuan Gao3, and Jingliang Cheng1
1The First Affiliated Hospital of Zhengzhou University, Zhengzhou, China, 2MR Scientific Marketing, Siemens Healthineers Ltd., Wuhan, China, 3The First Affiliated Hospital of Zhengzhou University,, Zhengzhou, China
1The First Affiliated Hospital of Zhengzhou University, Zhengzhou, China, 2MR Scientific Marketing, Siemens Healthineers Ltd., Wuhan, China, 3The First Affiliated Hospital of Zhengzhou University,, Zhengzhou, China
Synopsis
Keywords: Quantitative Imaging, Brain
The hippocampal microstructural alterations by using routine magnetic resonance imaging presents a challenge. This study aimed to evaluate the performance of the NODDI models in temporal lobe epilepsy (TLE) patients with hippocampal sclerosis (HS) by comparison with the routine Flair sequence. Our results found that all NODDI parameters had significant differences between ipsilateral HS and contralateral HS/HC, and had better diagnostic performance than Flair sequence. In addition, combined NODDI model had significant better diagnostic performance than all the single parameters. In conclusion, NODDI is superior to Flair image in diagnosing TLE with HS.Introduction or Purpose
Temporal lobe epilepsy(TLE)is one of the most common drug refractory epilepsies[1], and hippocampal sclerosis(HS)is the most common pathological type of TLE, characterized pathologically by reduced hippocampal volume, neuronal cell loss, and gliosis[2,3]. TLE Patients with HS(TLE-HS) can be cured by surgical removal of the epileptogenic focus with a cure rate of more than 70% [4]. Therefore, the identification of possible hippocampal alterations is crucial for the diagnosis and therapy of patients with unilateral TLE. Hippocampal atrophy can be observed on conventional MRI, but early hippocampal microstructural changes may be missed. Thus, a noninvasive in vivo investigation of these hippocampal microstructural alterations would be extremely useful. Recently, a diffusion model, neurite orientation dispersion and density imaging (NODDI), is able to detect the microstructural complexity of brain tissue, and was applied to more brain diseases [5,6]. This study aimed to investigate the diagnostic performance of NODDI in hippocampal sclerosis in TLE.Methods
Fifty-nine unilateral TLE-HS and 64 healthy controls (HC) were retrospectively enrolled. The diagnosis of TLE-HS based on a comprehensive evaluation, including detailed clinical history, seizure semiology, neurological examination, scalp video-EEG recordings, and MRI assessment. All patients met the following inclusion criteria: 1) unilateral temporal lobe seizure onset through scalp or intracranial video EEG recordings; 2) MRI evidence of pathology located within the epileptogenic mesial temporal lobe, with hippocampal sclerosis ; 3) concordant PET finding of hypometabolism in the interictal temporal lobe. All controls were free of neurological or psychiatric illnesses, and had no structural abnormalities on MRI images. For all participants, MR images were acquired on a 3T MR scanner (MAGNETOM Prisma, Siemens Healthcare, Erlangen, Germany). DWI data were acquired using a single-shot spin echo EPI sequence (b-values of 0, 1000, 2000 s/mm2, 30 diffusion sampling directions for each non-zero b value, TR = 3800ms, TE = 72ms, 60 axial slices with 2.2 mm thickness and 2 mm gap, matrix size = 110 × 110, field of view = 220 × 220 mm2, voxel size = 2.0 × 2.0 × 2.2 mm3, and scan time, 3min:32s. Eddy current and motion correction were conducted on DWI images using the Diffusion Kit Eddy tool (http://diffusionkit.readthLedocs.io). Then the NODDI parameter fitting was performed using an open source Amico tool (https://github.com/daducci/AMICO/), and the parametric maps of Isotropic volume fraction (ISOVF), intracellular volume fraction (ICVF), and orientation dispersion index (ODI) were obtained. Both MR Fluid Attenuated Inversion Recovery (Flair) images and T1 MPRAGE images from each subject were co-registered to diffusion weighted images using the ITK-SNAP (http://www.itksnap.org) software, and bilateral hippocampal segmentations were saved as the segmented regions of interest (ROIs) by consensus two neuroradiologists. Then, the mean values of parameters of NODDI and signal intensity of Flair image for hippocampal segmentations. One-way analysis of variance (ANOVA) or Kruskal-Wallis ANOVA were used to detect differences in parameters among ipsilateral, contralateral and HC groups. Then two sample t test with LSD post-hoc multiple correction method or Mann⁃Whitney U test was used for pairwise comparison between any two groups. And the differential diagnostic efficiency of each parameter was determined by ROC analysis.Results
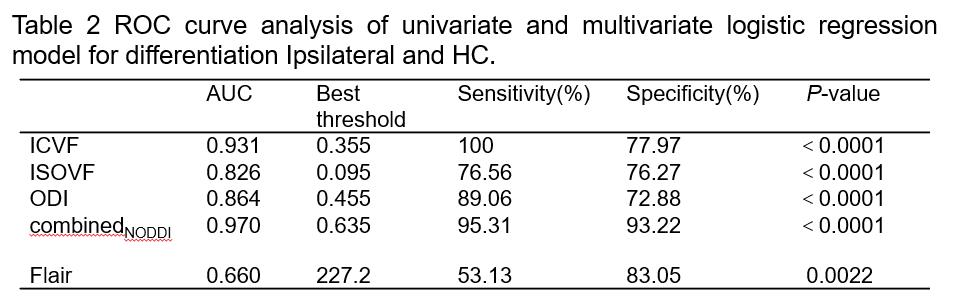
Compared with the contralateral and HC, the ipsilateral had significantly lower ICVF and ODI and significantly higher ISOVF (all P<0.05). Compared with the HC, the ISOVF was higher in the contralateral (P<0.05). For Flair signal intensities, the difference was significant between ipsilateral and HC (P<0.05). The detailed results are shown in Table 1. Between the ipsilateral and HC, Flair had moderate (area under curves, AUC=0.660) and parameters from NODDI model had high diagnostic performances (AUCs = 0.824 ~ 0.931), and logistic regression model combined ISOVF, ICVF, ODI (combinedNODDI model) had the best performance (AUC=0.970), as shown in Table 2 and Figure 2(a). Between the ipsilateral and contralateral, ISOVF, ICVF and ODI all had high diagnostic performances, with AUCs ranging from 0.723 to 0.908, and the AUC of the best combinedNODDI model was 0.962, as shown in Table 3 and Figure 2(b). Between the contralateral and HC, ISOVF had moderate diagnostic performances (AUC= 0.653), as shown in Figure 2(c). Based on the Delong test, the combinedNODDI model achieved a significantly higher diagnostic performance in differentiating ipsilateral from contralateral hippocampus and HC compared with all other single parameters (all p<0.05).Discussion
Previous studies have shown that diffusion MRI techniques have become a promising tool for the comprehension of the microstructural alterations in patients affected by epilepsy [7]. Our study focused on MRI-segmented hippocampi of a group of patients affected by TLE-HS. In sclerotic hippocampus, neuronal loss and mossy fiber sprouting. In the NODDI model, ODI highlights fiber reorganization, and ICVF represents neuron density and it can be linked to neurite loss. Our results showed a significant ICVF and ODI reduction in the ipsilateral hippocampus to the epileptogenic focus, which confirmed this theory. The ISOVF represents isotropic diffusion within the tissue, and our findings that the ISOVF were signification increased in the ipsilateral and contralateral hippocampus with HS compared with HC. These results might suggest the possible increase of the extracellular space, that affected not only the ipsilateral but also the contralateral hippocampus.Conclusion
NODDI method may be superior to conventional flair image in diagnosing hippocampal sclerosis in patients with temporal lobe epilepsy.Acknowledgements
No acknowledgement found.References
1. Caldairou B, Foit NA, Mutti C, et al. MRI-Based Machine Learning Prediction Framework to Lateralize Hippocampal Sclerosis in Patients With Temporal Lobe Epilepsy[J]. Neurology, 2021, 97(16):e1583-e1593. 2. Granados Sánchez AM, Orejuela Zapata JF. Diagnosis of mesial temporal sclerosis: sensitivity, specificity and predictive values of the quantitative analysis of magnetic resonance imaging[J]. Neuroradiol J, 2018, 31(1):50-59. 3. Malmgren K, Thom M. Hippocampal sclerosis--origins and imaging[J]. Epilepsia, 2012, 53 Suppl 4:19-33. 4. Silva G, Martins C, Moreira da Silva N, et al. Automated volumetry of hippocampus is useful to confirm unilateral mesial temporal sclerosis in patients with radiologically positive findings[J]. Neuroradiol J, 2017, 30(4):318-323. 5. Giachetti I, Padelli F, Aquino D, et al. Role of NODDI in the MRI Characterization of Hippocampal Abnormalities in Temporal Lobe Epilepsy: Clinico-histopathologic Correlations. Neurology. 2022. 98(17): e1771-e1782. 6. Wang P, Gao E, Qi J, et al. Quantitative analysis of mean apparent propagator-magnetic resonance imaging for distinguishing glioblastoma from solitary brain metastasis. Eur J Radiol. 2022. 154: 110430. 7. Lorio S, Adler S, Gunny R, et al. MRI profiling of focal cortical dysplasia using multi-compartment diffusion models. Epilepsia. 2020. 61(3): 433-444.Figures
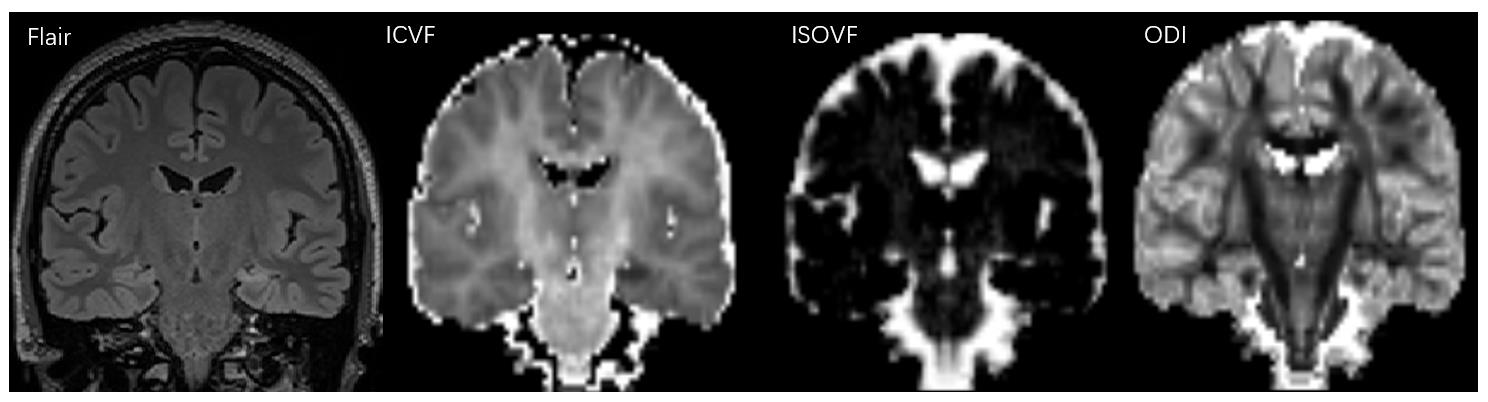
Fig.
1. Images from a 29-year-old woman with left hippocampal sclerosis.
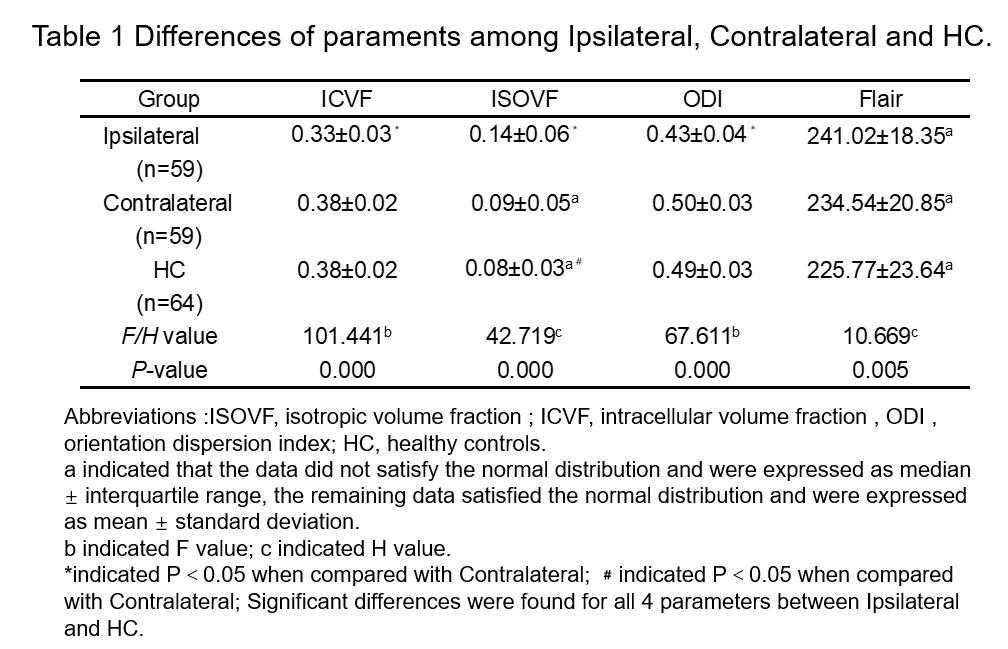
Table 1
Abbreviations :ISOVF, isotropic
volume fraction ; ICVF, intracellular volume fraction ; ODI , orientation
dispersion index; AUC, area under curve.

Abbreviations :ISOVF, isotropic
volume fraction ; ICVF, intracellular volume fraction ; ODI , orientation
dispersion index; AUC, area under curve.
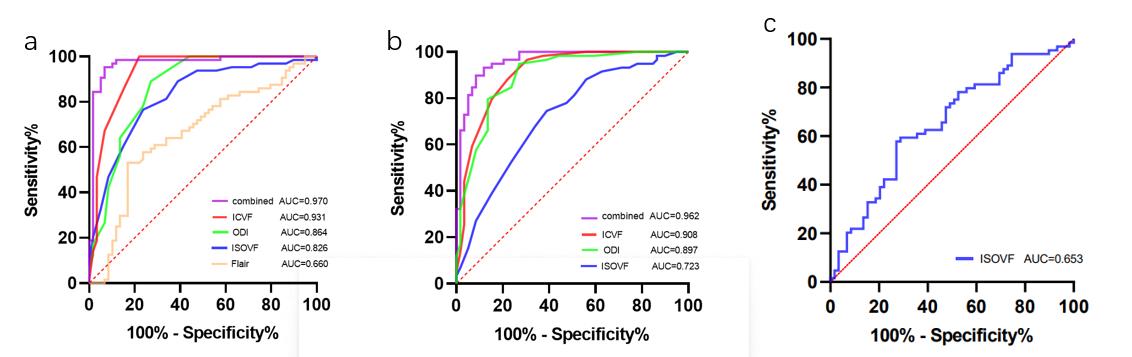
Fig. 2. ROC curves of the ICVF, ODI,
ISOVF, Flair and combined NODDI models for distinguishing Ipsilateral
and HC(a).
ROC curves of the ICVF, ODI, ISOVF, and combined NODDI models for
distinguishing Ipsilateral
and Contralateral(b). ROC curves of the ISOVF for
distinguishing Contralateral and HC(c). ISOVF = isotropic volume fraction; ICVF
= intracellular volume fraction; ODI = orientation dispersion index.
DOI: https://doi.org/10.58530/2023/4493