4490
Evaluating frequency offsets due to local dephasing in magnetically inhomogeneous tissue1Physics, University of Nottingham, Nottingham, United Kingdom
Synopsis
Keywords: Simulations, Microstructure
Through simulation the frequency offsets due to signal dephasing around biologically relevant local regions of high magnetic susceptibility are explored. Monte Carlo simulations are used to characterise the frequency offsets produced by spherical inclusions of varying radius and susceptibility in the presence of diffusion. The results indicate that heterogeneity of non-haeme iron concentration produce $$$\delta\Omega R^{2}/D$$$ values associated with local frequency offsets of up to $$$ -0.053 \gamma B_{0}\chi_{av}$$$: such offsets would be a confound for QSM measurements that merits further investigation.Introduction
Quantitative susceptibility mapping (QSM)1 characterises the macroscopic magnetic susceptibility variation, by assuming that frequency offsets measured from gradient echo images, can be related to the spatial variation of the voxel-scale average susceptibility, $$$\chi_{av}$$$. However, the heterogeneous susceptibility distribution in tissue at the microscopic level can produce local frequency offsets that are poorly characterised by the dipolar field kernel (including the Lorentz sphere correction) that is convolved with the $$$\chi_{av}$$$ distribution in relating frequency variation to susceptibility. These effects, introduce confounds for QSM2 leading to increased interest in methods that aim to separate macroscopic dipolar field effects from the effects of microstructure and other sources of local frequency offsets3.In this work we consider frequency offsets due to signal dephasing around local regions of high magnetic susceptibility –e.g. ferritin particles, iron-rich cells or cell clusters. By modelling magnetically inhomogeneous tissue as a random distribution of spheres of radius R, susceptibility $$$\chi$$$ and volume fraction VF, Yablonskiy and Haacke4 showed that static dephasing produces a frequency offset of $$$\Omega = -0.053 \delta\Omega$$$ VF rad/s (where $$$\delta\Omega = \gamma B_{0}\chi$$$) when $$$\delta\Omega t >> 3$$$ (where t is evolution-time). This offset, which is ~16% of the Lorentz sphere correction ($$$\delta\Omega VF/3$$$) could have a significant effect on the measured susceptibility values in QSM. However, dynamic averaging due to diffusion reduces the magnitude of such local frequency offsets5 such that they might not be relevant in tissue. Here, using Monte Carlo simulations we characterise the frequency offsets produced by spherical inclusions of varying radius and susceptibility in the presence of diffusion and consider whether the distribution of non-haeme iron in tissue could produce significant offsets.
Method
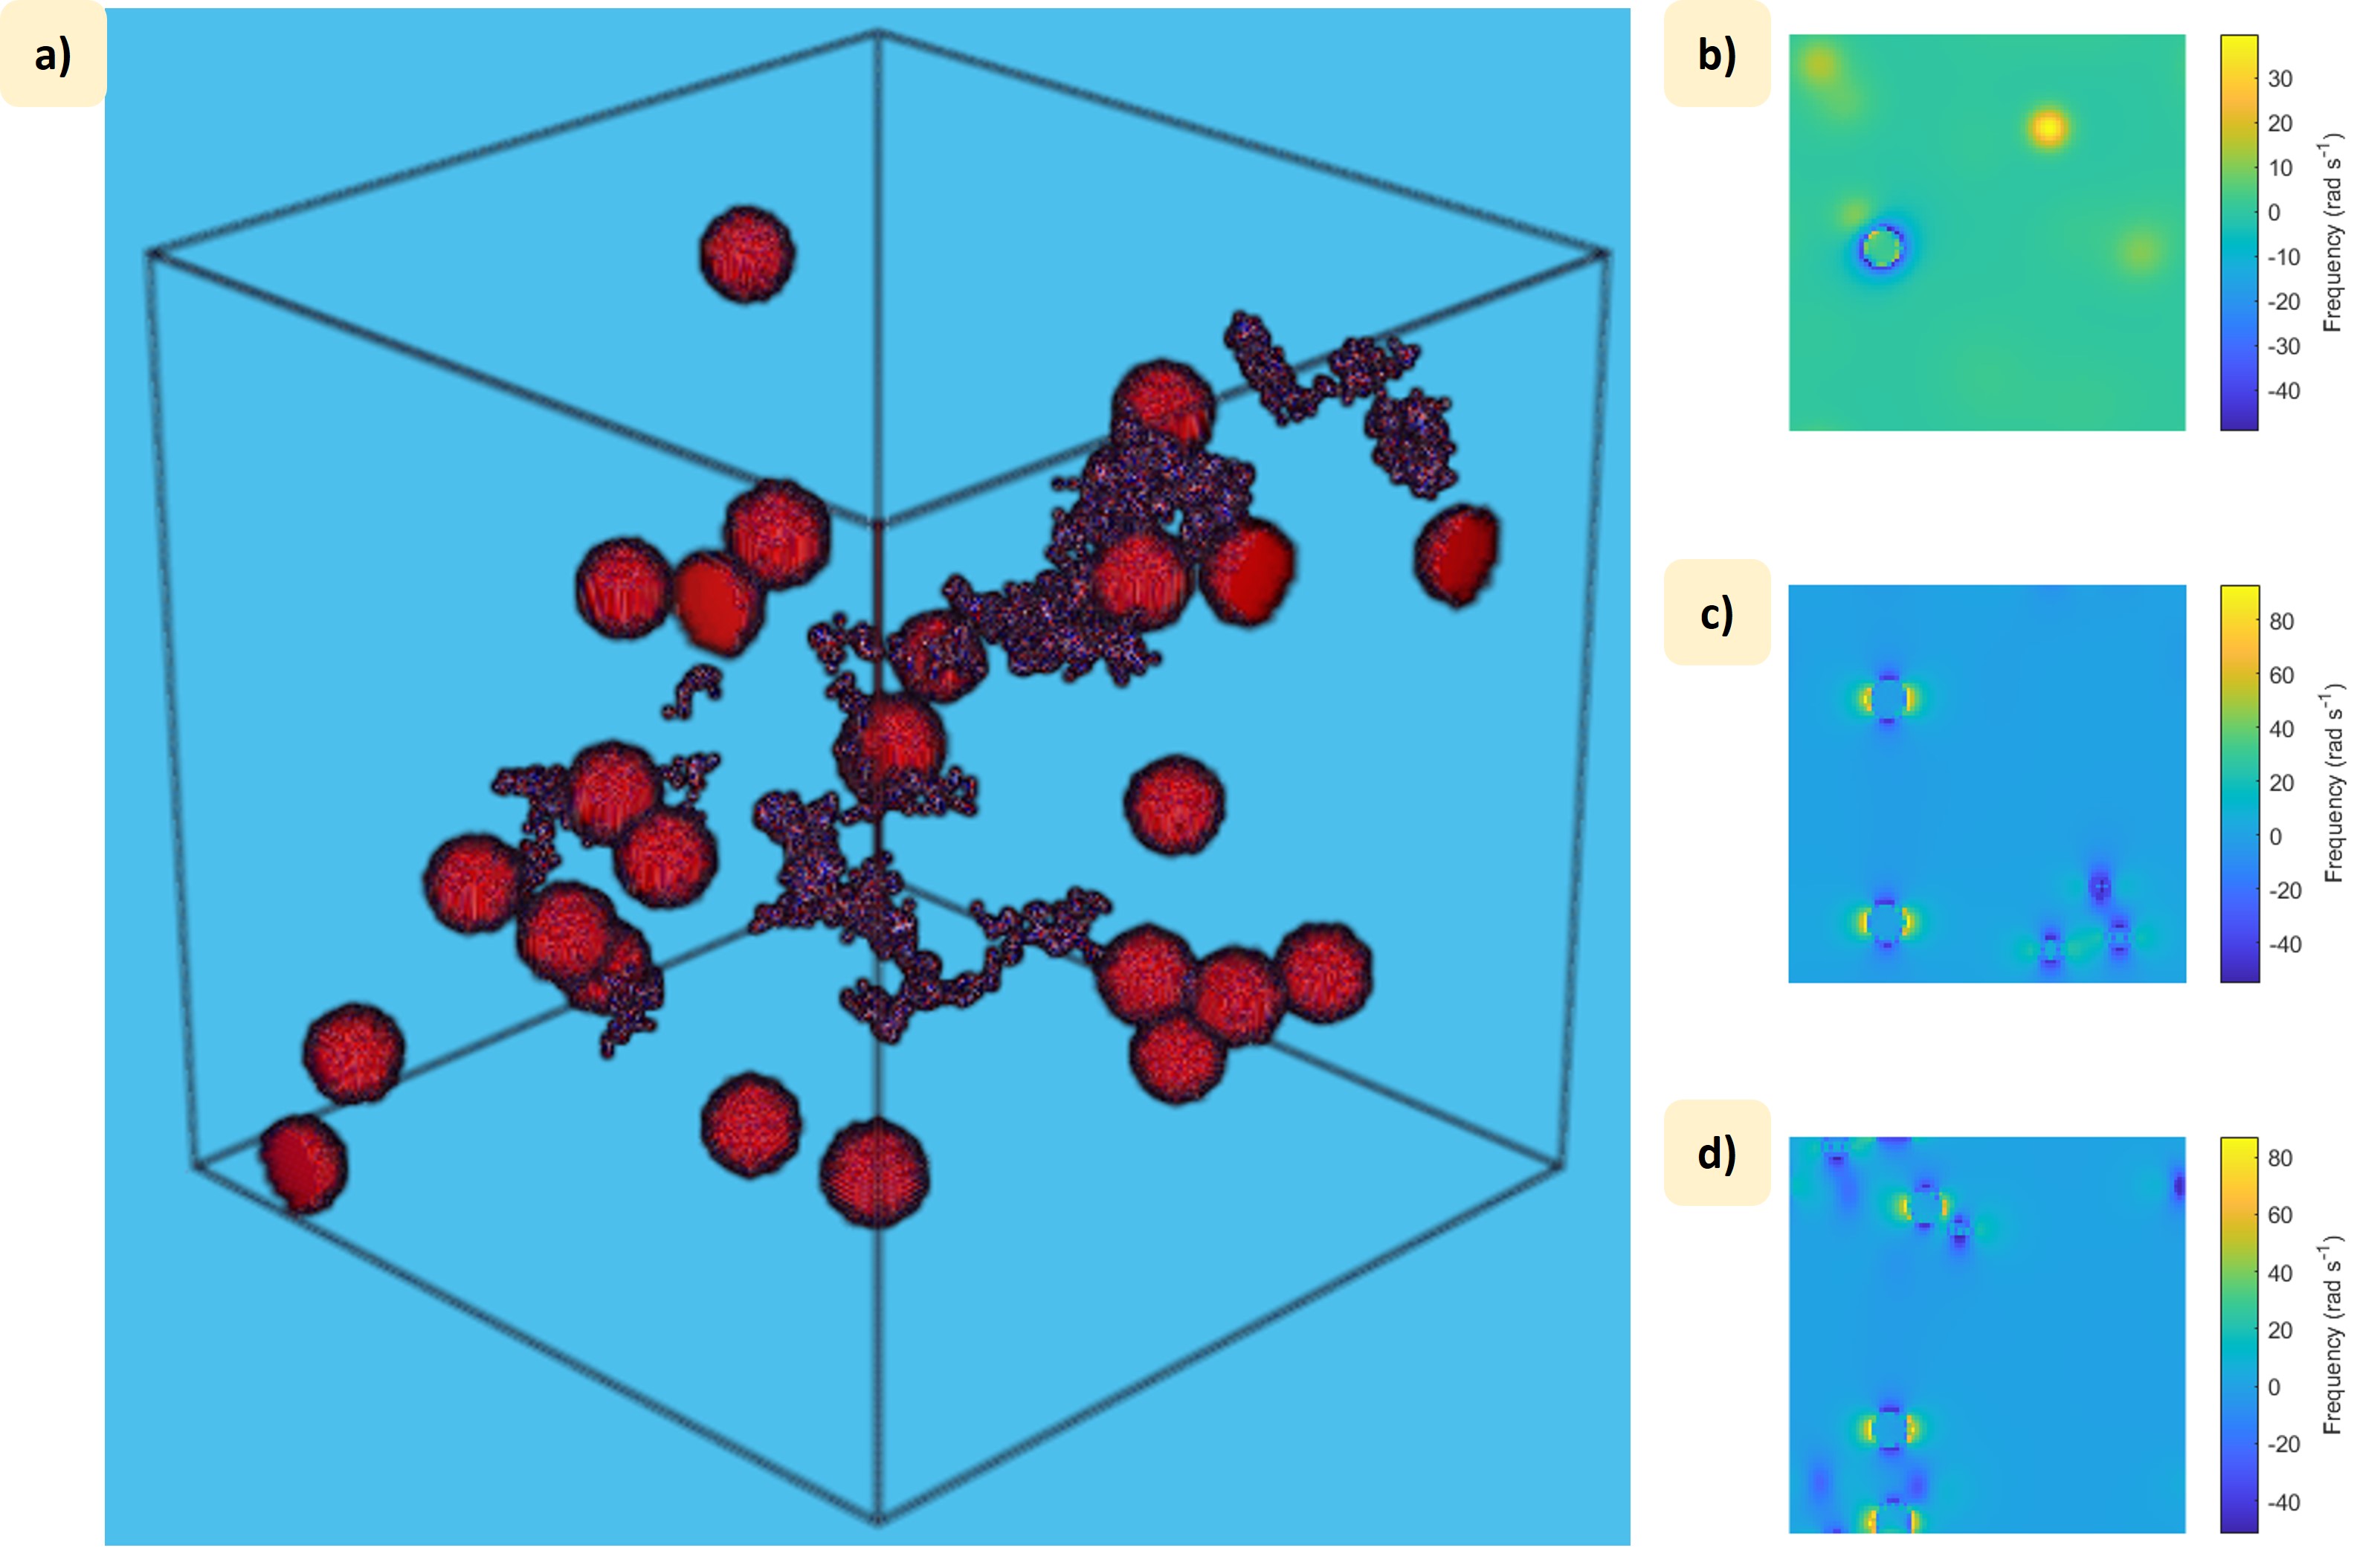
Field perturbations produced by random distributions of spheres (VF = 2.5%) in a 5003 voxelated-space were calculated using a Fourier approach6 assuming B0=7T. The signal evolution over a 0.3 s period was simulated by summing the contributions from multiple randomly seeded water molecules which underwent random walks. By using different random-walk time-steps we could efficiently simulate the effect of diffusion (D =10-9 m2s-1) for a range of sphere radii (30 values between 1 and 100 µm) and susceptibilities (11 values between 0.05 and 0.5 ppm). Signal evolution in the absence of diffusion was also simulated, and we considered both hard spheres (water molecules were excluded from the spheres and reflected at their surfaces) and soft spheres (water molecules could be seeded in, and diffuse through, the spheres). Each signal was formed by summing the contributions from 105 water molecules for 20 random distributions of spheres (Fig. 1). The instantaneous R2* and $$$\Omega$$$ values were found from the temporal derivatives of the signal phase and log(signal magnitude), with subsequent processing undertaken to evaluate their dependences on D, R and $$$\delta\Omega$$$.Results
Figure 2 shows the variation of the signal magnitude and phase with time for a subset of $$$\chi$$$-values for the smallest and largest susceptibilities for diffusing and static water molecules (hard spheres). The corresponding values of $$$R_{2}^{*}/ VF \delta\Omega$$$ and $$$\Omega / VF\delta\Omega$$$ are also shown. The variation of the average values of these terms in the time range 0.2-0.3 s is plotted against $$$\delta\Omega R^{2}/D$$$ in Fig. 3 with each line showing the effect of varying R for a different value of $$$\chi$$$. The signal behaviour for soft spheres (Fig. 4) is very similar.Discussion
The plots in Figs. 2 and 4 show frequency offsets and R2* values that plateau after a time of order $$$\delta\Omega ^{-1}$$$, and are then proportional to VF and $$$\delta\Omega$$$, and independent of R in the static regime, as expected4. Diffusion reduces the magnitude of $$$\omega$$$ and R2*, with smaller radii producing a greater reduction due to the faster dynamic averaging. Figure 3 indicates that the effect of dynamic averaging due to diffusion at low VF is characterised by $$$\delta\Omega R^{2}/D$$$ for a range of $$$R$$$ and $$$\chi$$$ values: for $$$\delta\Omega R^{2}/D > 100 $$$ the static dephasing values apply, while for $$$\delta\Omega R^{2}/D <5$$$, the frequency offset is less than 10% of the maximum value: between these values $$$\Omega/ VF\delta\Omega \approx - 1.6 x10^{-3}\delta\Omega R^{2}/D$$$, as shown by the additional dashed line in Fig. 3b4.To consider whether frequency offsets due to dephasing could be generated in brain tissue by heterogeneity of the non-haeme iron distribution, we evaluated the range of possible values of $$$\delta\Omega R^{2}/D$$$ for a volume average susceptibility of 0.1 ppm7 due to non-haeme iron. We consider $$$\chi$$$-values ranging from 500 ppm (susceptibility of ferritin8) to 0.5 ppm and R-values ranging from 0.01µm (~ size of ferritin) to 100µm (largest sub-voxel scale), and the average separation of the spheres $$$R_{sep} = \left(\frac{4\pi\chi}{3\chi_{av}}\right)^{\frac{1}{3}}$$$ is also assumed to be limited to be values <100µm, since we are considering sub-voxel length scales. Figure 5a shows the variation of $$$\delta\Omega R^{2}/D$$$ over the range of $$$\chi$$$-, R- and -$$$R_{sep}$$$ values, with Figure 5b highlighting the parameter ranges for which $$$\delta\Omega R^{2}/D$$$ is > 5 or >100. This indicates that heterogeneity of non-haeme iron concentration at biologically relevant length scales produce $$$\delta\Omega R^{2}/D$$$ values associated with local frequency offsets of up to -0.053 $$$\gamma B_{0}\chi$$$: such offsets would be a confound for QSM measurements that merits further investigation.
Acknowledgements
I would like to acknowledge the MRC for funding my PhD programmeReferences
1. Wang, Y. and T. Liu, Quantitative Susceptibility Mapping (QSM): Decoding MRI Data for a Tissue Magnetic Biomarker. Magnetic Resonance in Medicine, 2015. 73(1): p. 82-101.
2. Wharton, S. and R. Bowtell, Effects of White Matter Microstructure on Phase and Susceptibility Maps. Magnetic Resonance in Medicine, 2015. 73(3): p. 1258-1269.
3. Schweser, F. and R. Zivadinov, Quantitative susceptibility mapping (QSM) with an extended physical model for MRI frequency contrast in the brain: a proof-of-concept of quantitative susceptibility and residual (QUASAR) mapping. Nmr in Biomedicine, 2018. 31(12).
4. Yablonskiy, D.A. and E.M. Haacke, THEORY OF NMR SIGNAL BEHAVIOR IN MAGNETICALLY INHOMOGENEOUS TISSUES - THE STATIC DEPHASING REGIME. Magnetic Resonance in Medicine, 1994. 32(6): p. 749-763.
5. Ruh, A., H. Scherer, and V.G. Kiselev, The larmor frequency shift in magnetically heterogeneous media depends on their mesoscopic structure. Magnetic Resonance in Medicine, 2018. 79(2): p. 1101-1110.
6. Marques, J.P. and R. Bowtell, Application of a fourier-based method for rapid calculation of field inhomogeneity due to spatial variation of magnetic susceptibility. Concepts in Magnetic Resonance Part B-Magnetic Resonance Engineering, 2005. 25B(1): p. 65-78.
7. Langkammer, C., F. Schweser, N. Krebs, A. Deistung, W. Goessler, E. Scheurer, K. Sommer, G. Reishofer, K. Yen, F. Fazekas, S. Ropele, and J.R. Reichenbach, Quantitative susceptibility mapping (QSM) as a means to measure brain iron? A post mortem validation study. Neuroimage, 2012. 62(3): p. 1593-1599.
8. Duyn, J.H. and J. Schenck, Contributions to magnetic susceptibility of brain tissue. Nmr in Biomedicine, 2017. 30(4).
Figures
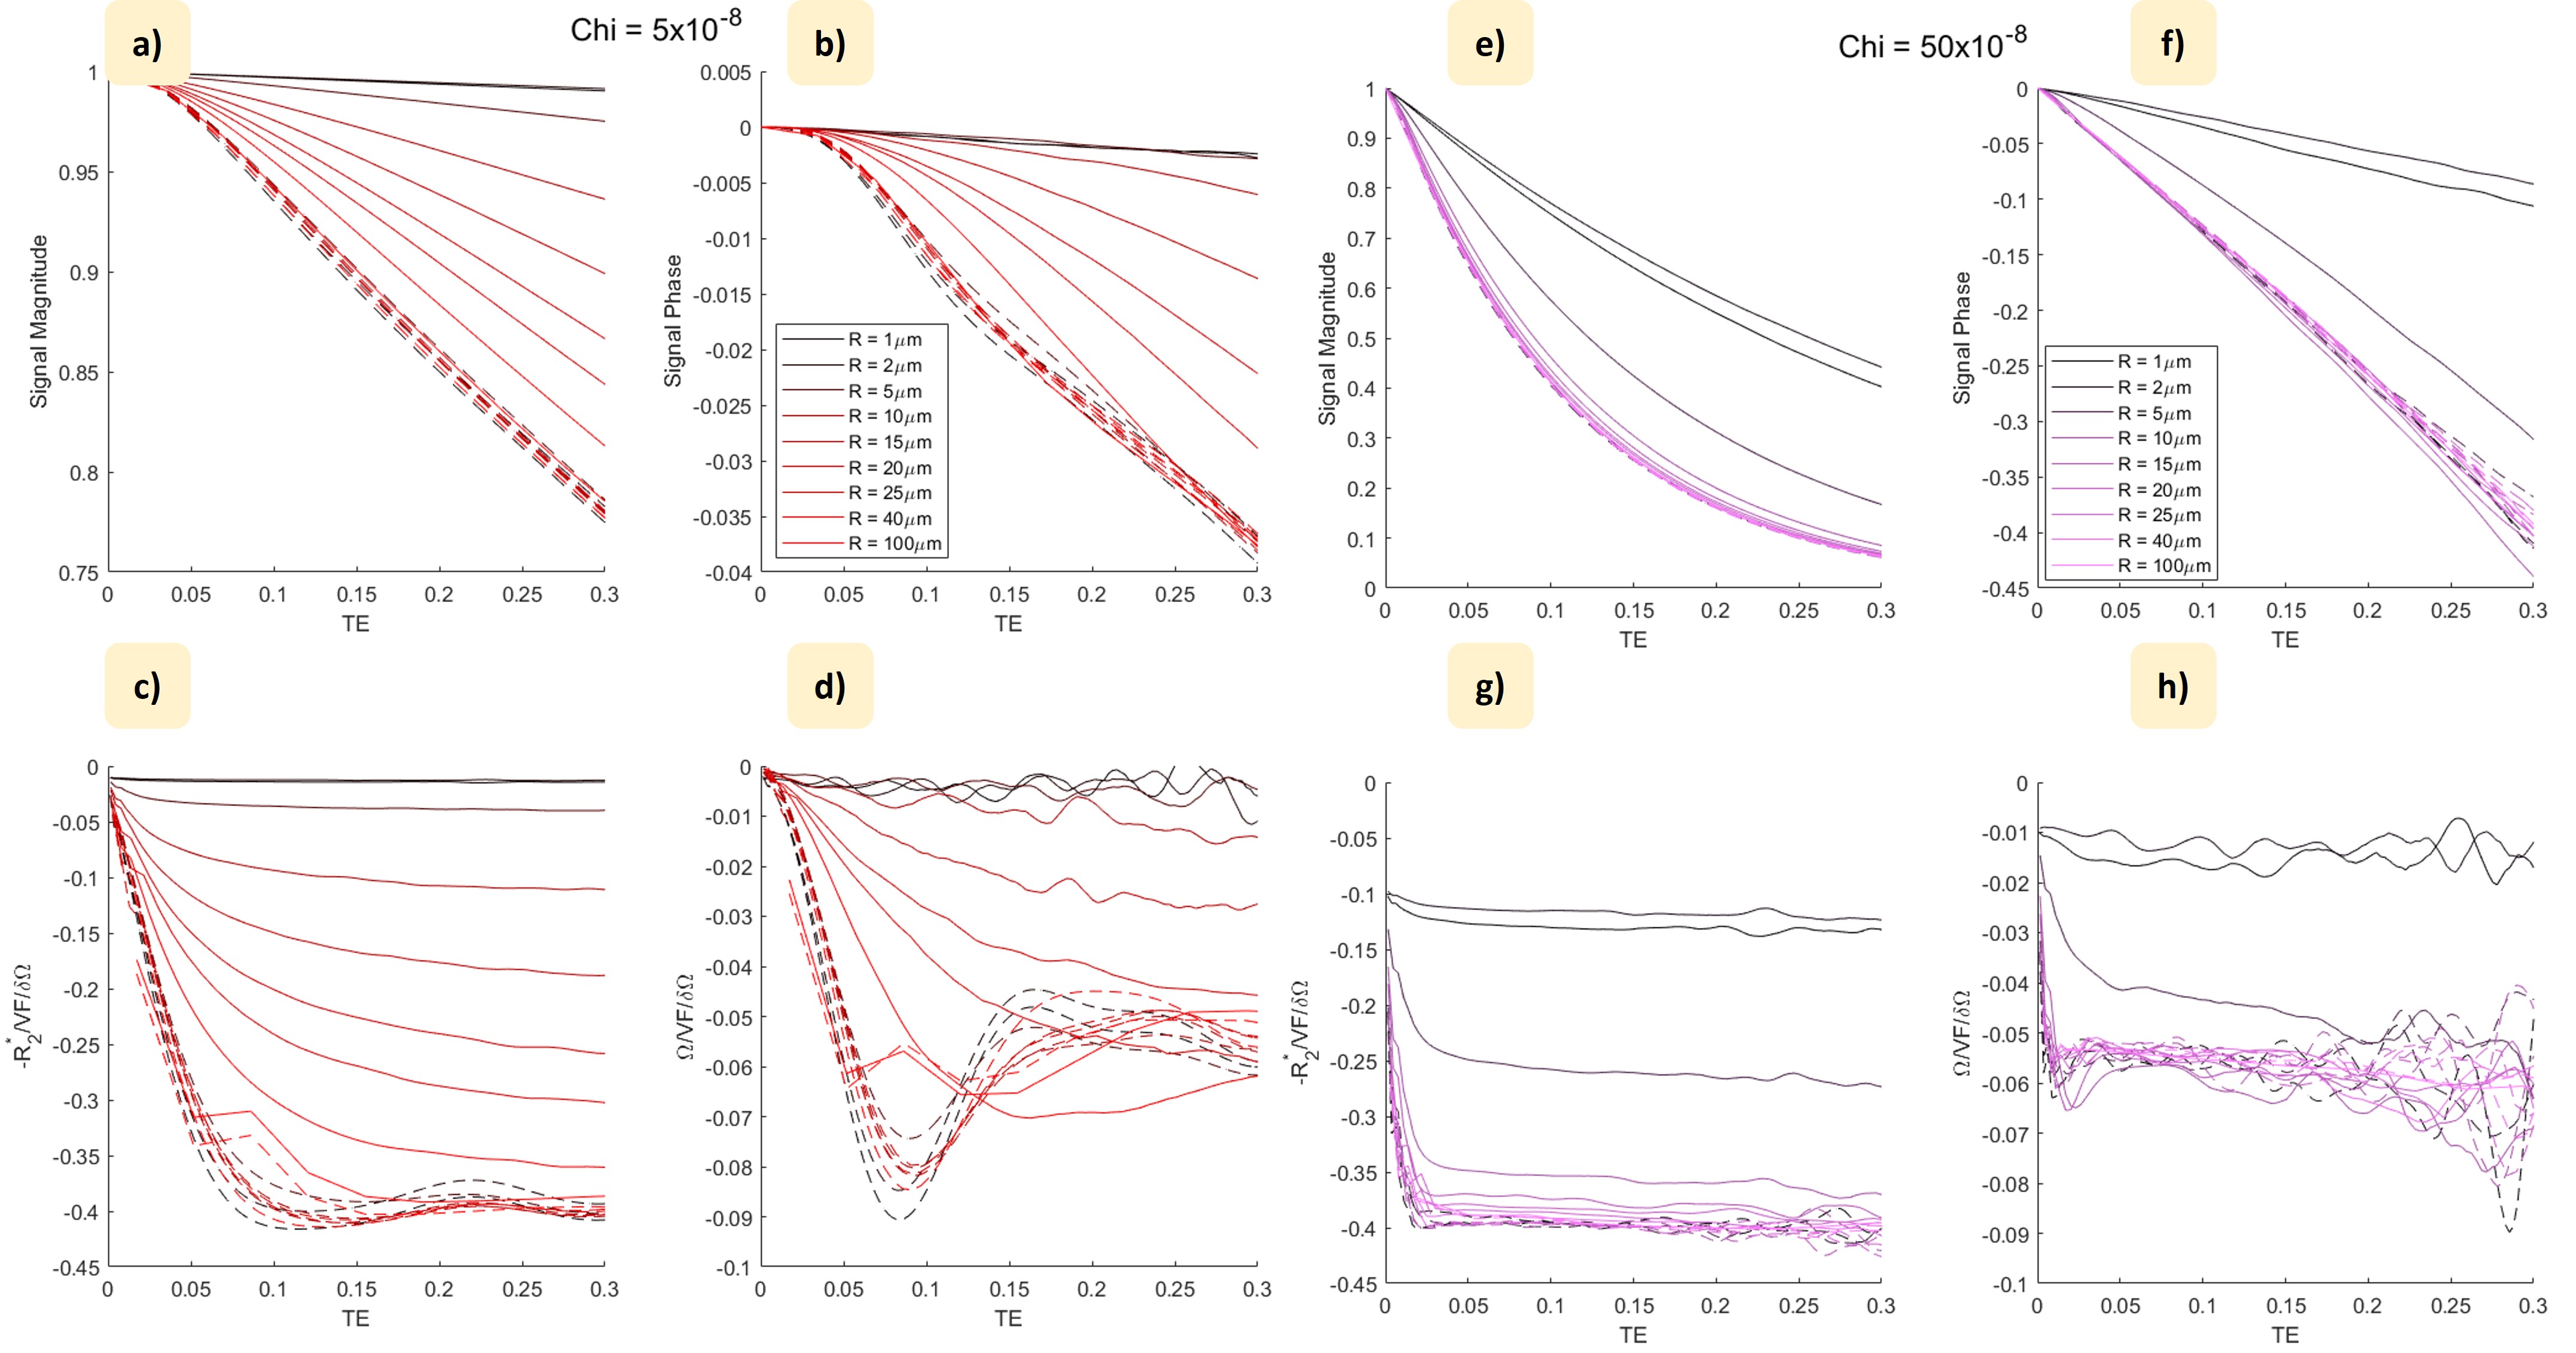
Plots of the temporal variation of the signal magnitude (a & e) and phase (b & c) for ‘hard’ spheres of different radii (VF = 2.5%; B0=7T) for c-values of 0.05 and 0.5 ppm. Continuous/dashed lines show signal evolution with and without diffusion (D =10-9 m2s-1). Values of R2*/ VF dW (c & g) and W/ VF dW (d &h) derived from the temporal derivatives of the log(signal magnitude) and phase are also shown. In the absence of diffusion values agree with theoretical predictions4,with diffusion reducing the values to a greater extent for smaller spheres due to more rapid dynamic averaging.
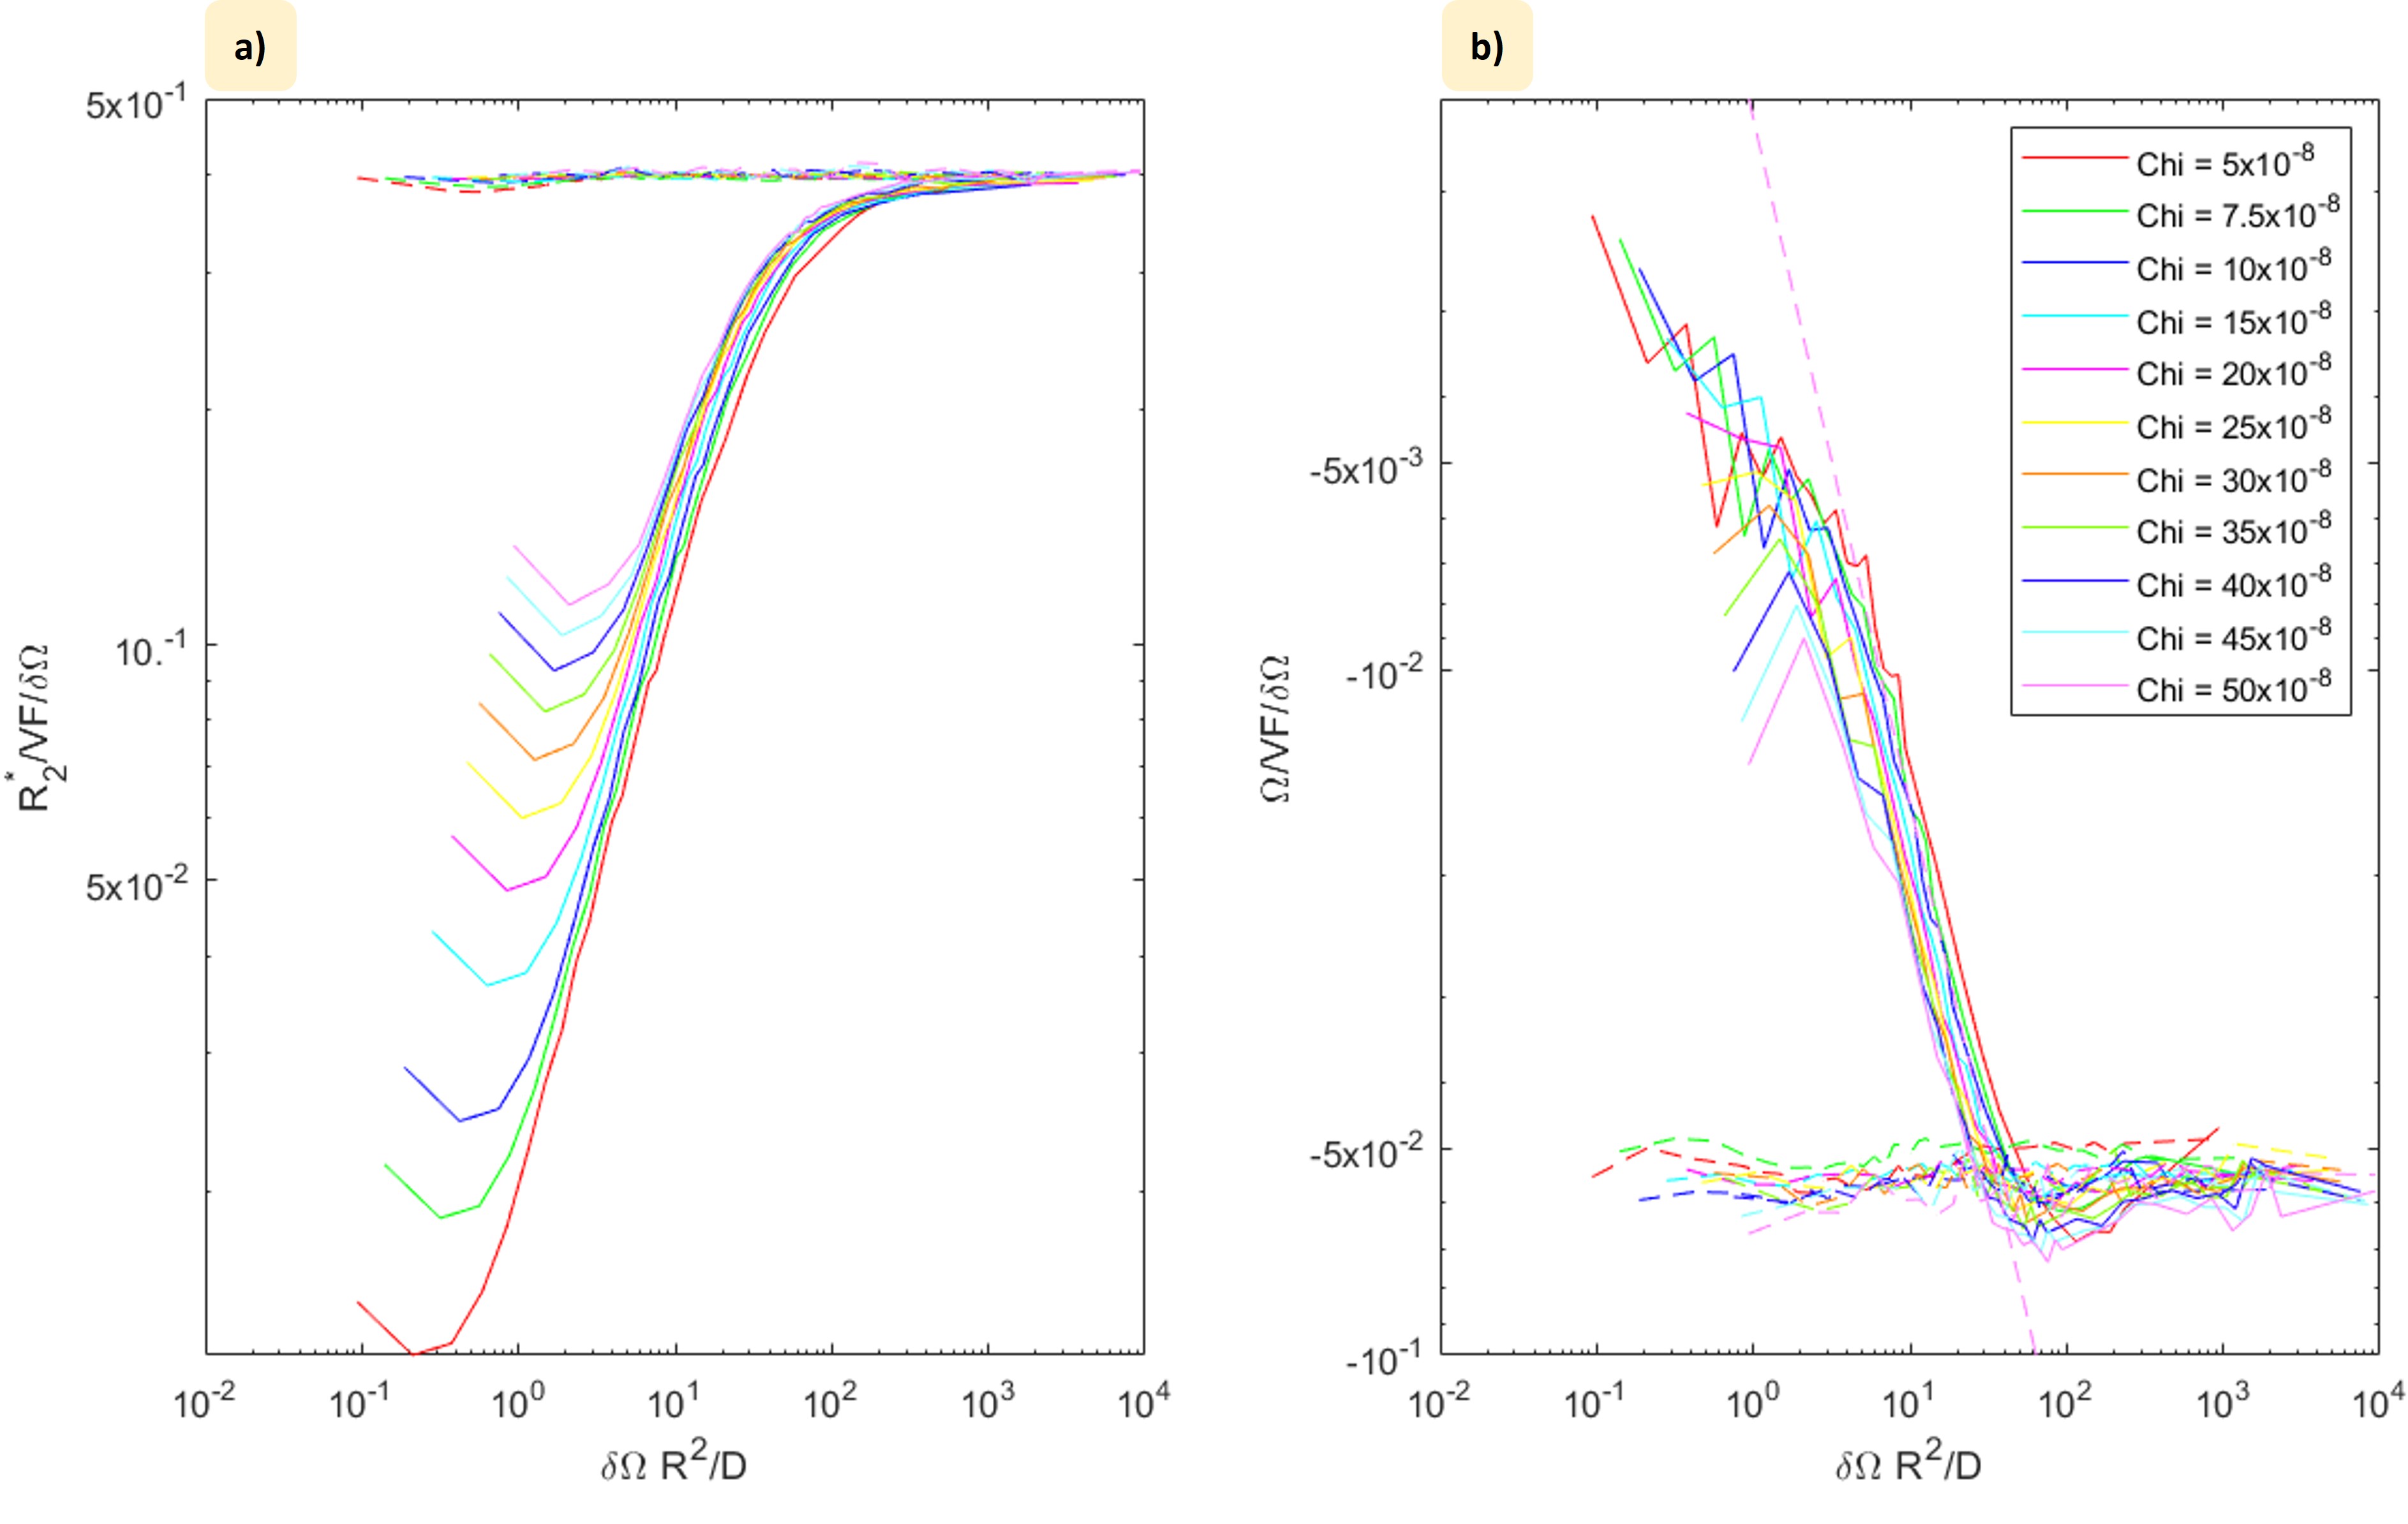
Average R2*/ VF dW (a) and W/ VF dW (b) values over the 0.2-0.3 s range found for different sphere radii and susceptibility values plotted against dWR2/D. Each line corresponds to variation of R for a different value of c. Continuous/dashed lines show values obtained with/without diffusion (D =10-9 m2s-1). The additional dashed line in (b) shows that W/ VF dW ~ - 1.6 x10⁻³ dWR2/D in the range 5 < dWR2/D < 100 when the effect of diffusion is considered and tends to the static dephasing limit for dWR2/D > 100.
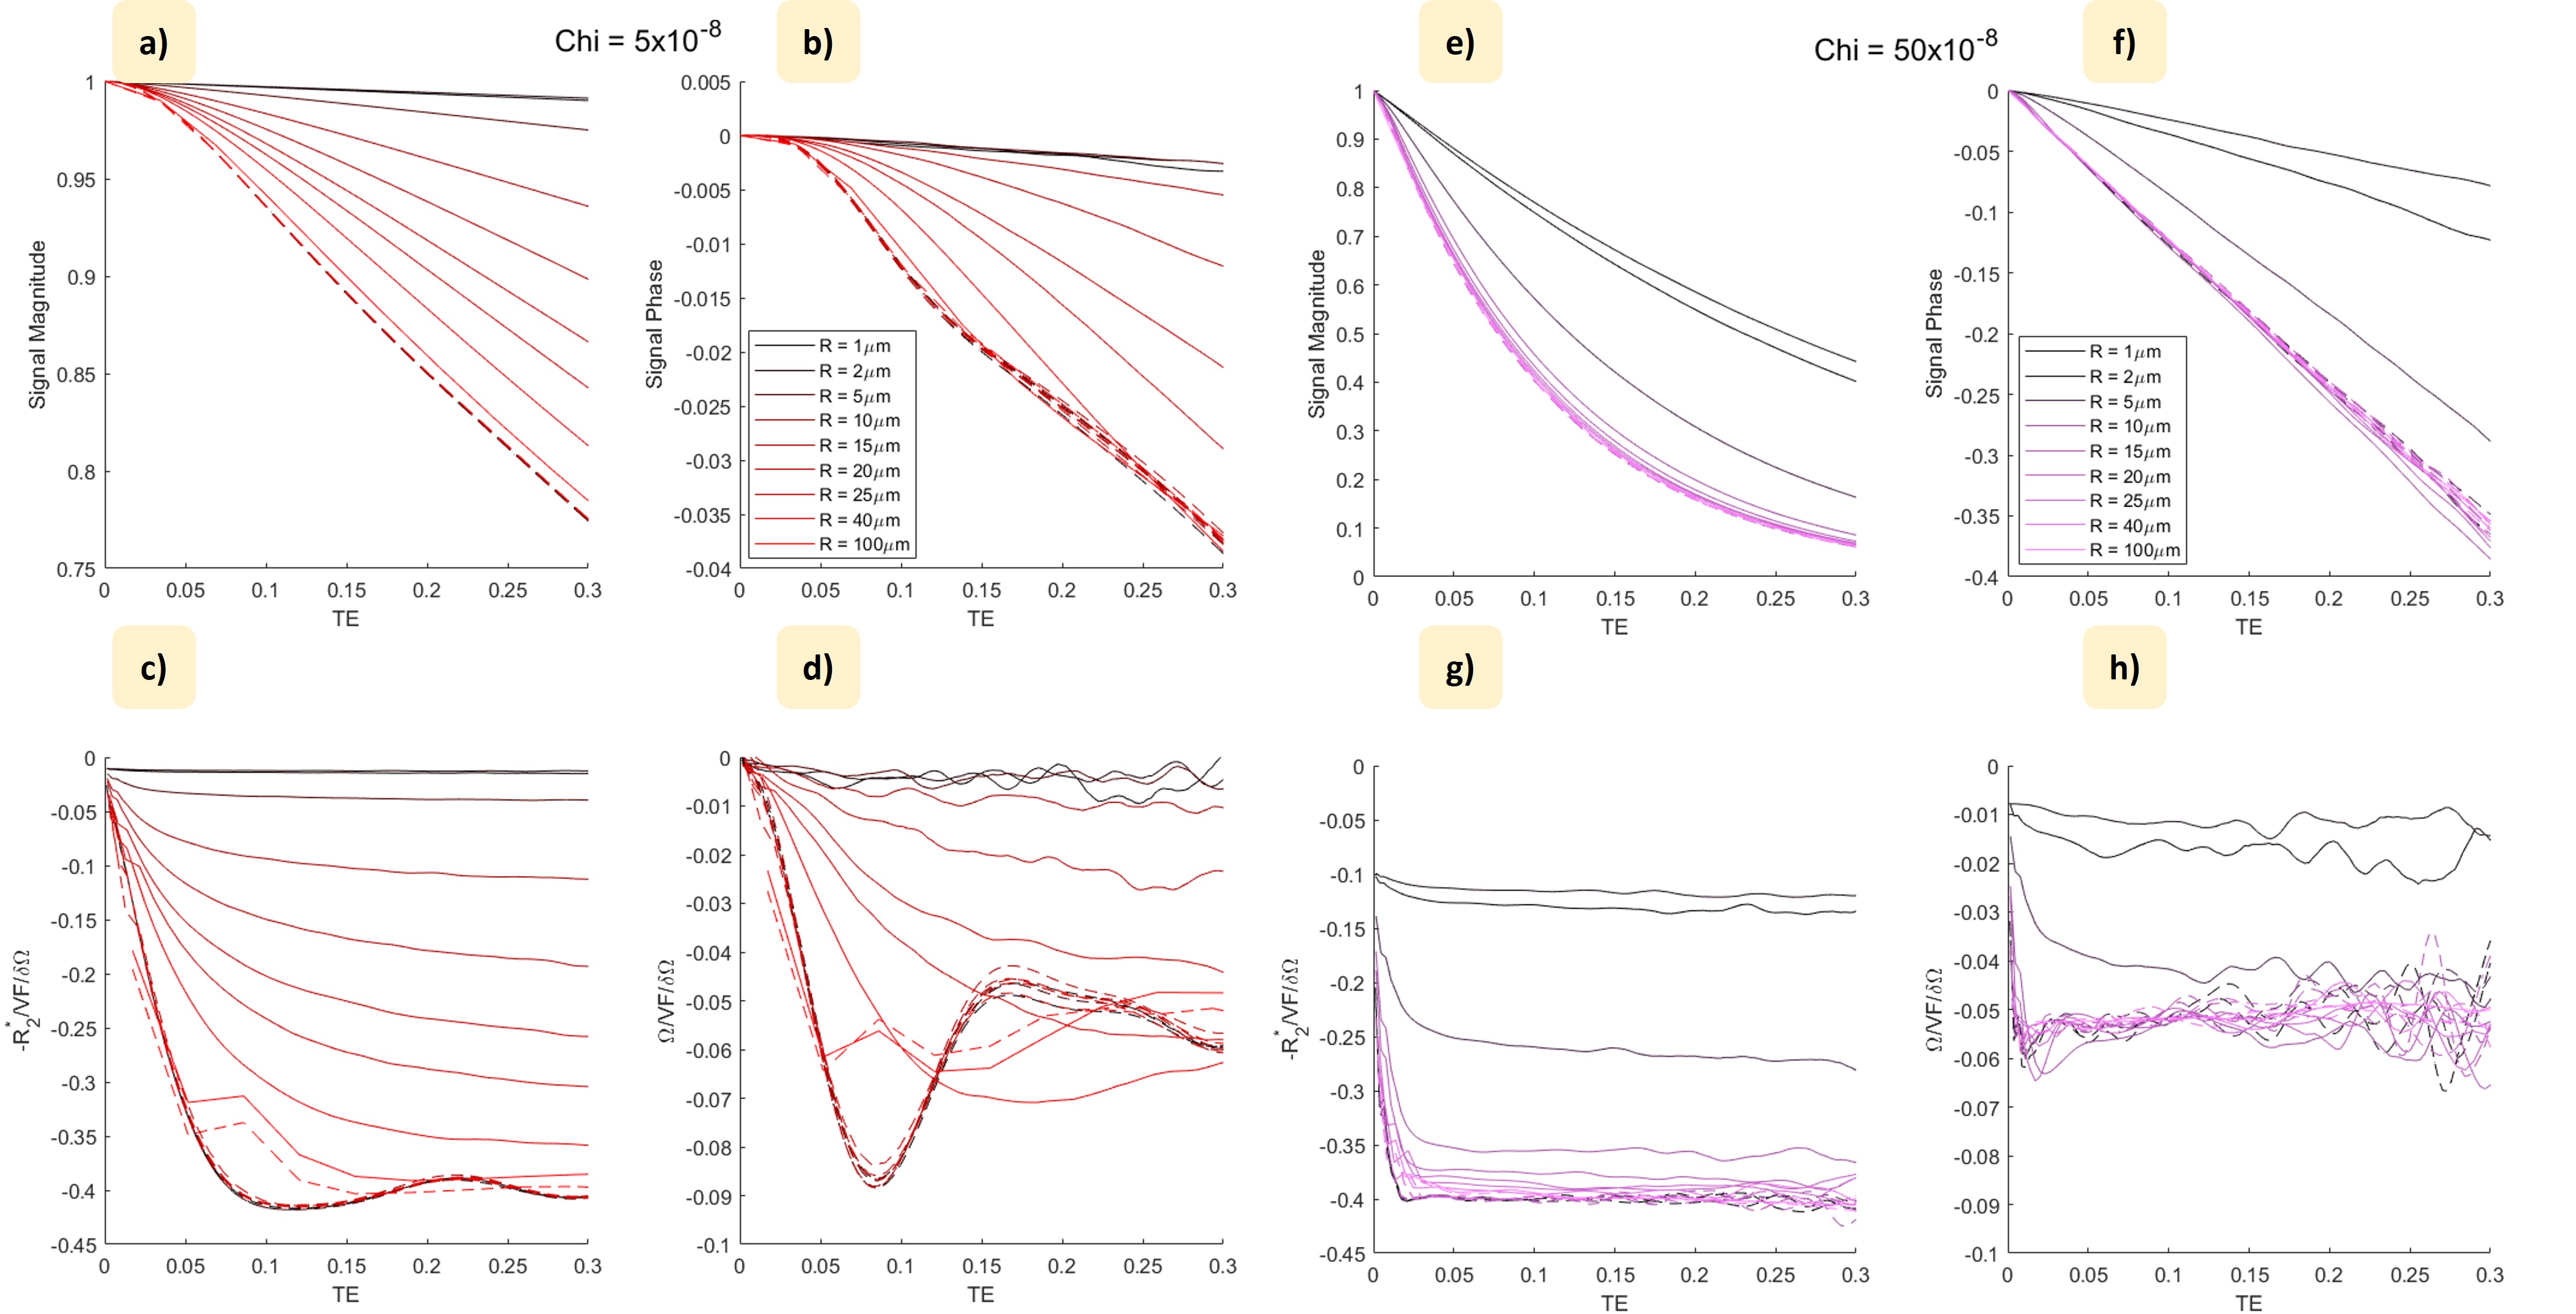
Plots of the temporal variation of the signal magnitude (a & e) and phase (b & c) for ‘soft spheres of different radii (VF = 2.5%; B0=7T) for c-values of 0.05 and 0.5 ppm. Continuous/dashed lines show signal evolution with and without diffusion (D =10-9 m2s-1). Values of R2*/ VF dW (c & g) and W/ VF dW (d &h) derived from the temporal derivatives of the log(signal magnitude) and phase are also shown. Values are similar to those found for ‘hard’ spheres (Figure 2).
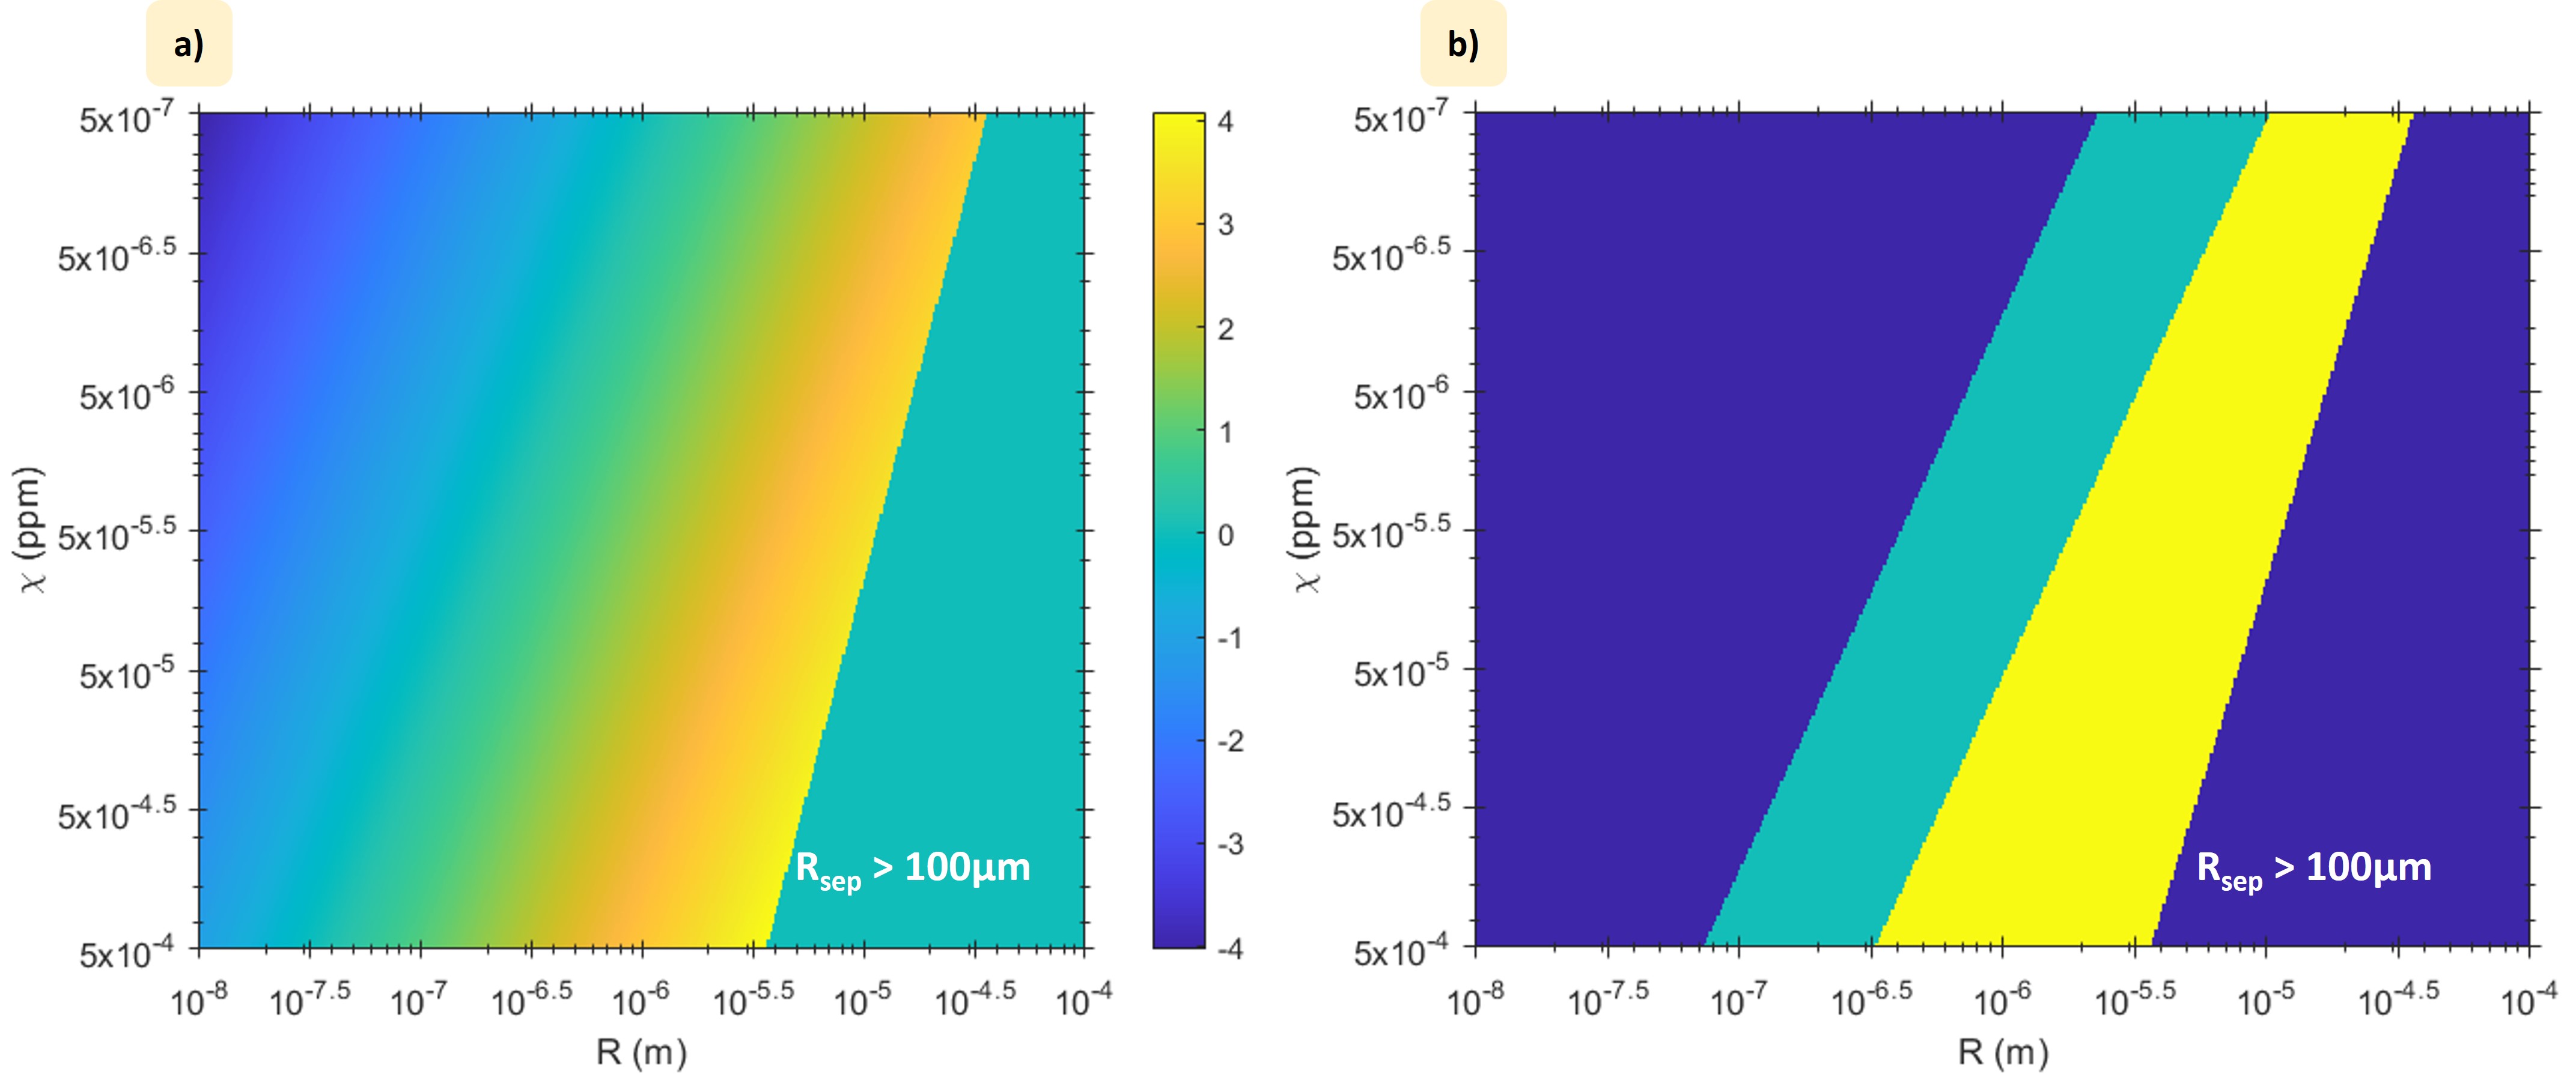
(a) Variation of log10(dWR2/D) for c-values ranging from 0.5 - 500 ppm and R-values ranging from 0.01 - 100µm, assuming of $$$\chi_{av}$$$=0.1 ppm due to non-haeme iron. A value of zero is reported for the region where Rsep > 100 μm. (b) Regions where Rsep < 100μm and $$$5< \delta\Omega R^{2}/D< 100$$$ (green) and $$$\delta\Omega R^{2}/D> 100$$$ (yellow) are highlighted.