4486
Inter-subject variability in fiber orientation density function increases with aging1Neuroscience, Medical University of South Carolina, Charleston, SC, United States, 2Neurology, Medical University of South Carolina, Charleston, SC, United States
Synopsis
Keywords: Tractography & Fibre Modelling, Microstructure
The fiber orientation density function (fODF) estimated from diffusion MRI is typically used as an input for fiber tractography or microstructural modeling. However, since it encodes the fine details of the intra-voxel distribution of axon orientations, it can also be regarded as a quantity of physical interest that is potentially sensitive to subtle white matter changes. Here we demonstrate a method for quantifying inter-subject fODF differences in individual voxels within a white matter skeleton for a cohort of healthy older adults. We find that inter-subject fODF variability increases with age suggesting that diverse processes affect axons in healthy aging.Introduction
Axon microgeometry within individual voxels may be characterized by the fiber orientation density function (fODF)1. When estimated from diffusion MRI (dMRI) data, the fODF in a white matter voxel typically serves as an input for microstructural models2-6 or for the calculation of fiber tractography7. Despite providing a richly detailed representation of axon orientations, the fODF itself has rarely be regarded as a primary quantity of investigation. With MRI hardware improvements, it is now practical to gather dMRI data at strong diffusion weightings with good SNR allowing for estimation of high fidelity fODFs8. Hence, direct assessment of fODF fine structure is a potential means of investigating white matter alterations in both health and disease. Here we expand upon our previous work on high fidelity fODFs8 with findings in a healthy aging cohort spanning roughly four decades.Methods
Participants were 63 healthy older adults (71.4% female) with an average age of 64.5 +/- 8.6 yrs (range: 45.1 to 84.7 yrs). dMRI data were acquired on a Prismafit 3T scanner at a b-value of 6000 s/mm2 with 128 diffusion encoding directions. Additional imaging parameters were TE/TR = 95/4800 ms with 3 mm isotropic voxels, 74 x 74 acquisition matrix, 42 axial slices, bandwidth of 1648 Hz/px, slice acceleration/parallel imaging factors = 2/2. An additional 10 b = 0 s/mm2 images were collected using identical imaging parameters. Using fiber ball imaging4,5, fODFs were estimated using a spherical harmonic expansion up to a degree of l = 8. All subject data were aligned into a study-specific template space using DTI-TK9 and a white matter skeleton was created using TBSS from FSL10 with a fractional anisotropy threshold of 0.2. Each fODF was then rotated into a local frame of reference based on individual fODF structure8 with all negative values being eliminated via an optimized rectification method11. To quantitatively compare fODFs, we employed the Matusita distance12 $$d_{M} \equiv \sqrt{\int d\Omega_{\bf{u}}\left[ \sqrt{F_{1}(\bf{u})} - \sqrt{F_{2}(\bf{u})} \right] ^{2}}$$ where $$$F_{1}(\bf{u})$$$ is the fODF for a white matter voxel on the TBSS skeleton of an individual subject and $$$F_{2}(\bf{u})$$$ is the average fODF of this voxel across subjects. Here the fODFs are normalized so that their integral over all directions is unity. With this normalization, the Matusita distance always lies between 0 and $$$\sqrt{2}$$$. Maps of the voxel-wise average dM values across all subjects and of the voxel-wise Spearman's correlations for individual dM values with age were then calculated.Results
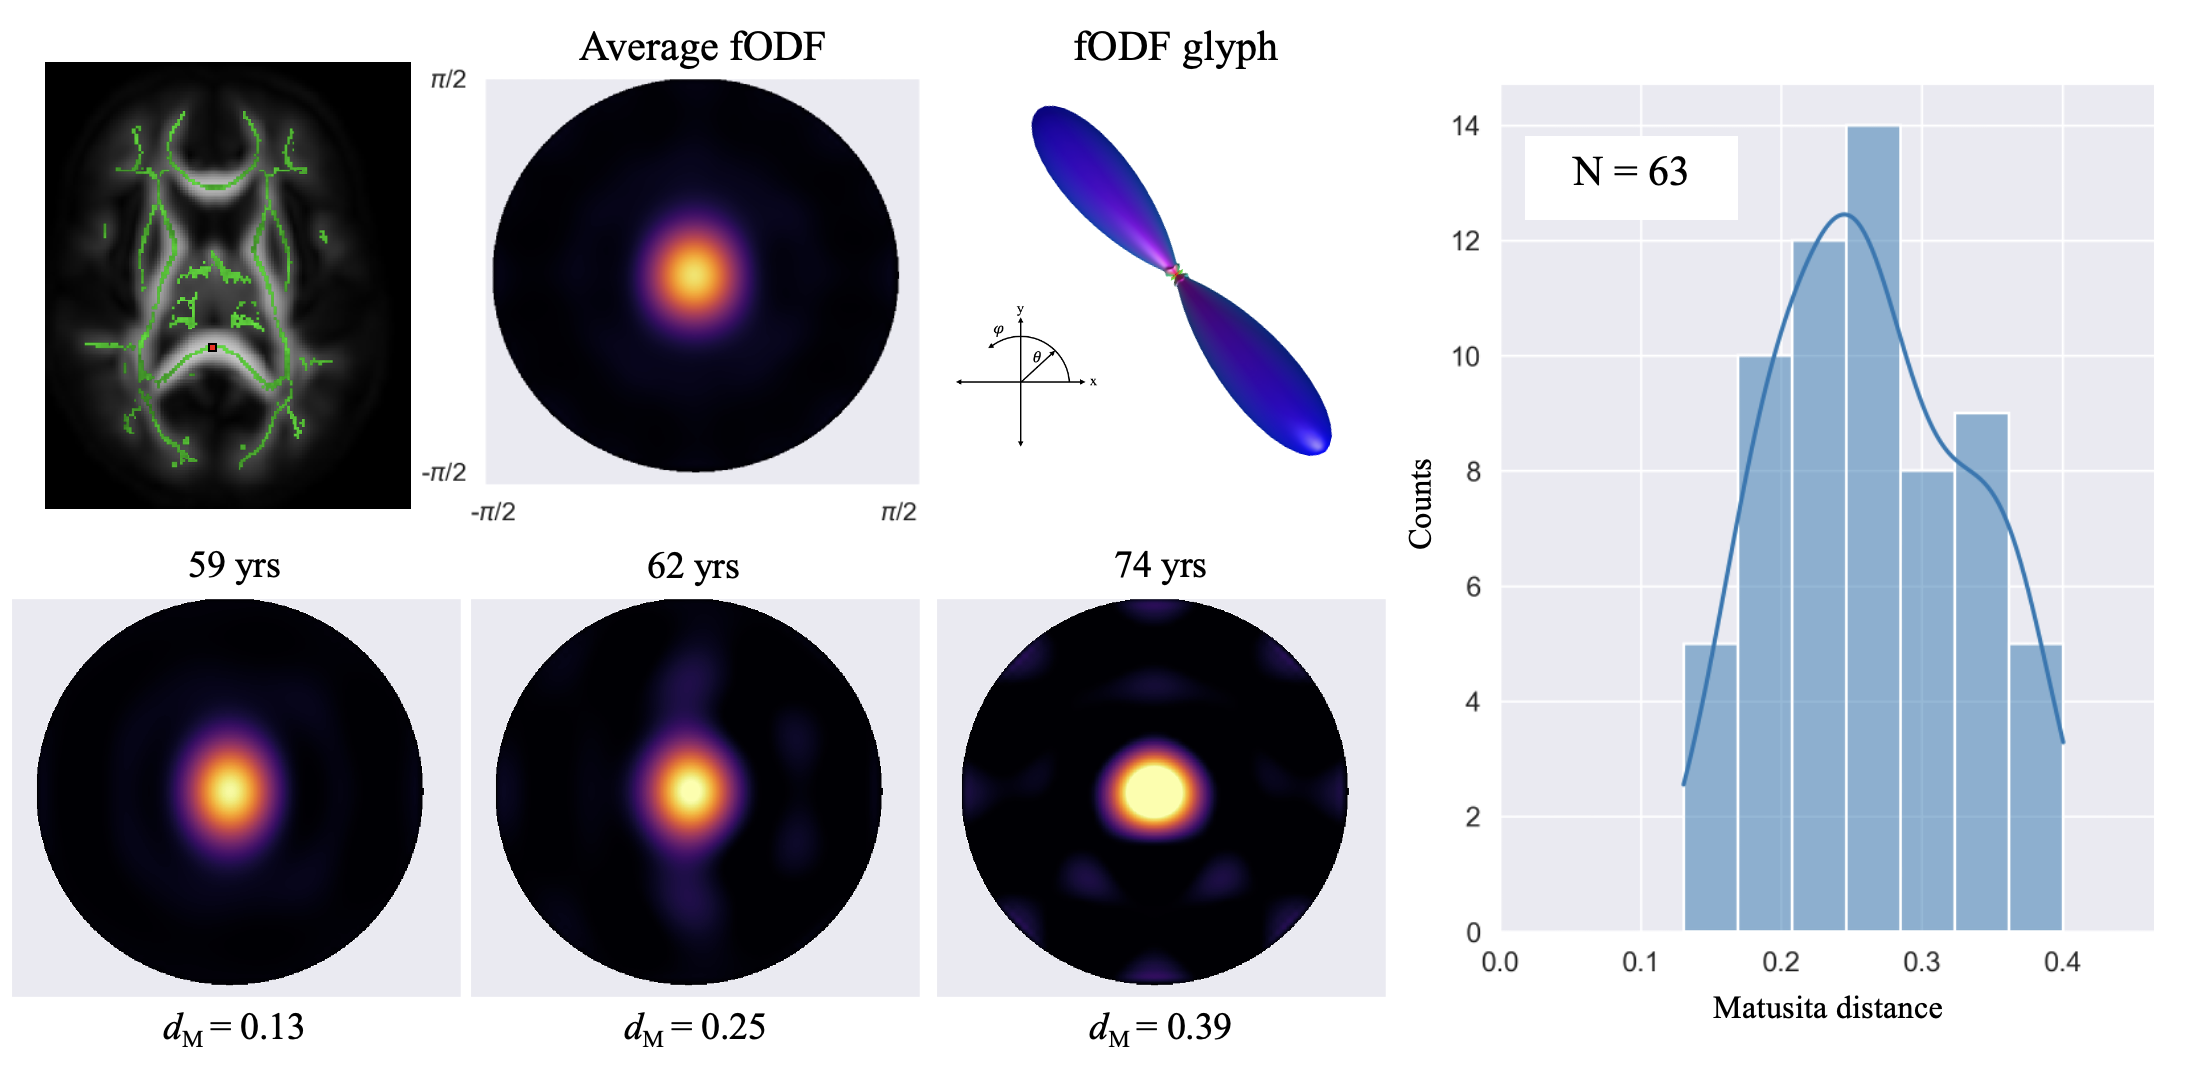
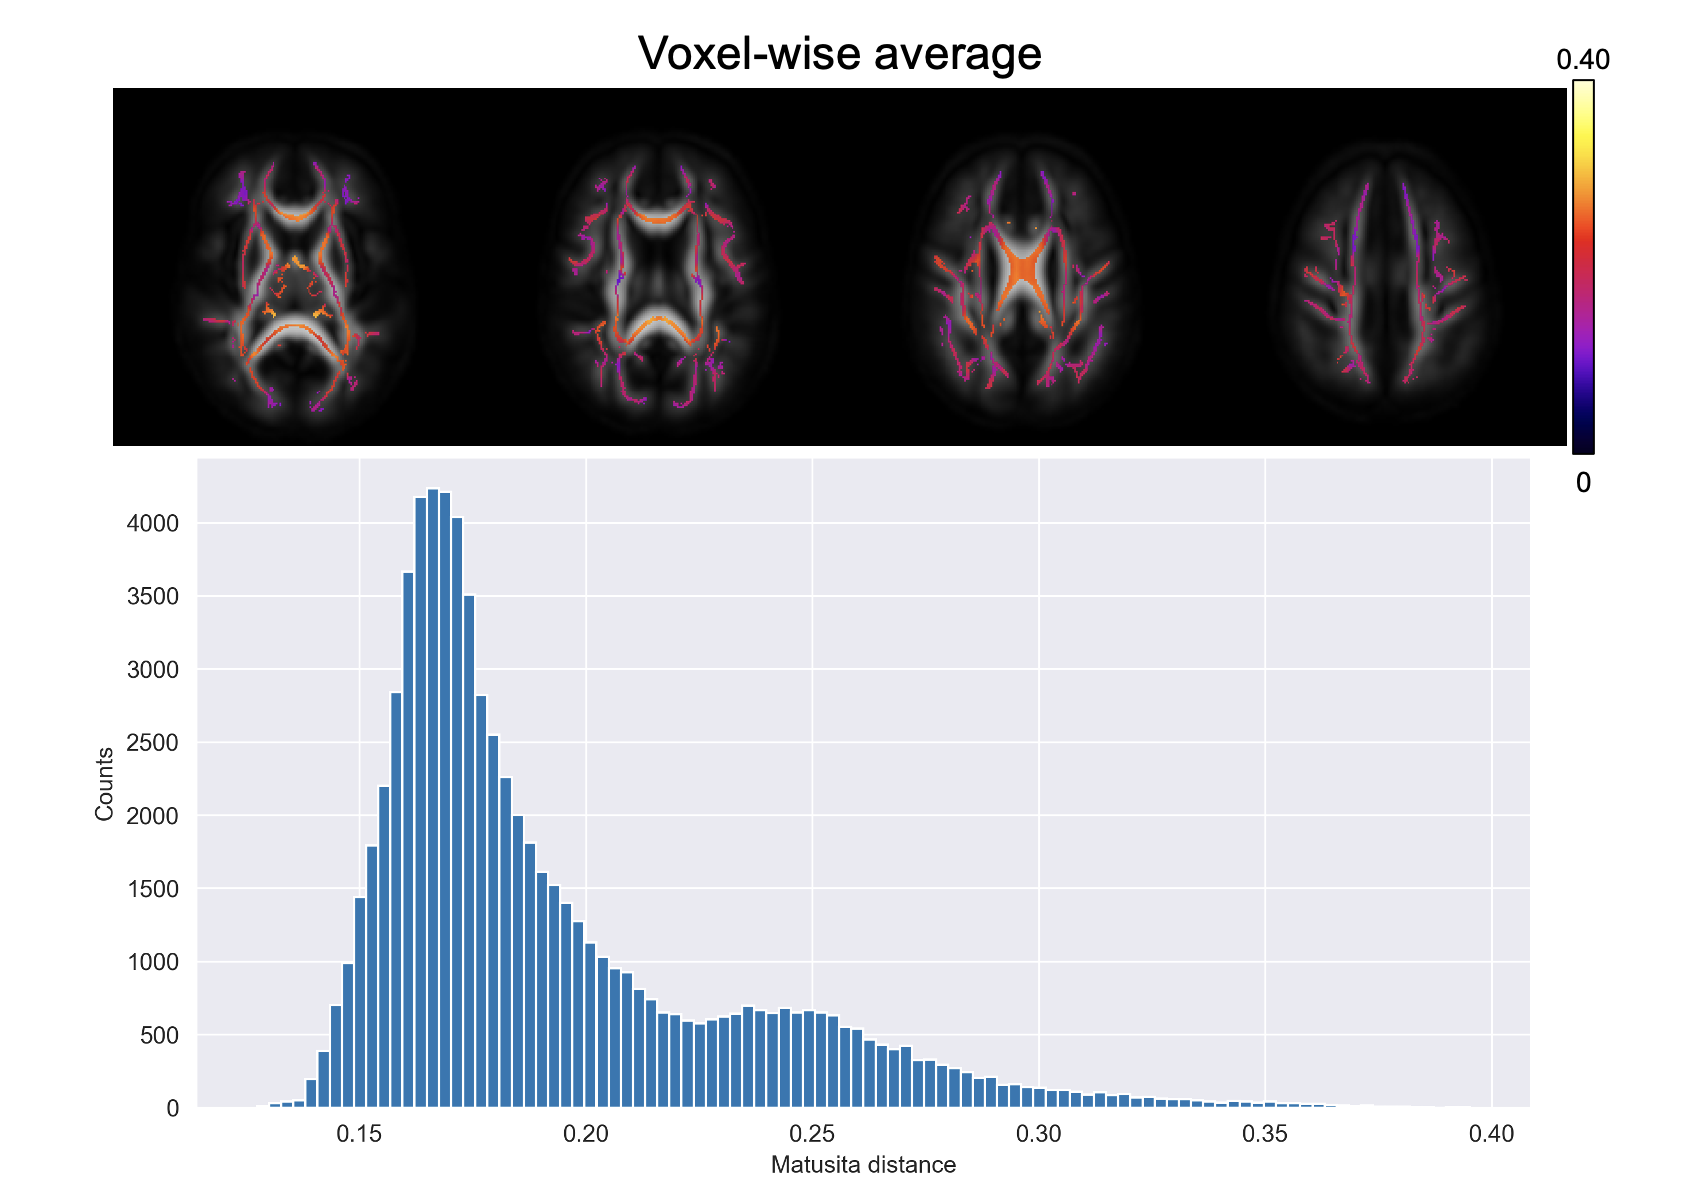
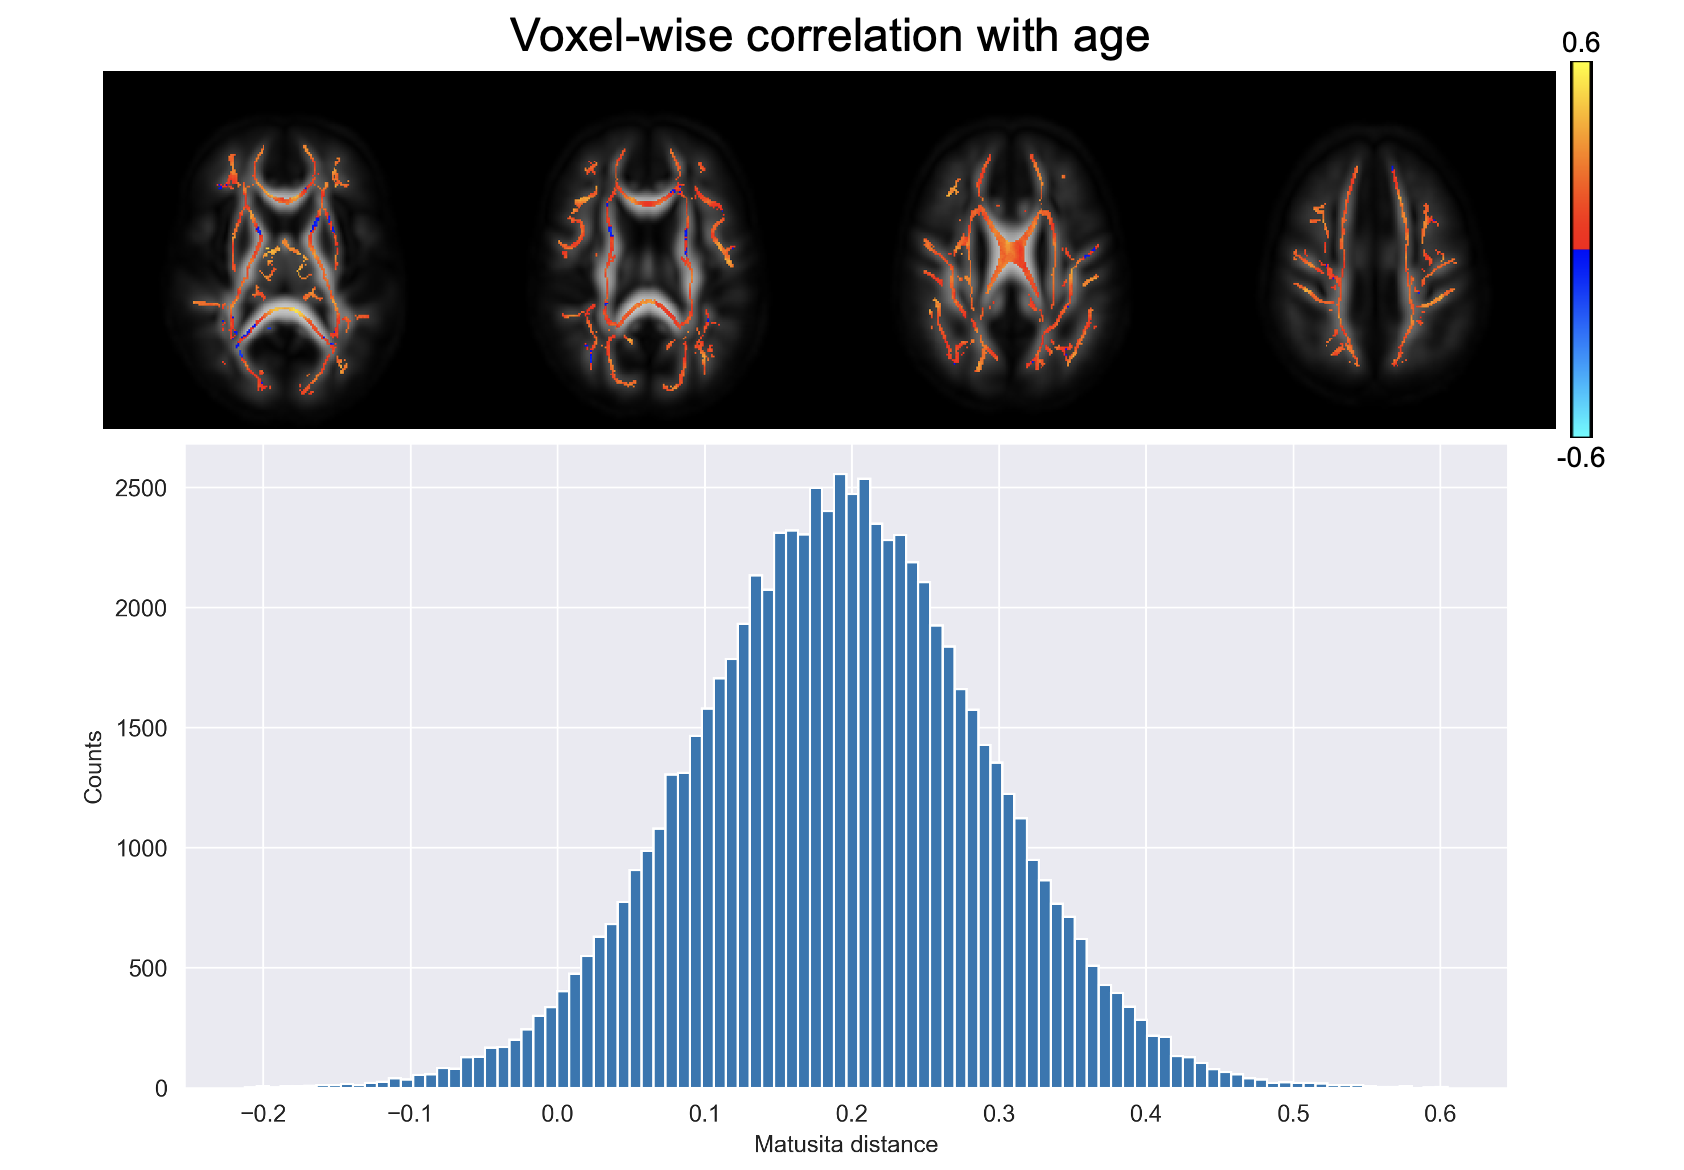
Figure 1 shows a voxel from the splenium highlighted in red along with the white matter skeleton in green. Together with the conventional three-dimensional fODF glyph, Figure 1 also shows the fODF averaged across all subjects represented as a hemispheric equidistant azimuthal projection (HEAP) in a local frame of reference, which is based on the individual fODF structure. Note, due to antipodal symmetry, only half of the fODF is depicted. The distribution of dM values is shown, which has a maximum between 0.2 and 0.3, as well as three individual subject fODF HEAP maps with the corresponding ages and Matusita distances. The voxel-wise average Matusita difference in fODF structure on the white matter skeleton is shown in the top row of Figure 2, while the corresponding histogram given by the bottom row. In the histogram, we observe a bimodal distribution with an average of 0.23 ± 0.07. Upon thresholding at 0.25, roughly the peak of the smaller subdivision, we observed that the genu and splenium of the corpus callosum, along with the optic radiations and brain stem white matter structures remain. Correlating the voxel-wise Matusita distance values with age, in Figure 3, a positively shifted distribution is observed. The histogram of values has a peak at roughly 0.2. Moreover, pooling white matter voxels from all subjects and correlating with age, we observe a global correlation coefficient of 0.15 (p < 10-8). This positive correlation demonstrates that fODF variability increases with age.Discussion and Conclusion
This abstract demonstrates a novel approach for assessing white matter through quantitative analysis of high fidelity fODFs. We report the Matusita distance between fODFs for individual subjects and the average fODF across all subjects of a healthy aging cohort for voxels in a white matter skeleton. These distances were found to lie within the range of 0.03 to 0.70 with an average of an average of 0.23 ± 0.07, which characterizes the inter-subject variability of the fODFs. We also find that inter-subject variability increases with age, where the typical voxel-wise correlation coefficient for the examined voxels is about 0.2. This suggests that axonal changes associated with aging involve diverse processes that vary considerably among individuals even in normal aging. Further analysis of these individual fODF differences may help to better characterize of the details of these age-associated changes in axon microgeometry. The methods highlighted in the study could also be applied to investigate axonal changes that result from white matter disease and neurodegeneration.Acknowledgements
This work supported, in part, by National Institutes of Health grants R01AG054159 and RF1AG057602.References
1. Tournier JD, Calamante F, Gadian DG, Connelly A. Direct estimation of the fiber orientation density function from diffusion-weighted MRI data using spherical deconvolution. NeuroImage. 2004;23(3):1176-1185.
2. Dell'Acqua F, Tournier JD. Modelling white matter with spherical deconvolution: How and why?. NMR Biomed 2019;32:e3945.
3. Novikov DS, Fieremans E, Jespersen SN, Kiselev VG. Quantifying brain microstructure with diffusion MRI: Theory and parameter estimation. NMR Biomed 2019;32:e3998.
4. Jensen JH, Glenn GR, Helpern JA. Fiber ball imaging. NeuroImage. 2016;124:824-833.
5. Moss HG, McKinnon ET, Glenn GR, Helpern JA, Jensen JH. Optimization of data acquisition and analysis for fiber ball imaging. NeuroImage 2019;200:690-703.
6. McKinnon ET, Helpern JA, Jensen JH. Modeling white matter microstructure with fiber ball imaging. NeuroImage 2018;176:11-21.
7. Jeurissen B, Descoteaux M, Mori S, Leemans A. Diffusion MRI fiber tractography of the brain. NMR Biomed 2019;32:e3785.
8. Moss H, Jensen JH. High fidelity fiber orientation density functions from fiber ball imaging. NMR Biomed 2022;35: e4613.
9. Zhang H, Yushkevich PA, Alexander DC, Gee JC. Deformable registration of diffusion tensor MR images with explicit orientation optimization. Med Image Anal 2006;10:764–85.
10. Smith SM, Jenkinson M, Johansen-Berg H, Rueckert D, Nichols TE, Mackay CE, et al. Tract-based spatial statistics: voxelwise analysis of multi-subject diffusion data. NeuroImage 2006;31:1487–505.
11. Moss HG, Jensen JH. Optimized rectification of fiber orientation density function. Magn Reson Med 2021;85:444-455.
12. Matusita K. Decision rules, based on the distance, for problems of fit, two samples, and estimation. Ann Math Stat. 1955;26(4):631-640.
Figures