4484
A multi-compartment fingerprinting model for non-invasive tumor cell characterization via diffusion MRI1ICTEAM, UCLouvain, Louvain-la-neuve, Belgium, 2IoNS, UCLouvain, Louvain-la-neuve, Belgium
Synopsis
Keywords: Microstructure, Tissue Characterization
Brain tumor tissue characteristics are important for treatment planning but are nowadays often recovered via invasive biopsy analysis. This work attempts to characterize the microstructural properties of tumor cells using diffusion MRI and Monte Carlo simulations to build a dictionary composed of several fingerprints, combining both a representation of axonal fibers and tumor cells. We demonstrate the use of our method on in-vivo brain data as a reliable estimation of tumor cell properties.Introduction
Monte Carlo simulations are a proven useful tool to simulate diffusion phenomena of water molecules in complex environments1. Combined with diffusion Magnetic Resonance Imaging (dMRI) and microstructural models, these tools help to better understand and characterize complex biological phenomena. Previous works have mainly focused either on a white matter model to reflect the complexity of axonal organization2 or on tumor tissue3,4. This work extends Microstructure Fingerprinting (MF)5, a dMRI model focused on axonal organization, with a model of tumor cells to create an environment composed of cylinders and spheres and to obtain a more realistic representation of the pathological processes involved in brain tumor. The feasibility of our method has been validated on human data from the Brain Tumor Connectomics project6,7.Methods
Dictionary generationThe following hypotheses were used to simulate several environments, each corresponding to a unique microstructural configuration, obtained by leveraging the physical accuracy of Monte Carlo simulations1.
- All simulations were performed with 11 b-values ($$$\in[0;5000]ms/\mu{m}^2$$$) and 400 different directions uniformly distributed over the sphere. For each shell, the orientations were evenly distributed and defined by an electrostatic repulsion algorithm8.
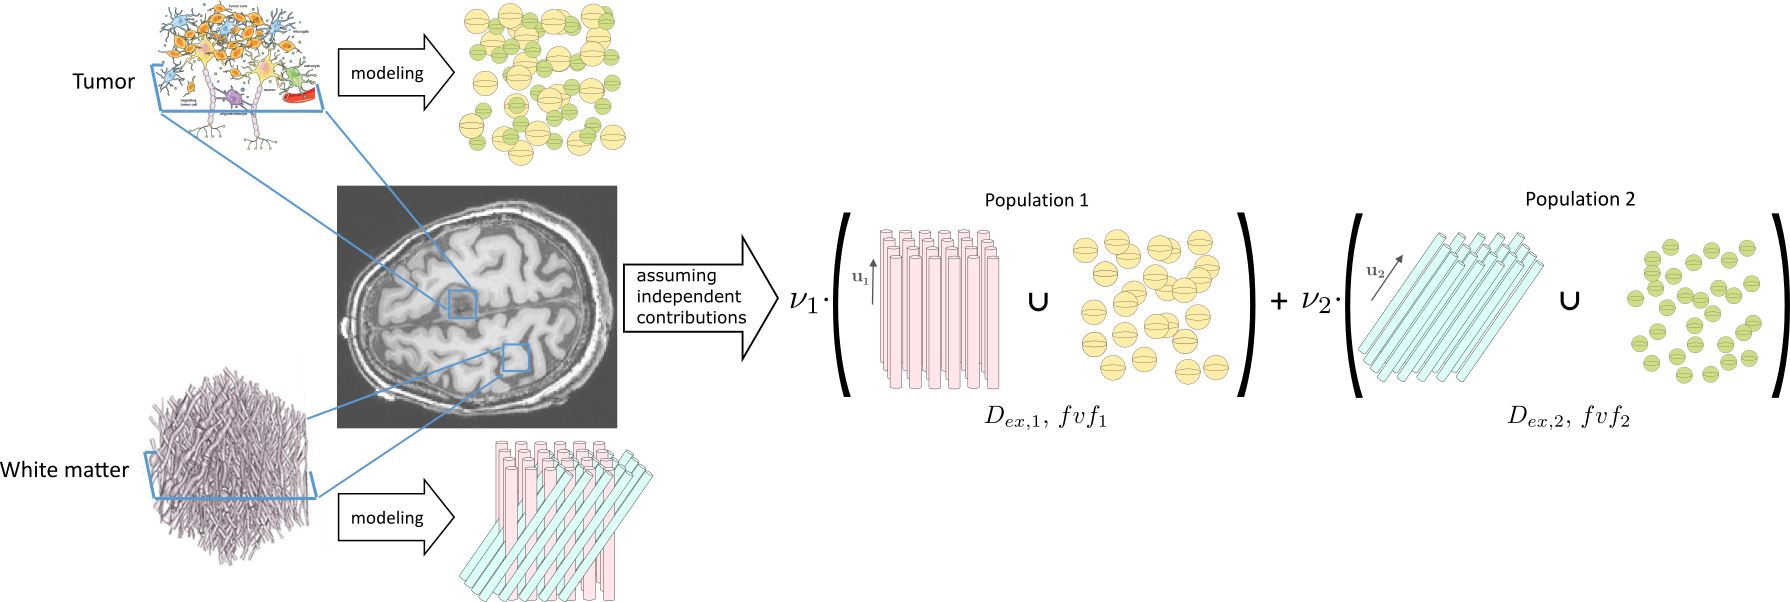
- Two distinct types of environment were defined following a gamma distribution ($$$\alpha=2.185$$$ and $$$\beta=0.75$$$). The first one is composed of cylinders and the second one of spheres (see Figure 1). For both environments, we analyzed the variation of two properties, the extracellular diffusivity $$$D_{ex}$$$ and the fiber volume fraction $$$\textit{fvf}$$$, respectively chosen from 38 equally spaced values within the range $$$[6e-10;2.4e-9]m^2/s$$$ and 10 equally spaced values in the $$$[0.06;0.8]$$$ range. The intra-axonal diffusivity was set to $$$2.2 \mu m^{2}/ms$$$9.
Microstructure Fingerprinting
The resulting dictionary is composed of a combination of 380 different signals, called fingerprints. For each voxel, the MF algorithm finds the combination of fingerprints closest to the dMRI signal. As shown in Figure 1, the signal in a voxel is represented by the weighted sum of two different populations, which can be fibers (cylinders) or tumor cells (spheres). There is an additional compartment allocated to the cerebrospinal fluid (CSF). The outputs provide different metrics characterizing the microstructure of the brain and more precisely tumor tissues.
Experiments
Our model was validated on 10 patients from the Brain Tumor Connectomics project. For each patient, the dataset contained multi-shell diffusion volumes ($$$\textit{b-val}=[0,700,1200,2800]ms/\mu{m}^2$$$), a tumor mask which was delineated manually with the support of a disconnectome, and 3D T1-weighted data6,7. The preprocessing steps were: brain extraction10, denoising11, susceptibility artifact correction12, and Eddy-current and head-motion correction13. Then, three metric maps were estimated for each patient with the multicompartment diffusion model: one representing the extracellular diffusion $$$D_{ex}$$$, another the volume occupancy fraction $$$\nu$$$ and the last one the density of the spheres $$$\textit{fvf}$$$. A Gaussian filter $$$g$$$ with a standard deviation $$$\sigma=3$$$ was applied to the $$$\textit{fvf}$$$ map: $$d_{t}(p)=\textit{fvf}(p)*g(\sigma,p),$$ with $$$p$$$ being the position within the volume space. This results in a new map, coined tumor density map $$$d_{t}(p)$$$, allowing the detection of clusters of tumor tissue, presenting a high concentration of the sphere environment.
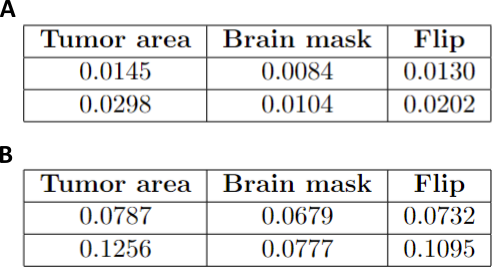
The mean values of two metrics, $$$\textit{fvf}$$$ and $$$\nu$$$, were compared between the tumor area, the rest of the brain and the mirror area of the tumor. The DICE and Jaccard indexes were computed between the tumor mask and a new mask generated by selecting the values of the tumor density map above 0.02 threshold.
Results and discussion
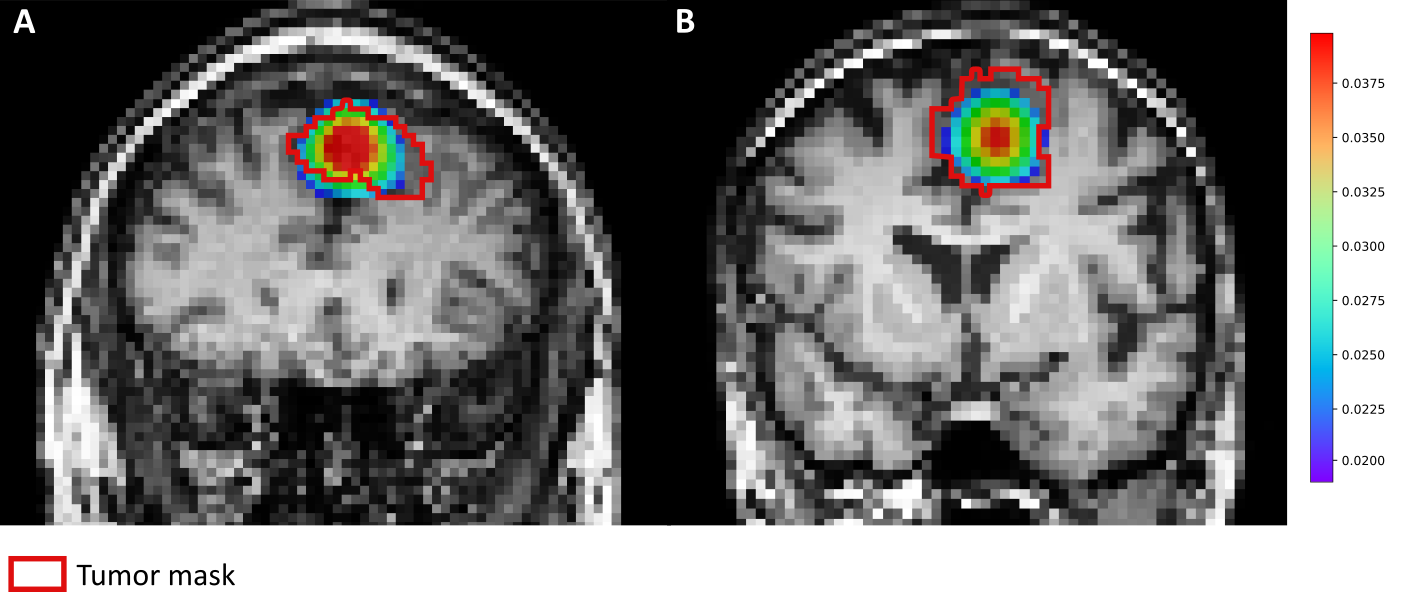
A high concentration of spheres in the tumor area compared to the rest of the brain is obtained in two out of the ten patients. Figure 2 depicts an overlay of the tumor density map $$$d_{t}(p)$$$ and the tumor mask on the anatomical scan, for those patients.Table 1 summarizes the mean values of $$$\textit{fvf}\:$$$and $$$\nu\:$$$inside the tumor mask, in the rest of the brain and the mirror area of the tumor. For both metrics, the values inside the tumor area are higher than in the other regions of the brain considered. Those results show that the model accurately places the tumor in the area containing the higher values of the tumor density map. Note that there is a volume fraction of the voxel still associated to the populations of neural fibers and CSF.
Finally, the DICE and Jaccard indexes averaged over both patients were 0.78 and 0.64 respectively. This is in agreement with the previous observations and confirms that the model locates the tumor in the area as the tumor mask for these two patients.
Conclusion
To sum up, we have accurately detected and characterized, using MF metrics, the location and features of the tumors on a few patient. The algorithm is still in its early stages of development and we hope to improve its accuracy of tumor detection. In addition, more complex and reliable simulations, as well as a larger dataset will improve the precision and quality of our estimations. Nonetheless, an updated version of our model could prove to be helpful to further our understanding of tumors. Moreover, in the future, it could assist us to make more effective and personalized treatment plans, while reducing the need for biopsy.Acknowledgements
No acknowledgement found.References
1. Rafael-Patino, J., Romascano, D., Ramirez-Manzanares, A., Canales-Rodríguez, E.J., Girard, G. and Thiran, J.P., 2020. Robust Monte-Carlo simulations in diffusion-MRI: Effect of the substrate complexity and parameter choice on the reproducibility of results. Frontiers in neuroinformatics, 14, p.8.
2. Haro, J.L.V., Gardier, R., Canales-RodrÃguez, E.J., Girard, G., Thiran, J.P. and Rafael-Patino, J., Towards a high-density packing white matter substrate generator for Monte-Carlo simulations.
3. Panagiotaki, E., Walker-Samuel, S., Siow, B., Johnson, S.P., Rajkumar, V., Pedley, R.B., Lythgoe, M.F. and Alexander, D.C., 2014. Noninvasive quantification of solid tumor microstructure using VERDICT MRI. Cancer research, 74(7), pp.1902-1912.
4. Gurney-Champion, O. J., Klaassen, R., Froeling, M., Barbieri, S., Stoker, J., Engelbrecht, M. R., and Nederveen, A. J. (2018). Comparison of six fit algorithms for the intra-voxel incoherent motion model of diffusion-weighted magnetic resonance imaging data of pancreatic cancer patients. PloS one, 13(4), e0194590.
5. Rensonnet, G., Scherrer, B., Girard, G., Jankovski, A., Warfield, S.K., Macq, B., Thiran, J.P. and Taquet, M., 2019. Towards microstructure fingerprinting: estimation of tissue properties from a dictionary of Monte Carlo diffusion MRI simulations. NeuroImage, 184, pp.964-980.
6. Aerts, H and Marinazzo, D (2022). BTC_preop. OpenNeuro. [Dataset] doi: doi:10.18112/openneuro.ds001226.v5.0.0
7. Aerts H, Schirner M, Jeurissen B, Van Roost D, Achten E, Ritter P, Marinazzo D. Modeling Brain Dynamics in Brain Tumor Patients Using the Virtual Brain. eNeuro. 2018 Jun 4;5(3):ENEURO.0083-18.2018.
8. Jones, D.K., Horsfield, M.A. and Simmons, A., 1999. Optimal strategies for measuring diffusion in anisotropic systems by magnetic resonance imaging. Magnetic Resonance in Medicine: An Official Journal of the International Society for Magnetic Resonance in Medicine, 42(3), pp.515-525.
9. Dhital, B., Reisert, M., Kellner, E. and Kiselev, V.G., 2019. Intra-axonal diffusivity in brain white matter. NeuroImage, 189, pp.543-550.
10. Otsu, N., 1979. A threshold selection method from gray-level histograms. IEEE transactions on systems, man, and cybernetics, 9(1), pp.62-66.
11. Veraart, J., Novikov, D.S., Christiaens, D., Ades-Aron, B., Sijbers, J. and Fieremans, E., 2016. Denoising of diffusion MRI using random matrix theory. Neuroimage, 142, pp.394-406.
12. Andersson, J.L., Skare, S. and Ashburner, J., 2003. How to correct susceptibility distortions in spin-echo echo-planar images: application to diffusion tensor imaging. Neuroimage, 20(2), pp.870-888.
13. Andersson, J.L. and Sotiropoulos, S.N., 2016. An integrated approach to correction for off-resonance effects and subject movement in diffusion MR imaging. Neuroimage, 125, pp.1063-1078.
Figures