4483
G-ratio Calculation in Multiple Sclerosis: The Impact of Diffusion Modelling for Axonal and Fiber Volume Fraction Determination1Physics and Astronomy, University of British Columbia, Vancouver, BC, Canada, 2International Collaboration on Repair Discoveries, University of British Columbia, Vancouver, BC, Canada, 3Medicine, University of British Columbia, Vancouver, BC, Canada, 4Radiology, University of British Columbia, Vancouver, BC, Canada, 5Imaging Physics, MD Anderson Cancer Center, Houston, TX, United States, 6School of Biomedical Engineering, University of British Columbia, Vancouver, BC, Canada, 7Pathology & Laboratory Medicine, University of British Columbia, Vancouver, BC, Canada, 8Radiology, Washington University, St. Louis, MO, United States
Synopsis
Keywords: Multiple Sclerosis, White Matter, myelin, axons, g-ratio, brain, microstructure, lesions, normal appearing white matter, multiple sclerosis
G-ratio is the ratio of the inner axonal diameter to the total outer diameter, including myelin. MRI-derived g-ratios in multiple sclerosis (MS) may convey microstructural tissue abnormalities. G-ratios were estimated using myelin water fraction scaled to myelin volume fraction, and axonal metrics from Diffusion Basis Spectrum Imaging (DBSI), Neurite Orientation Dispersion and Density Imaging (NODDI), Spherical Mean Technique (SMT), and ActiveAx for axon/fiber volume fraction in 122 MS patients. DBSI and ActiveAx derived g-ratios were higher in lesions than normal appearing white matter (NAWM), reflecting MS pathology. NODDI and SMT derived g-ratios were unexpectedly lower in lesions than NAWM.
Background
Multiple Sclerosis (MS) is characterized by brain tissue changes such as myelin and axonal loss1. Quantifying these microstructural changes is crucial for studying disease course and remyelination treatments2. One way to probe microstructure is through the g-ratio, defined as the ratio of the inner axon diameter to the outer myelin diameter3. Demyelination, as well as remyelination, will result in a smaller outer diameter and thus an increased g-ratio which has been estimated in white matter lesions compared to normal appearing white matter (NAWM) with MRI4–6. Different MRI techniques can be used to estimate the myelin, axon, and fiber volume fractions (MVF/AVF/FVF) that are needed to calculate the g-ratio3,7,8.Myelin water imaging (MWI) estimates the amount of myelin water by measuring the voxel-wise T2-decay signal9,10. Myelin water fraction (MWF) has been histopathologically validated as a myelin marker11 and can be scaled to estimate the MVF12. Diffusion MRI can probe the diffusion of water molecules, and various biophysical models can be used to separate different water pools. Neurite Orientation Dispersion and Density Imaging (NODDI) fits intracellular, extracellular, and cerebrospinal fluid (CSF) water contributing to imaging signals to determine the neurite density index (NDI)13,14. NODDI is commonly used to estimate AVF3–5. Spherical Mean Technique (SMT) averages imaging signals from the same b-value to remove orientation effects and models intra- and extra-axonal compartments, producing an intra-axonal volume fraction (IAVF)14,15. ActiveAx fits for 4 water compartments (intra-axonal, extra-axonal, CSF, stationary water) to provide estimates of axon diameters and IAVF16,17. Diffusion Basis Spectrum Imaging (DBSI) models different diffusion tensors associated with myelinated and unmyelinated axons, restricted diffusion, nonrestricted diffusion, and CSF, and extracts the fiber fraction (FF)14,18.
Objective
Compare lesion and NAWM g-ratios in MS brain using MWF for MVF and NODDI, SMT, ActiveAx, and DBSI metrics to determine AVF/FVF.Methods
Data Collection: 122 MS patients (Figure 1) underwent 3T MRI (Philips Achieva) to collect MWI (48-echo Gradient and Spin Echo, TR/TE=1073/8ms, resolution=1x1x2.5mm3)19, diffusion (99 directions, b values=0–1500, TR/TE=4798/79ms, voxel size=2×2×2mm3)20, 3DT1 (TR/TE/TI=3000/3.5/926ms, resolution=1x1x1mm3), and proton-density/T2-weighted (TR/TE1/TE2=2900/8.42/80ms, resolution=1x1x3mm3). MS participants were included from 2 studies using the same MRI protocol.Analysis: Voxel-wise MWF maps (T2<40ms) were made using NNLS9,10. MWF maps were scaled to represent MVF (Eq. 1)12. Diffusion data was eddy current corrected and smoothed (FSL toolbox21). NODDI NDI and ActiveAx IAVF maps were made with AMICO13,22. DBSI FF maps were made with in-house MATLAB software20. SMT was used to make IAVF maps15. AVFNODDI (Eq. 2)3,5, AVFSMT (Eq. 3)23,24, and AVFActiveAx (Eq. 3) were calculated. G-ratios were calculated using MVF and NODDI/SMT/ActiveAx AVF (Eq. 4)3,5, and DBSI FF for FVF (Eq. 5)3,5,7. All quantitative maps were registered to 3DT1. Lesion masks were segmented using PD/T2 seed points25, then registered to 3DT1. MS NAWM masks were segmented on the 3DT1 (FAST26), with lesion and CSF masks subtracted. Masks were overlaid on registered metric maps to obtain mean NAWM and lesion values.
$$$MVF = \frac{MWF\times 0.86}{MWF\times (0.86-0.36)+0.36}$$$ (Eq.1)
$$$AVF_{NODDI} = (1-MVF)\times (1-V_{iso})\times V_{ic}$$$ (Eq.2)
$$$AVF_{SMT/ActiveAx} = (1-MVF)\times V_{intra-axonal}$$$ (Eq.3)
$$$g=\sqrt{\frac{1}{1+\frac{MVF}{AVF}}}$$$ (Eq.4)
$$$g=\sqrt{1-\frac{MVF}{FVF}}$$$ (Eq.5)
Pairwise Pearson correlation coefficients assessed relationships between g-ratios calculated using NODDI, SMT, ActiveAx and DBSI in MS NAWM and lesions. Paired t-tests evaluated differences between g-ratios, MVF, AVFNODDI, AVFSMT, AVFActiveAx, and FVFDBSI in NAWM and lesions (Bonferroni corrected p<4x10⁻⁴, uncorrected p<0.05).
Results and Discussion
Representative maps are shown in Figure 2.Correlation plots between g-ratios are shown in Figure 3. In NAWM all g-ratios were strongly correlated with each other. In lesions NODDI and SMT, NODDI and ActiveAx, and ActiveAx and DBSI g-ratios were strongly correlated (R>0.8). NODDI and DBSI (R=0.65), SMT and ActiveAx (R=0.78), and SMT and DBSI (R=0.5) were moderately correlated in lesions. G-ratios may be more difficult to estimate in lesions due to debris causing breakdown of modelling assumptions, leading to lower correlations between the g-ratios from different analysis methods.
Lesion g-ratios were significantly lower than NAWM when g-ratio was calculated using NODDI (0.76 vs. 0.78, p<1x10⁻⁵) and SMT (0.78 vs. 0.80, p<1x10⁻⁵), but significantly larger in lesions when calculated using DBSI (0.79 vs. 0.77, p<1x10⁻⁵) and ActiveAx (0.82 vs. 0.81, p=3x10⁻⁴) (Figure 4). Lower g-ratios in lesions were unexpected, as g-ratios are expected to increase in lesions due to demyelination (greater decrease of MVF than AVF). Lower g-ratios in lesions compared to NAWM could suggest that primarily thinly myelinated axons were lost27.
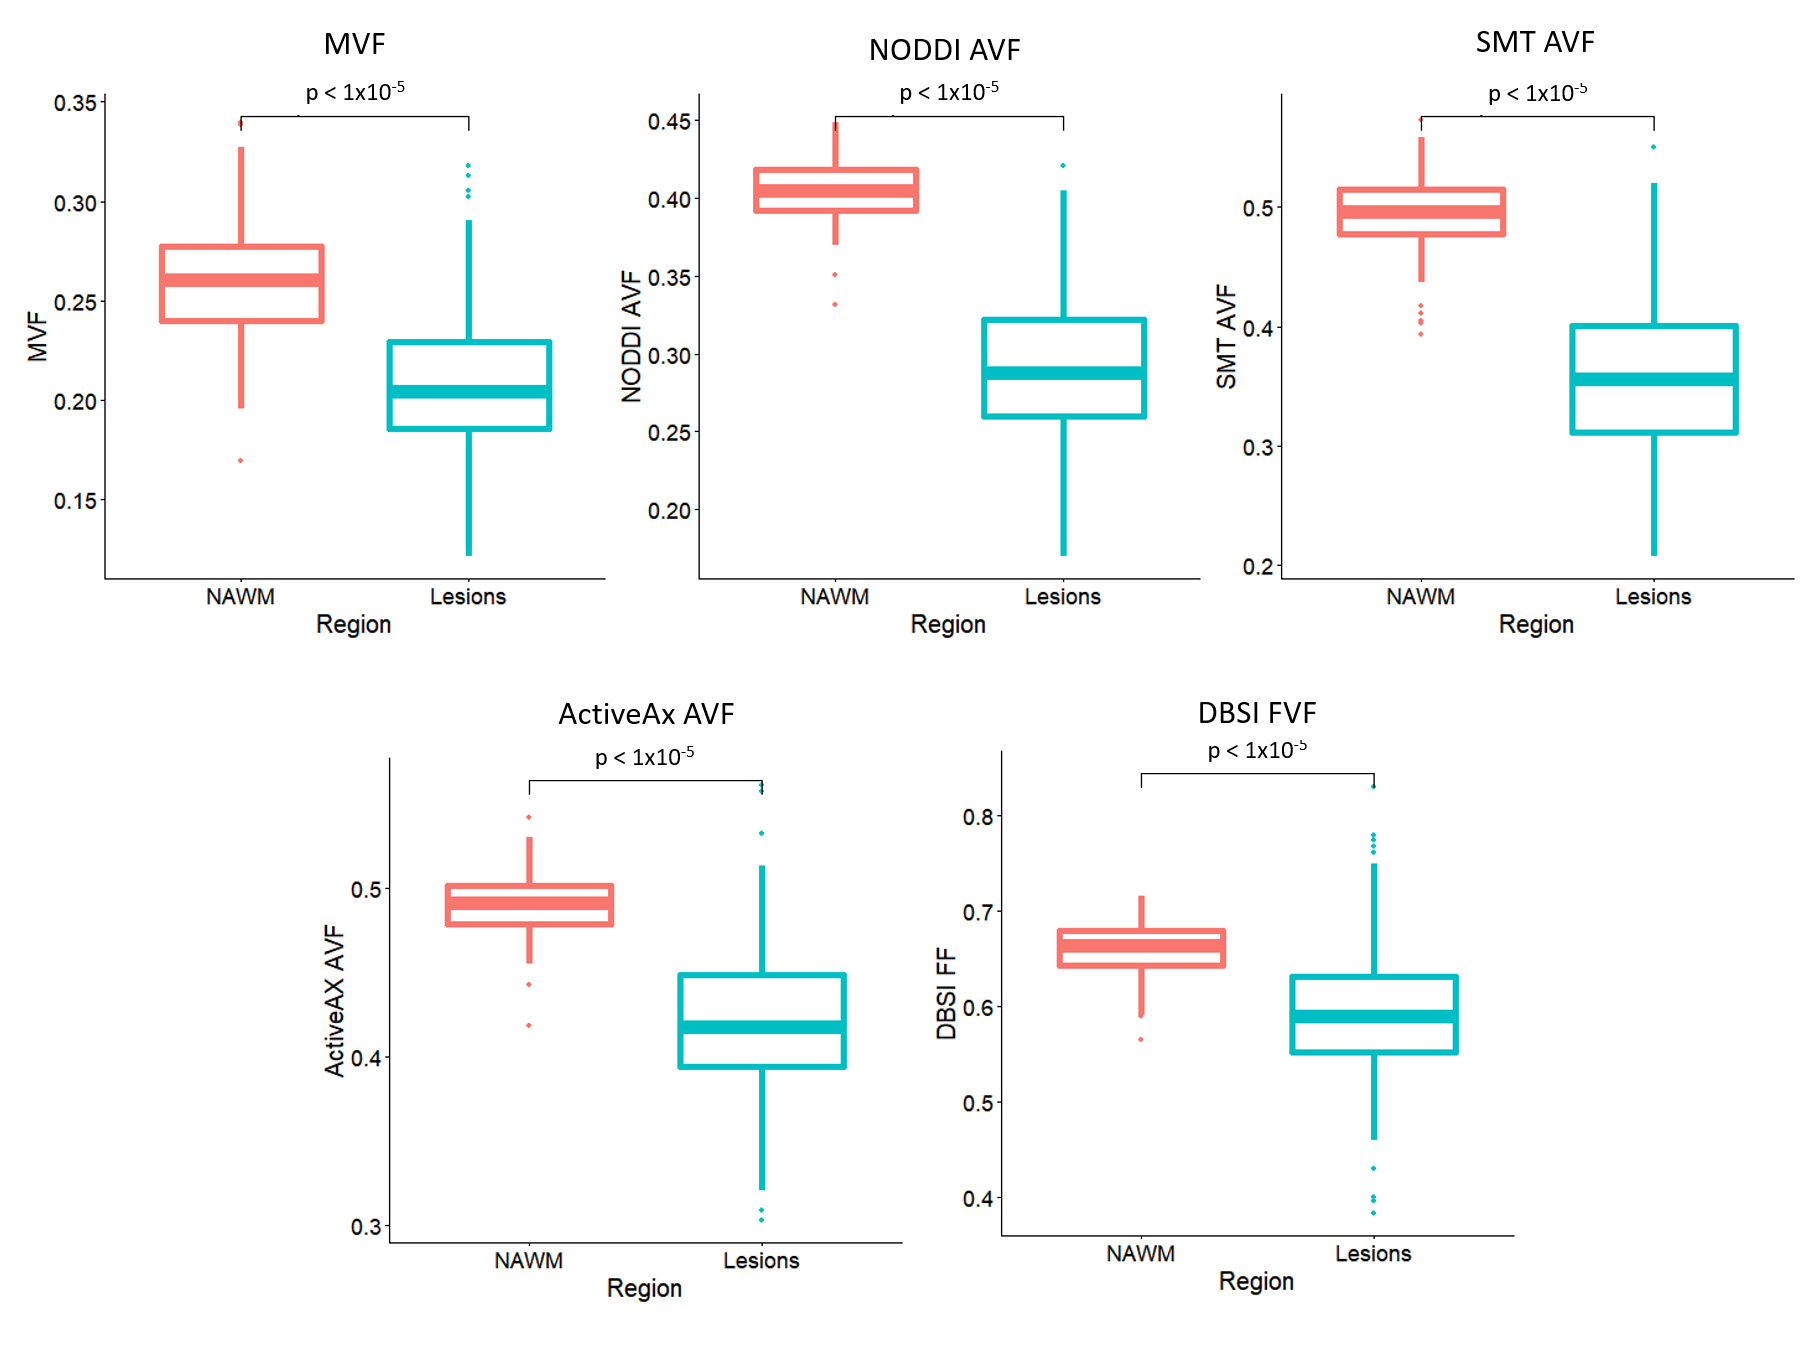
MVF (0.21 vs. 0.26, p<1x10⁻⁵), AVFNODDI (0.29 vs. 0.40, p<1x10⁻⁵), AVFSMT (0.36 vs. 0.49, p<1x10⁻⁵), AVFActiveAx (0.42 vs. 0.49, p<1x10⁻⁵) and FVFDBSI (0.59 vs. 0.66, p<1x10⁻⁵) were significantly lower in lesions when compared to NAWM as expected (Figure 5). For NODDI and SMT the lower g-ratios in lesions are the result of a greater decrease in AVF than ActiveAx.
Conclusion
G-ratios calculated using DBSI and ActiveAx with MWF produced the expected pattern of higher g-ratio in lesions vs. NAWM, while NODDI and SMT yielded an unexpected lower g-ratios in lesions. Neurodegenerative processes and loss of axons in MS, alongside demyelination, complicate diffusion modelling for axonal/fiber-related metrics and g-ratio interpretation. Further work comparing g-ratios to histology is needed to investigate the contributing mechanism and accuracy of using different diffusion MRI metrics to determine g-ratio.Acknowledgements
The collection of the data was funded by the MS Society of Canada and F. Hoffman La Roche. TSJ was funded by an UBC MS Connect Summer Studentship Award funded from the Christopher Foundation and an endMS Master’s Studentship award from the Multiple Sclerosis Society of Canada. Thank you to the MRI technologists at the UBC MRI Research Center, the neurologists and staff at the UBC MS Clinic, as well as the study participants and their families. This work was conducted on the traditional, ancestral, and unceded (stolen) territories of Coast Salish Peoples, including the territories of the xwməθkwəy̓əm (Musqueam), Skwxwú7mesh (Squamish), Stó:lō and Səl̓ílwətaʔ/Selilwitulh (Tsleil-Waututh) Nations. As settler scholars who live and work on this land, we think its important to continue work understanding and dismantling how educational institutions participate in colonization.
References
1. Atlas of MS 3rd edition. September 2020.
2. Lubetzki C, Zalc B, Williams A, Stadelmann C, Stankoff B. Remyelination in multiple sclerosis: from basic science to clinical translation. Lancet Neurol. 2020;19(8):678-688. doi:10.1016/S1474-4422(20)30140-X
3. Campbell JSW, Leppert IR, Narayanan S, et al. Promise and pitfalls of g-ratio estimation with MRI. NeuroImage. 2018;182:80-96. doi:10.1016/j.neuroimage.2017.08.038
4. York EN, Martin SJ, Meijboom R, et al. MRI-derived g-ratio and lesion severity in newly diagnosed multiple sclerosis. Brain Commun. 2021;3(4):fcab249. doi:10.1093/braincomms/fcab249
5. Stikov N, Campbell JSW, Stroh T, et al. In vivo histology of the myelin g-ratio with magnetic resonance imaging. NeuroImage. 2015;118:397-405. doi:10.1016/j.neuroimage.2015.05.023
6. Yu F, Fan Q, Tian Q, et al. Imaging G-Ratio in Multiple Sclerosis Using High-Gradient Diffusion MRI and Macromolecular Tissue Volume. AJNR Am J Neuroradiol. 2019;40(11):1871-1877. doi:10.3174/ajnr.A6283
7. Stikov N, Perry LM, Mezer A, et al. Bound pool fractions complement diffusion measures to describe white matter micro and macrostructure. NeuroImage. 2011;54(2):1112-1121. doi:10.1016/j.neuroimage.2010.08.068
8. Berg R, Menegaux A, Guillaume G, et al. Towards advanced microstructural analyses of white matter: Quantitative regional comparison of different myelin measures. ISMRM 2020 P46.
9. Whittall KP, MacKay AL. Quantitative interpretation of NMR relaxation data. J Magn Reson 1969. 1989;84(1):134-152. doi:10.1016/0022-2364(89)90011-5
10. Prasloski T, Mädler B, Xiang QS, MacKay A, Jones C. Applications of stimulated echo correction to multicomponent T2 analysis. Magn Reson Med. 2012;67(6):1803-1814. doi:10.1002/mrm.23157
11. Laule C, Leung E, Li DK, et al. Myelin water imaging in multiple sclerosis: quantitative correlations with histopathology. Mult Scler J. 2006;12(6):747-753. doi:10.1177/1352458506070928
12. Jung W, Lee J, Shin HG, et al. Whole brain g-ratio mapping using myelin water imaging (MWI) and neurite orientation dispersion and density imaging (NODDI). NeuroImage. 2018;182:379-388. doi:10.1016/j.neuroimage.2017.09.053
13. Zhang H, Schneider T, Wheeler-Kingshott CA, Alexander DC. NODDI: Practical in vivo neurite orientation dispersion and density imaging of the human brain. NeuroImage. 2012;61(4):1000-1016. doi:10.1016/j.neuroimage.2012.03.072
14. Lakhani DA, Schilling KG, Xu J, Bagnato F. Advanced Multicompartment Diffusion MRI Models and Their Application in Multiple Sclerosis. Am J Neuroradiol. 2020;41(5):751-757. doi:10.3174/ajnr.A6484
15. Kaden E, Kelm ND, Carson RP, Does MD, Alexander DC. Multi-compartment microscopic diffusion imaging. NeuroImage. 2016;139:346-359. doi:10.1016/j.neuroimage.2016.06.002
16. Sepehrband F, Alexander DC, Kurniawan ND, Reutens DC, Yang Z. Towards higher sensitivity and stability of axon diameter estimation with diffusion-weighted MRI. NMR Biomed. 2016;29(3):293-308. doi:10.1002/nbm.3462
17. Alexander DC, Hubbard PL, Hall MG, et al. Orientationally invariant indices of axon diameter and density from diffusion MRI. NeuroImage. 2010;52(4):1374-1389. doi:10.1016/j.neuroimage.2010.05.043
18. Wang Y, Sun P, Wang Q, et al. Differentiation and quantification of inflammation, demyelination and axon injury or loss in multiple sclerosis. Brain. 2015;138(5):1223-1238. doi:10.1093/brain/awv046
19. Oshio K, Feinberg DA. GRASE (Gradient- and spin-echo) imaging: a novel fast MRI technique. Magn Reson Med. 1991;20(2):344-349. doi:10.1002/mrm.1910200219
20. Wang Y, Wang Q, Haldar JP, et al. Quantification of increased cellularity during inflammatory demyelination. Brain J Neurol. 2011;134(Pt 12):3590-3601. doi:10.1093/brain/awr307
21. Jenkinson M, Beckmann CF, Behrens TEJ, Woolrich MW, Smith SM. FSL. NeuroImage. 2012;62(2):782-790. doi:10.1016/j.neuroimage.2011.09.015
22. Daducci A, Canales-Rodríguez EJ, Zhang H, Dyrby TB, Alexander DC, Thiran JP. Accelerated Microstructure Imaging via Convex Optimization (AMICO) from diffusion MRI data. NeuroImage. 2015;105:32-44. doi:10.1016/j.neuroimage.2014.10.026
23. Johnson D, Ricciardi A, Brownlee W, et al. Comparison of Neurite Orientation Dispersion and Density Imaging and Two-Compartment Spherical Mean Technique Parameter Maps in Multiple Sclerosis. Front Neurol. 2021;12:662855. doi:10.3389/fneur.2021.662855
24. West KL, Kelm ND, Carson RP, Alexander DC, Gochberg DF, Does MD. Experimental studies of g-ratio MRI in ex vivo mouse brain. NeuroImage. 2018;167:366-371. doi:10.1016/j.neuroimage.2017.11.064
25. McAusland J, Tam RC, Wong E, Riddehough A, Li DKB. Optimizing the use of radiologist seed points for improved multiple sclerosis lesion segmentation. IEEE Trans Biomed Eng. 2010;57(11). doi:10.1109/TBME.2010.2055865
26. Zhang Y, Brady M, Smith S. Segmentation of brain MR images through a hidden Markov random field model and the expectation-maximization algorithm. IEEE Trans Med Imaging. 2001;20(1):45-57. doi:10.1109/42.906424
27. DeLuca GC, Ebers GC, Esiri MM. Axonal loss in multiple sclerosis: a pathological survey of the corticospinal and sensory tracts. Brain. 2004;127(5):1009-1018. doi:10.1093/brain/awh118Figures
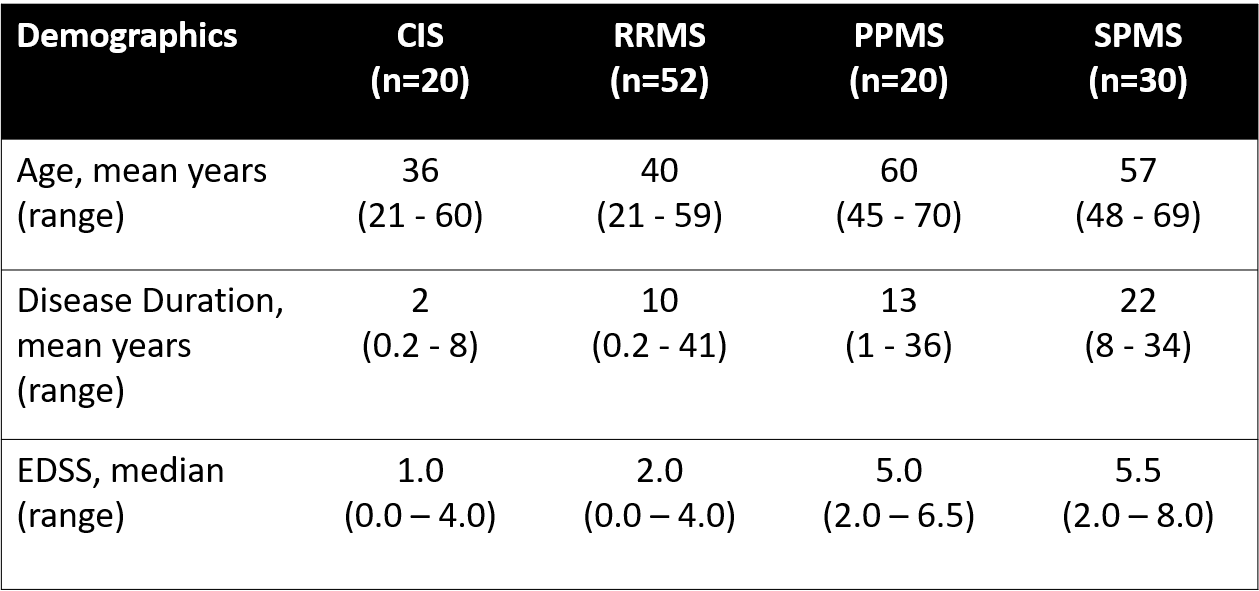
Figure 1: Demographic information of participants. (CIS: clinically isolated syndrome; EDSS: expanded disability status scale; PPMS: primary progressive multiple sclerosis (MS); RRMS: relapsing remitting MS; SPMS: secondary progressive MS)
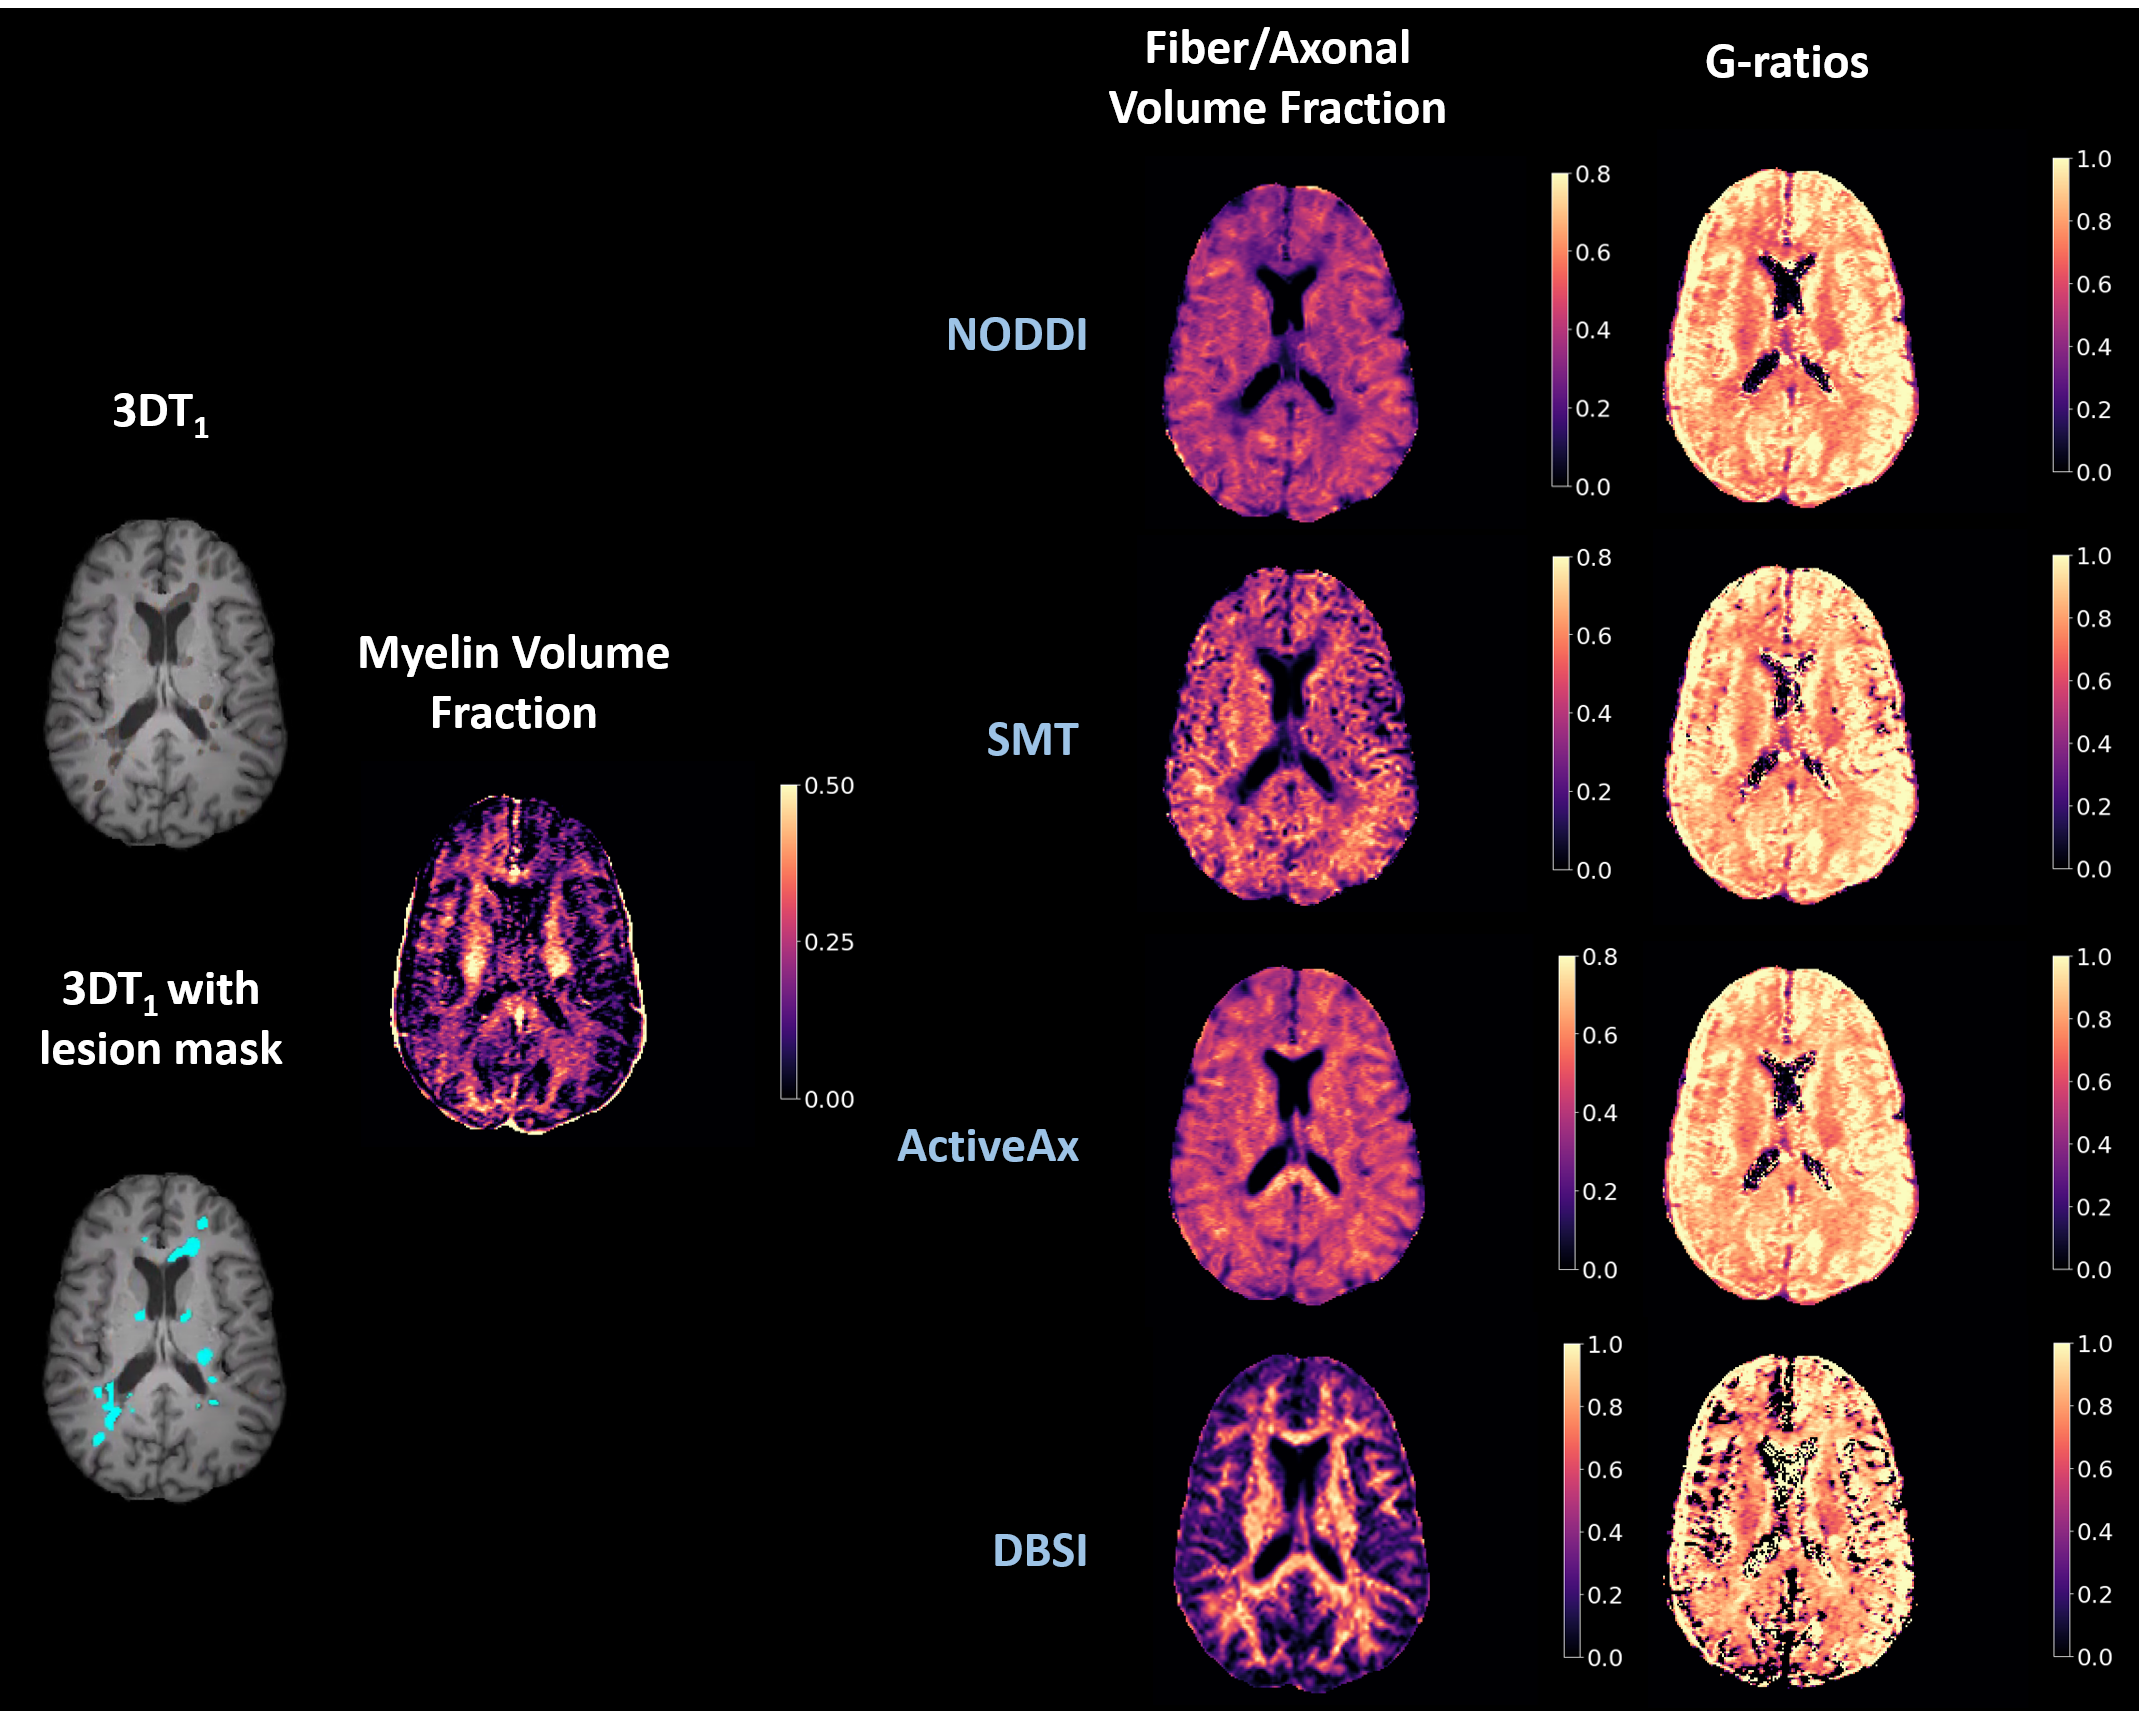
Figure 2: Representative slice of 3DT1 structural scan, 3DT1 structural scan with lesion mask overlaid, myelin volume fraction, fiber/axonal volume fraction, and g-ratios maps for an MS patient. (DBSI: Diffusion Basis Spectrum Imaging, NODDI: Neurite Density Index, SMT: Spherical Mean Technique)
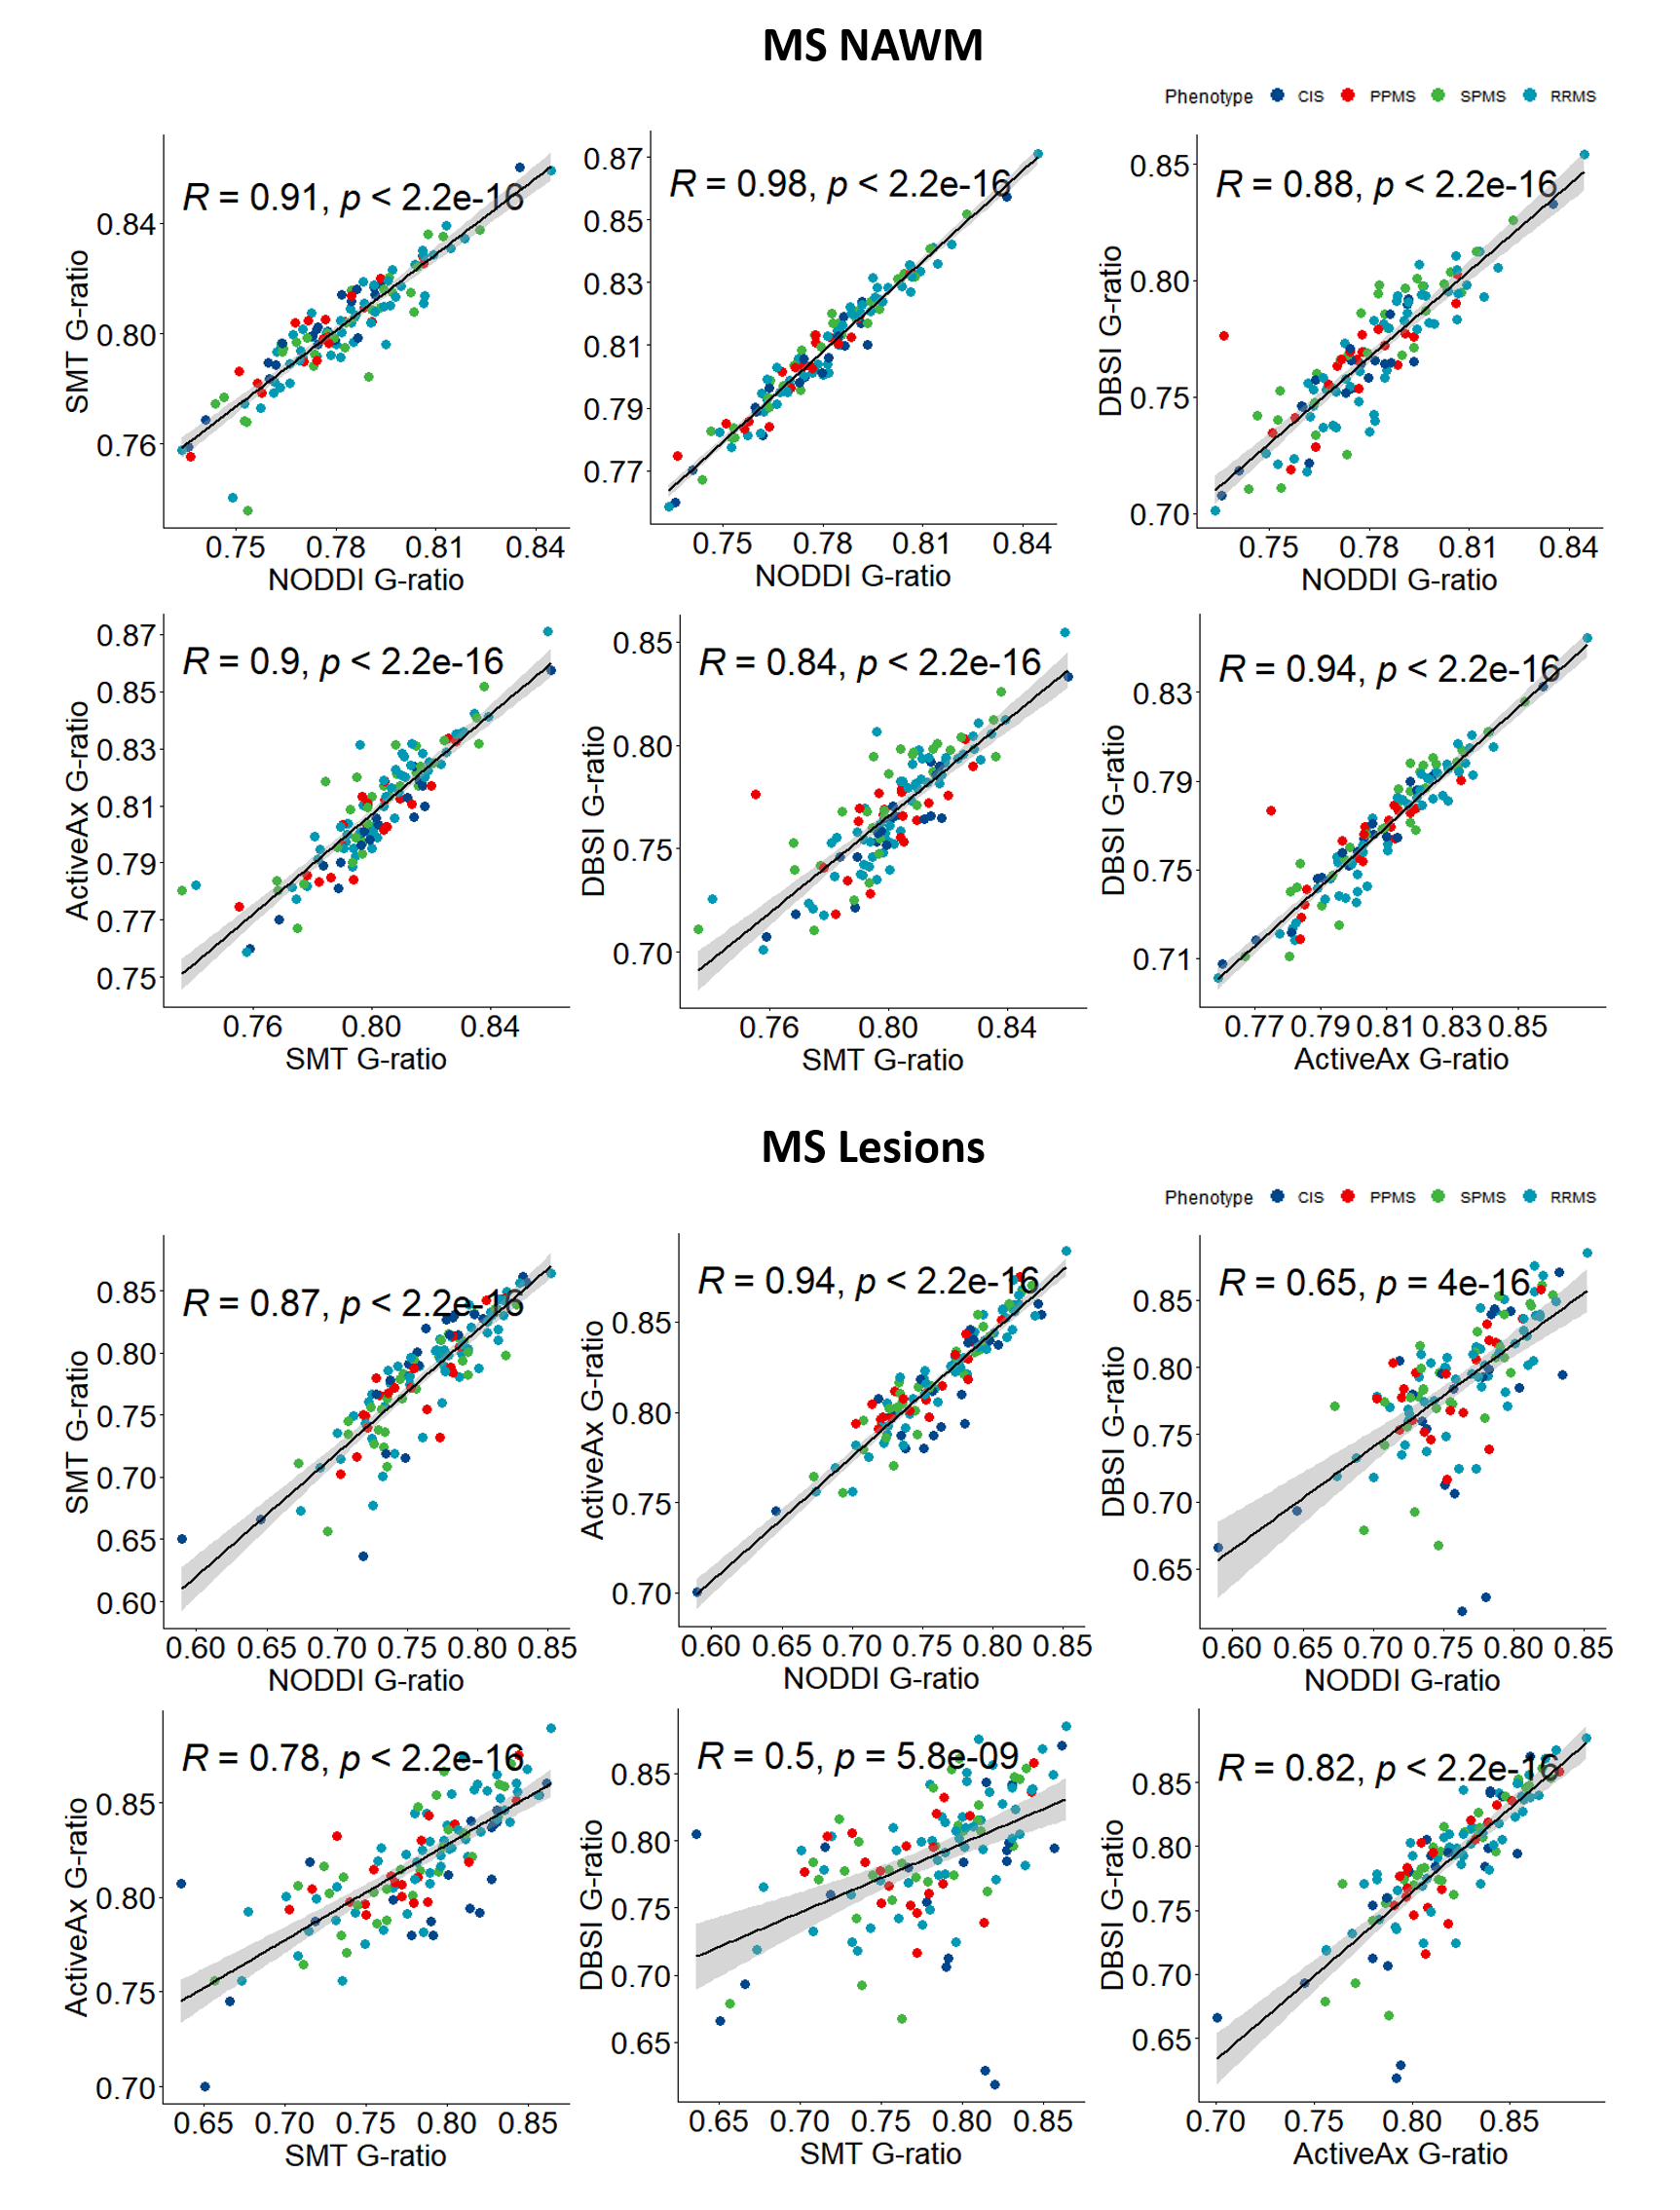
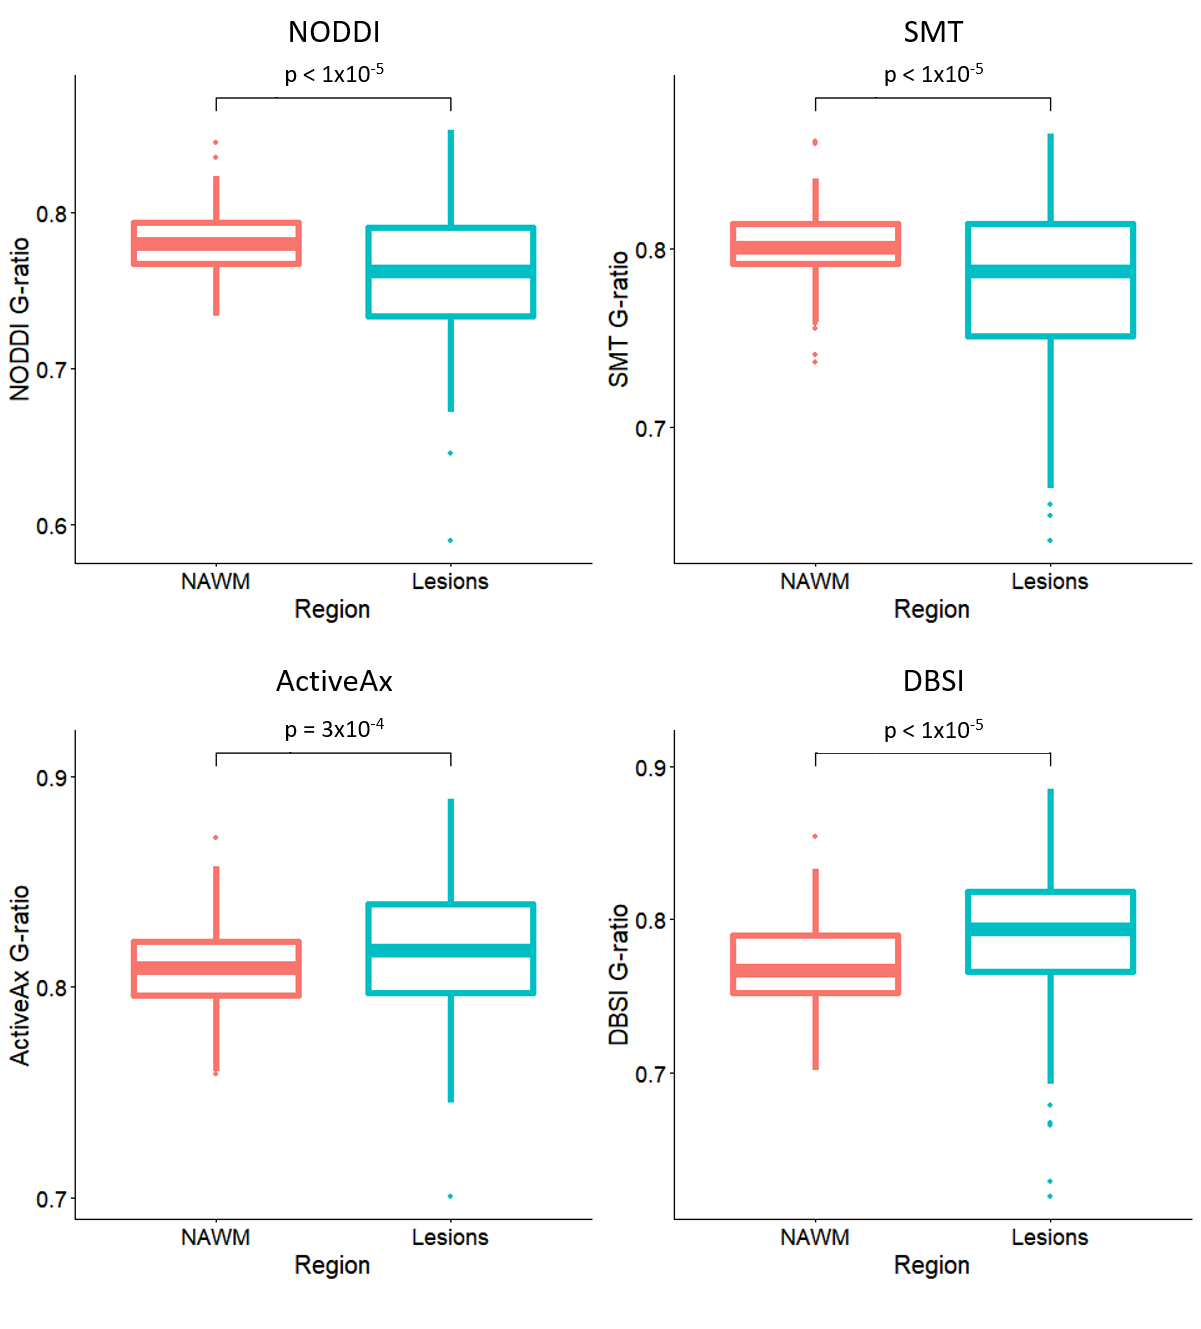
Figure 4: Box plots between g-ratios in normal appearing white matter (NAWM) and lesions in different analysis methods for all MS. (NODDI: Neurite Density Index, DBSI: Diffusion Basis Spectrum Imaging, SMT: Spherical Mean Technique)