4478
Estimating brain tissue stiffness from cardiac-induced 7T MRI displacement measurements1UMC Utrecht, Utrecht, Netherlands, 2University of Sherbrooke, Sherbrooke, QC, Canada
Synopsis
Keywords: Image Reconstruction, Brain, Shear Stiffness, Tissue properties, Elastography, DENSE, 7T MRI
Mechanical properties of the human brain can be altered by a variety of pathologies. These properties can be estimated from in vivo MRI measurements of brain tissue displacements as induced by the heartbeat. Previously obtained 7T MRI displacements measurements were used to reconstruct stiffness parameters using a subzone-based non-linear inversion scheme. Various structures of the brain can be observed in the reconstructed parameter distributions, and the results show good test-retest reliability. The preliminary results show promise of this approach to yield non-invasive assessment of brain tissue microstructure as a tool to investigate brain disease.Introduction
A variety of pathologies can alter the microstructure of human brain tissue. In general, changes in human tissue can be quantified using Magnetic Resonance Elastography (MRE), where harmonic steady-state mechanical waves are induced at a region of interest. The resulting tissue displacements can then be measured using phase-contrast MRI, and the measurements can be used to reconstruct mechanical properties of the tissue. However, the brain is enveloped in cerebral meninges and the cranium, which dampen extrinsically applied vibrations. Additionally, the porous nature of the brain results in it having a frequency dependent response, causing such vibrations to affect the brain stiffness1. Alternatively, mechanical properties of the brain can be estimated from in vivo MRI measurements of brain tissue deformation as induced by the heartbeat2.3. Recently, the quality of these deformation measurements was improved significantly using ultrahigh field (7T) MRI4. The purpose of this project is to reconstruct brain stiffness parameters from 7T MRI measurements of the displacements resulting from intrinsic, cardiac-induced vibrations, and to assess the test-retest reliability.Method
We used data from a previously described 7T MRI study, which used Displacement Encoding with Stimulated Echoes (DENSE)4. The data consisted of 3D displacement measurements (1.95x1.95x2.2 mm resolution), time-resolved over the cardiac cycle (20 cardiac phases), for eight subjects, including a repeated scan after repositioning of the subject. Stiffness parameters were then reconstructed at the first harmonic frequency (approximately 1 Hz) by applying a 3D subzone-based non-linear inversion (NLI) scheme5. A viscoelastic model of the brain was used, yielding the complex parameters shear modulus $$$G^*=G'+G'$$$' with $$$G'$$$ being the storage modulus and $$$G''$$$ the loss modulus, and damping ratio $$$\xi$$$ as stiffness parameters of interest. In this model for low frequencies, only relative distributions of the stiffness parameters can be recovered as the inertial forces produced by cardiac pulse are negligible compared to the elastic forces of the brain6. This results in the reconstructed parameters having non-unique solutions. Finally, the shear stiffness $$$\mu$$$ can be calculated from the storage and loss modulus as $$\mu = \frac{2|G^*|^2}{G'+|G^*|}$$ and the damping ratio as $$$\xi=G''/2G'$$$.Results
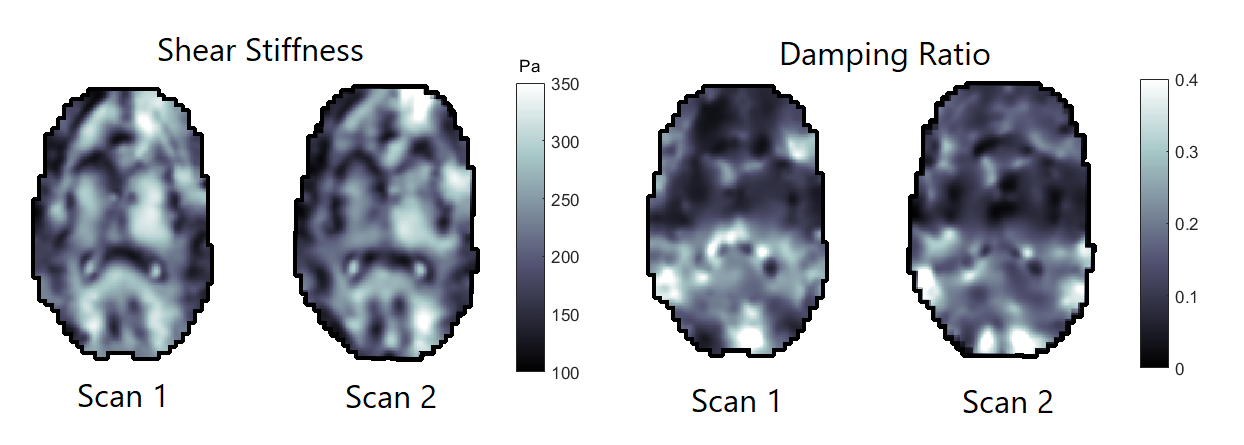
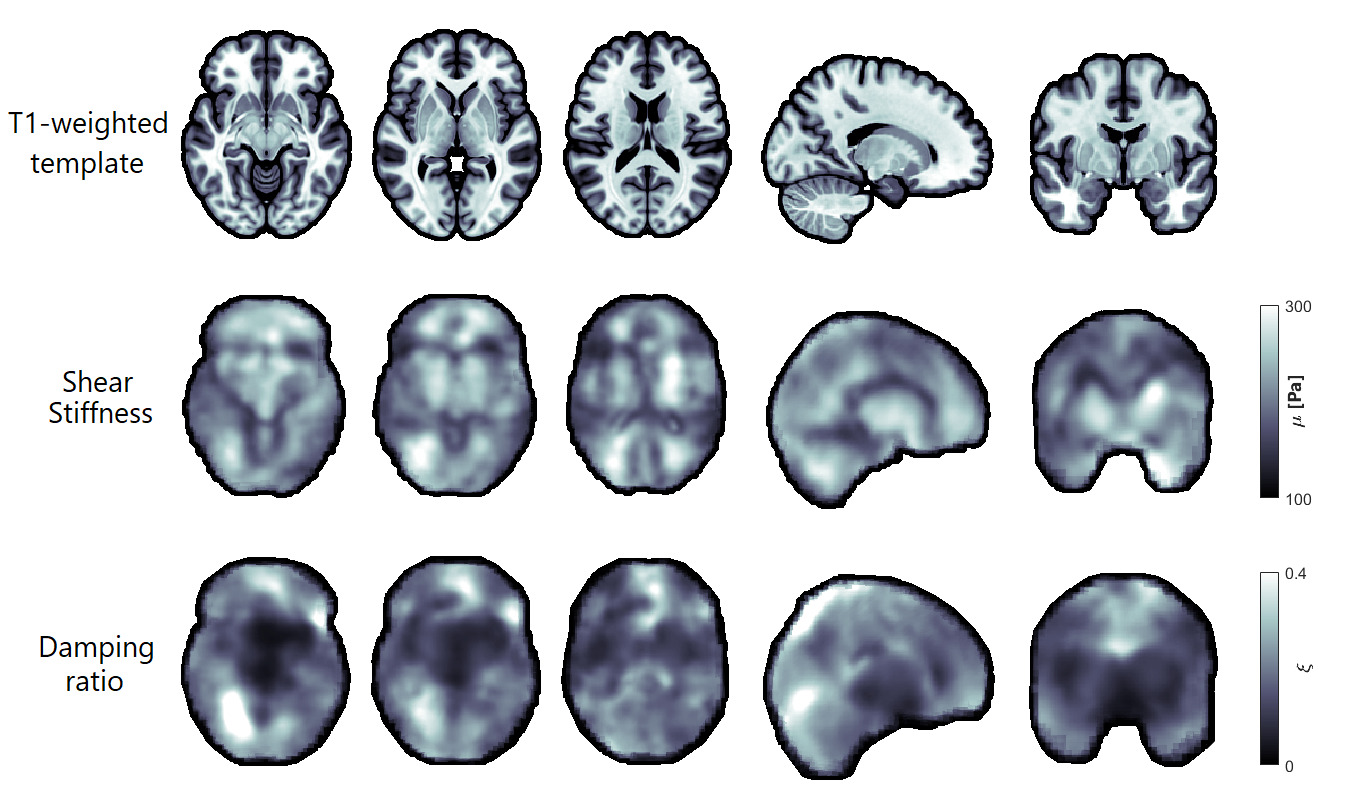
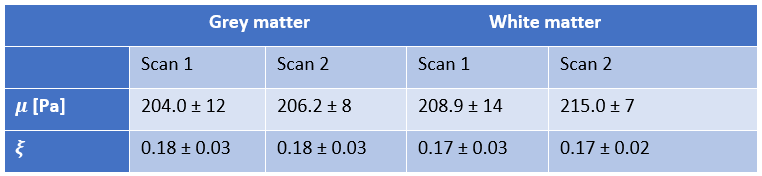
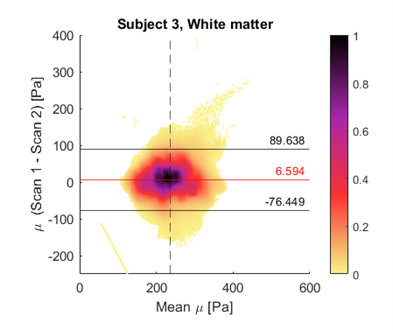
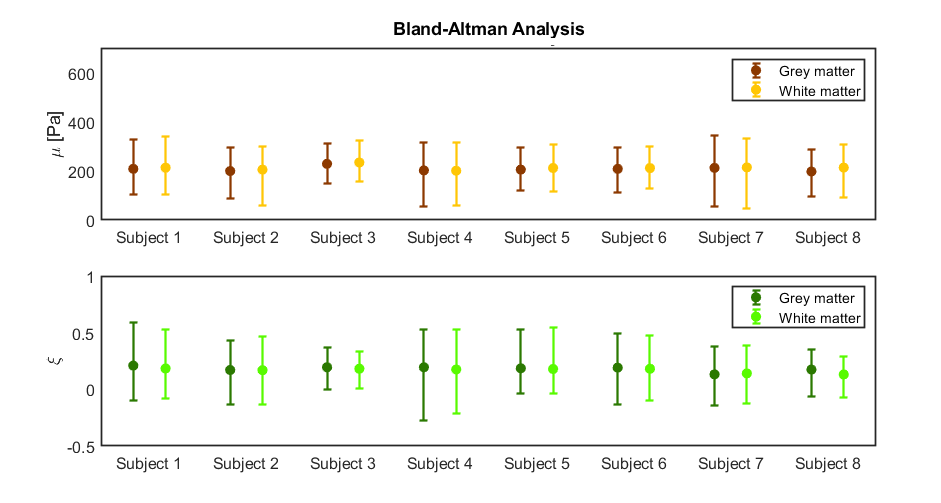
Figure 1 shows representative axial slices for each stiffness parameter along with repeat scans that have been registered to the original scans. Figure 2 shows the mean over all subjects and repeats for each stiffness parameter, where the distributions have been registered to the MNI-ICBM2009c brain atlas7. Table 1 shows the mean and standard deviation for each stiffness parameter, separated for the grey and white matter and the repeat scans. A paired t-test shows that the gray and white matter distributions are not significantly different for any stiffness parameter. Figure 3 shows an example plot of a Bland-Altman analysis for one subject. Figure 4 shows a summarized repeatability analysis for each subject and stiffness parameter, separated for the grey and white matter. Each error bar represents a summarized Bland-Altman plot where the dot represents the mean of the two scans and the whiskers represent the limits of agreements.Discussion
The mean distributions in Figure 1 shows a lot of structural features of the brain. In particular, the shear stiffness shows good agreement with the T1-weighted templates in each of the shown slices. This is also reflected in Figure 2, where again many features of the brain can be seen. Additionally, the repeat scans show very good agreement with the original scans, adding confidence to the repeatability. In some places along the periphery of the brain, bright areas of large values can be seen. Such “hotspots” are likely artifacts that arise due to the large quantity of cerebrospinal fluid (CSF) that exists along the boundary of the brain which moves significantly faster than the surrounding tissue, giving artifact-like values during the acquisition. Work is ongoing to mask such voxels but is not yet implemented for these results. The stiffness parameter distributions show very similar values in both scans for all parameters, as shown in Table 1. The grey and white matter also exhibit similar stiffness parameter, with white matter being only slightly stiffer on average. This is again reflected in Figure 3, where the same pattern is observed in all subjects. The comparative length of the two whiskers in an error bar captures the difference between the two scans. Some slight bias can be seen in some measurements, although this is likely predominantly an effect of the previously described hotspots as they appear sporadically between repeat scans. The non-uniqueness of the viscoelastic solution at low frequencies renders only comparative values of interest in this analysis. Future work aims to perform a regional analysis, as well as to integrate a poroelastic brain model in the NLI reconstruction scheme, which is shown to produce unique solutions even at low frequencies6.Conclusion
In conclusion, 7T MRI measurements of cardiac-induced brain tissue deformation consistently allow for non-invasive estimation of brain stiffness, with good test-retest repeatability. Stiffness parameter distributions of the brain were reconstructed where the grey and white matter exhibit similar values. This method may be valuable for studying the effects of brain disease on tissue microstructure. Further optimization of the NLI reconstruction is still necessary, including testing a poroelastic model.Acknowledgements
This research was supported by Vici Grant #18674 from the Netherlands Organization for Scientific Research (NWO).References
1.
Testu J et al. Viscoelastic power law parameters of in vivo human brain estimated by MR Elastography, J Mech Behav Biomed Mater. 2017;74:333-341
2. Zorgani A. et al. Brain palpation from physiological vibrations using
MRI, PNAS, 2015;112(42):12917-21.
3. Weaver J. et al. Brain mechanical
property measurement using MRE with intrinsic activation, PMB,
2012;57(22):7275-87.
4. Adams A. et al. Validating faster
DENSE measurements of cardiac-induced brain tissue expansion as a potential
tool for investigating cerebral microvascular pulsations, Neuroimage, 2020;208:116466.
5. Van Houten E.E.W. et al. Three-dimensional subzone-based reconstruction
algorithm for MR elastogaphy, Magn
Reson Med. 2001;45(5):827-37.
6. McGarry M. et al. Uniqueness of poroelastic and viscoelastic nonlinear
inversion MR elastography at low frequencies, PMB, 2019;64(7):075006.
7. Manera, A. L., et al. CerebrA, registration and manual label correction of
Mindboggle-101 atlas for MNI-ICBM152 template, Scientific Data, 7(1),
1-9.
Figures