4477
Investigating changes in brain lactate compartmentation using diffusion-weighted MRS in APP/PS1 mice1Université Paris-Saclay, CEA, CNRS, MIRCen, Laboratoire des Maladies Neurodégénératives, Fontenay-aux-Roses, France
Synopsis
Keywords: Diffusion/other diffusion imaging techniques, Microstructure
Diffusion-weighted MR spectroscopy yields information about the microstructure of the environment where brain metabolites are diffusing. Here, we measure the diffusion of two purely intracellular metabolites (astrocytic myo-inositol and neuronal N-acetyl aspartate) and of lactate, which is also present in the extracellular space, in the cortex of 12-month-old APP/PS1 and control mice. While astrocytic and neuronal microstructures appear unchanged in APP/PS1 mice, lactate diffusion appears slower. Modeling DW-signals suggests decreased extracellular lactate fraction.Introduction
Diffusion-weighted MR spectroscopy (DW-MRS) allows characterizing metabolite diffusion properties in the brain and may thus yield information about the microstructural environment in which these metabolites are diffusing1. Therefore, it can be possible to obtain cell-specific microstructural information by measuring the diffusion of neuron-specific metabolites such as N-acetylaspartate2 (NAA) and of astrocyte-specific metabolites such as myo-inositol3 (Ins). Since lactate is present in astrocytes, neurons, and in the extracellular space4, its diffusion properties are expected to reflect specific signatures of intra-neuronal, intra-astrocytic, and extracellular diffusion, in proportions directly reflecting the fraction of lactate in each of these compartments.The goal of this work is to evaluate the ability of DW-MRS to non-invasively capture variations of lactate compartmentation, in the APP/PS1 mouse model of Alzheimer’s disease (which exhibits features such as the accumulation of amyloid plaques in the brain extracellular space5, decreased levels of NAA and increased levels of taurine6 and lactate7). We use an optimized DW-MRS sequence with polychromatic refocusing pulses to measure DW-signal attenuation of lactate with increased precision8, as well as NAA and Ins diffusion. Data modeling is performed to tentatively explain the origins of potential variations of lactate diffusion.
Methods
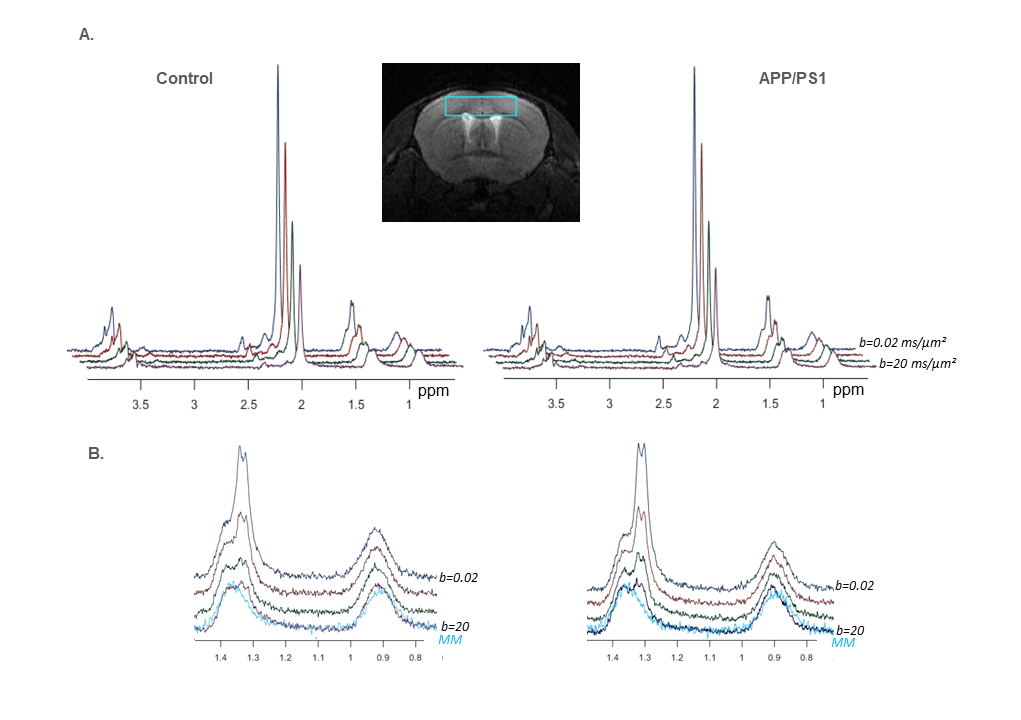
Six heterozygous APP/PS1 mice and six WT littermates anesthetized with ~1% isoflurane were scanned on an 11.7 T Bruker system with a quadrature surface cryoprobe in a 15 µL cortical voxel. DW-MRS measurements were acquired using a home-made polychromatic SE-LASER sequence8 which consists of a polychromatic echo pulse targeting NAA, myo-inositol, lactate at 1.31 ppm, and macromolecule (MM) at 0.9 ppm, surrounded by a pair of diffusion gradients (δ/Δ = 3.1/53.2 ms); followed by a LASER localization block (yielding a total TE of 83.4 ms). Acquisitions were performed at four different diffusion-weighting values (b = 0.02, 3.02, 10 and 20 ms/µm², TR = 2000 ms, 256 repetitions in total for each b). Importantly, b-values were acquired in an interlaced manner, i.e. the b-value was changed for each repetition. Furthermore, to avoid bias due to potential diffusion anisotropy in the voxel, powder averaging was performed, i.e. diffusion gradient orientation was modified for each cycle of b-values to uniformly cover the surface of a sphere.Spectra were processed with Matlab and analyzed with LCModel9. Note that experimental MM spectra were acquired (using double-inversion-recovery and b = 10 ms/µm²) for inclusion in LCModel basis sets (fig.1).
Results and discussion
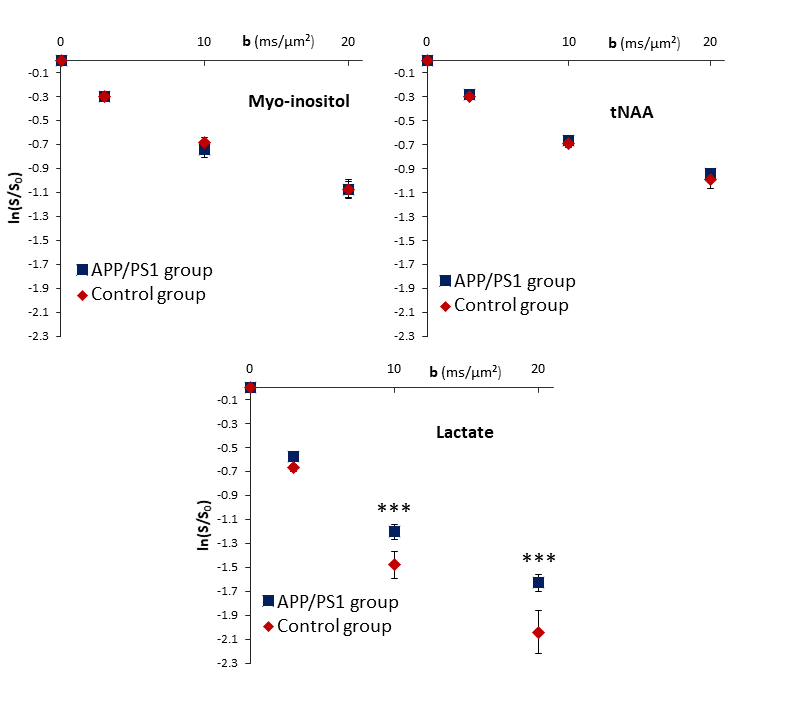
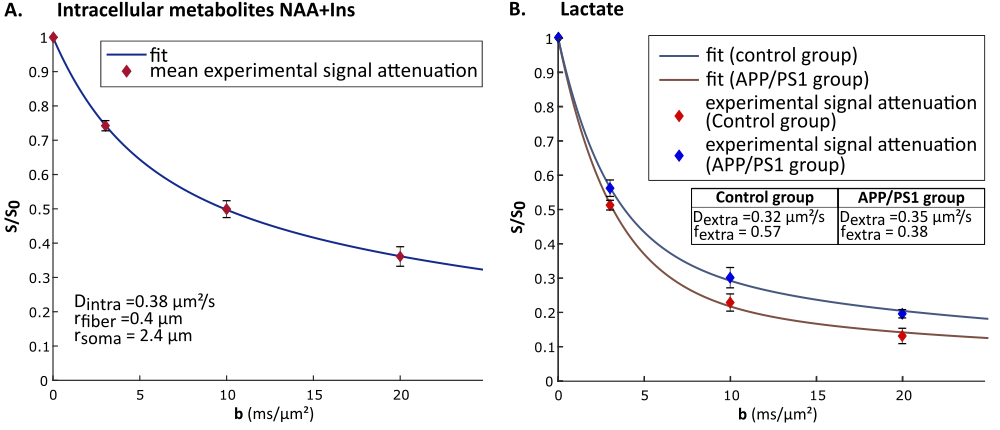
Group-averaged DW-spectra are shown in fig.1A. No difference between groups was observed for MM spectra, so that they were pooled to increase SNR. Lactate peak at 1.31 ppm remains clearly visible even at the largest b-value, and visually appears to decrease slightly faster in the control group (fig.1B). Averaged signal attenuations are shown in fig.2. Overall, while Ins and NAA signal attenuations remain very close in both groups, lactate signal is significantly less attenuated in APP/PS1 (Student’s t-tests, p<0.01). This suggests that, because astrocytic and neuronal microstructures remain globally unchanged in APP/PS1 mice (i.e., when averaged across the voxel), slower lactate diffusion might be due to either a smaller fraction of extracellular lactate (since diffusion occurs faster in ECS10), or to hindered diffusion in the extracellular space due to the presence of amyloid aggregates. Interestingly, the overall lactate concentration as assessed without diffusion-weighting was similar in both groups.DW-signals of NAA and Ins were modeled to estimate cell microstructure and then predict lactate diffusion in intracellular space, using a sphere+cylinder model11. In this work, tNAA and Ins signals in both groups appear too similar to differentiate astrocytic and neuronal diffusion in both groups; therefore we decided to average the four intracellular DW-signals (tNAA and Ins in both groups) to extract some average cell microstructure parameters and average NAA/Ins intracellular diffusivity (fig.3A.). DW-signal of lactate was then fitted in each group using a two-compartment model (intra and extracellular space), assuming Gaussian diffusion in the extracellular space and letting extracellular fraction fextra and extracellular diffusivity Dextra as free parameters (fig 3B). Modeling yields relatively unaltered Dextra, but quite lower fextra in the APP/PS1 group.
Ultimately, lower extracellular lactate fraction might be due either to decreased extracellular volume fraction, or to decreased lactate concentration in the extracellular space. To help decipher which hypothesis is most likely to explain this variation, measurements of lactate concentration in the extracellular space using implanted enzyme-electrodes12 are currently underway.
Conclusion
DW-MRS could successfully detect variations of lactate diffusion in a mouse model of neurodegenerative disease (APP/PS1). Modeling suggests that such variations were due to decreased extracellular lactate fraction. While the ultimate cause for such decreased fraction remains to be elucidated, e.g. using invasive reference techniques such as enzyme-electrodes, we believe that enhancing DW-MRS data, e.g. with double diffusion encoding13, may provide richer information14 leading to more robust modeling of lactate compartmentation, which for now remains quite fragile.Acknowledgements
This project has received funding from the European Research Council (ERC) under the European Union’s Horizon 2020 research and innovation programs (grant agreement n° 818266).
11.7 T scanner was funded by NeurATRIS (“Investissements d'Avenir”, ANR-11-INBS-0011).
References
1. Palombo M, Shemesh N, Ronen I, Valette J. Insights into brain microstructure from in vivo DW-MRS. Neuroimage. 2018; 182:97-116.
2. Simmons ML, Frondoza CG, Coyle JT. Immunocytochemical localization of N-acetyl-aspartate with monoclonal antibodies. Neuroscience. 1991; 45(1):37-45.
3. Choi JK, Dedeoglu A, Jenkins BG. Application of MRS to mouse models of neurodegenerative illness. NMR Biomed. 2007 (3):216-37.
4. Mächler, P., Wyss, M. T., Elsayed, et al. In Vivo Evidence for a Lactate Gradient from Astrocytes to Neurons. Cell Metabolism, 2016, 23(1), 94–102.
5. Garcia-Alloza, M., Robbins, E., Zhang-Nunes, S., et al. Characterization of amyloid deposition in the APPswe/PS1dE9 mouse model of Alzheimer disease, Neurobiology of Disease, 2006, 24, 3:516-524.
6. Sabbagh JJ, Kinney JW, Cummings JL. Alzheimer's disease biomarkers in animal models: closing the translational gap. Am J Neurodegener Dis. 2013; 2(2):108-20.
7. Newington JT, Harris RA, Cumming RC. Reevaluating Metabolism in Alzheimer's Disease from the Perspective of the Astrocyte-Neuron Lactate Shuttle Model. J Neurodegener Dis., 2013; 2013:234572.
8. Mougel E, Malaquin S, Vincent M, Valette J. Using spectrally-selective radiofrequency pulses to enhance lactate signal for diffusion-weighted MRS measurements in vivo. J Magn Reson. 2022; 334:107113.
9. Provencher, SW. Estimation of metabolite concentrations from localized in vivo proton NMR spectra. Magn Reson Med., 1993, 30:672–679
10. Vincent M, Gaudin M, Lucas-Torres C, Wong A, Escartin C, Valette J. Characterizing extracellular diffusion properties using diffusion-weighted MRS of sucrose injected in mouse brain. NMR Biomed. 2021;34(4):e4478.
11. Malaquin, S. & Valette, J. How modeling lactate diffusion may inform on its cellular compartmentation? An initial study. Proc. Intl. Soc. Mag. Reson. Med. 2022, 30, 1508.
12. Rathee K, Dhull V, Dhull R, Singh S. Biosensors based on electrochemical lactate detection: A comprehensive review. Biochem Biophys Rep. 2015; 5:35-54.
13. Shemesh, N., Özarslan, E., Komlosh, et al. From single-pulsed field gradient to double-pulsed field gradient MR: gleaning new microstructural information and developing new forms of contrast in MRI. NMR Biomed. 2010, 23: 757-780.
14. Vincent, M., Palombo, M., & Valette, J. Revisiting double diffusion encoding MRS in the mouse brain at 11.7T: Which microstructural features are we sensitive to? NeuroImage, 2020, 207:116399.
Figures