4474
Cardiac magnetic resonance T2 mapping for evaluating the degree of myocardial edema in patients with chronic kidney disease1The First Affiliated Hospital of Dalian Medical University, Dalian, China
Synopsis
Keywords: Heart, Kidney
T2 mapping is used to assess the degree of myocardial damage in CKD patients, and T2 values increase as the glomerular filtration rate decreases in CKD patients.Introduction
Patients with chronic kidney disease (CKD) have high-load left ventricle (LV) structural abnormalities, which are characterized by LV hypertrophy, diffuse interstitial fibrosis and capillary sparing.1 Cardiovascular magnetic resonance (CMR) myocardial T2 mapping allows for quantitative tissue characterization and non-invasive direct measurement of pathological myocardium. T2 mapping is water-specific, indicating excess myocardial fluid, such as edema, injury, and/or inflammation.2 We aim to evaluate the changes in myocardial edema during different processes in CKD patients using the T2 mapping technique.Methods
We prospectively recruited 44 CKD patients who estimated glomerular filtration rate (eGFR) < 59 ml/min/1.73 m2. All participants with CMR scans were performed on a 3.0T MRI scanner (Philips Ingenia, Philips Healthcare, Cleveland, Ohio, USA) for the acquisition of myocardial T2 mapping. T2 mapping (GradientRecalled And Spin Echo sequences) was performed at identical mid short-axis levels. Typical T2 acquisition parameters: ECG triggered, flip angle 90°, voxel size s 2×2×10 mm, slice thickness 10 mm. Motion correction and fitting were performed to estimate coefficients of the decay function, which were then used to estimate T2 times. Commercially available dedicated software CVI42 (version 5.14, Circle Cardiovascular Imaging Inc., Calgary, Canada) was used to analyze the T2 value. We classified CKD as stage 3, stage 4, and stage 5(PRIMO) according to eGFR 30-59 ml/min/1.73m2, 15-29 ml/min/1.73m2, and <15 ml/min/1.73m2. The Shapiro-Wilk test assessed the normality of the data. Analysis of variance using independent samples t-test and Mann-Whitney U test. Pearson correlation and Spearman rank correlation were used for correlation analysis.Results
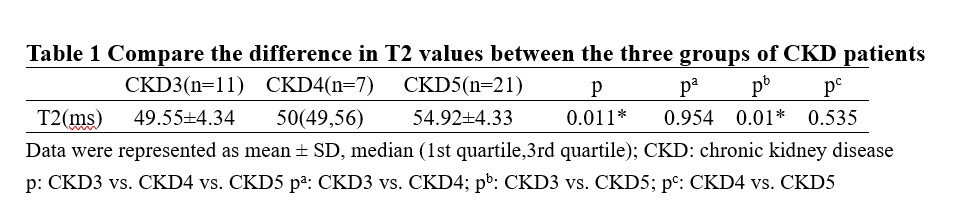
The T2 values for patients with CKD stages 3-5 were 49.55±4.34 ms; 50(49,56) ms; 54.92±4.33 ms shown (Table1). T2 values significantly increase (r=-0.349) as progressive CKD severity. A significant difference in T2 values between CKD stages 3 and 5.Discussion
T2 mapping values are negatively correlated with eGFR levels in CKD patients, which also related to myocardial edema.3 Myocardial edema exacerbates pathophysiological changes in the heart, including left ventricular hypertrophy (LVH), leading to systolic and diastolic dysfunction. 1 T2 mapping technique as a non-invasive method to assess the impact of disease severity on the myocardium in patients with CKD and to provide guidance for clinical management.Conclusion
Myocardial T2 time increased with progressive CKD severity, which can help assess the association between the CKD disease process and myocardial edema.Acknowledgements
No acknowledgement found.References
1. Kaesler N, Babler A, Floege J, Kramann R. Cardiac Remodeling in Chronic Kidney Disease. Toxins (Basel). 2020 Mar 5;12(3):161
2. Arcari L, Engel J, Freiwald T, Zhou H, Zainal H, Gawor M, Buettner S, Geiger H, Hauser I, Nagel E, Puntmann VO. Cardiac biomarkers in chronic kidney disease are independently associated with myocardial edema and diffuse fibrosis by cardiovascular magnetic resonance. J Cardiovasc Magn Reson. 2021 Jun 7;23(1):71.
3. Hayer MK, Radhakrishnan A, Price AM, Liu B, Baig S, Weston CJ, Biasiolli L, Ferro CJ, Townend JN, Steeds RP, Edwards NC; Birmingham Cardio-Renal Group. Defining Myocardial Abnormalities Across the Stages of Chronic Kidney Disease: A Cardiac Magnetic Resonance Imaging Study. JACC Cardiovasc Imaging. 2020 Nov;13(11):2357-2367.
Figures