4472
A priliminary evaluation of myocardialgadolinium deposition in apical hypertrophic cardiomyopathy with T1mapping
Hongzhi Yang1, shaoyu wang2, and Ruwu Yang1
1Xi dian group hospital, Xi'an, China, 2DI MR SMK, Siemens Healthineers, Shanghai, China
1Xi dian group hospital, Xi'an, China, 2DI MR SMK, Siemens Healthineers, Shanghai, China
Synopsis
Keywords: Myocardium, Cardiovascular, Gd deposition
In this study, we used the CMR T1mapping technique was to evaluate the correlation between T1R and gadolinium deposition in the myocardium of patients with apical hypertrophic cardiomyopathy after gadolinium enhancement.Introduction
Gadolinium based contrast agent (GBCA) is the most widely used MRI contrast agent in clinical practice due to its high relaxation rate. As a diagnostic drug, GBCA has a potential risk of adverse reactions. In recent years, it had reported that injection of gadolinium contrast agent will cause deposition in brain, bone, skin, kidney, heart, lungs, liver, lymph nodes and other parts , in which more attention is paid to brain gadolinium deposition and less attention is paid to myocardial gadolinium deposition. In this study, we used T1mapping technique was to evaluate the correlation between T1R and gadolinium deposition in the myocardium of patients with apical hypertrophic cardiomyopathy after gadolinium enhancement.Methods
The basic data, clinical data and cardiac MRI image data (including T1mapping) of 60 patients with apical hypertrophic cardiomyopathy from January 2010 to May 2022 were collected, and they were divided into enhanced group and non-enhanced group according to whether they were enhanced or not. All CMR studies were conducted on a 3.0 T MRI scanner (MAGNETOM Skyra, Siemens Healthcare, Erlangen, Germany) using a 18 channel body surface coils and retrospective ECG gating.T1 mapping was obtained on the short axis plane of the left ventricle at the base, middle and apex of the short axis using the modified Look-Locker inversion recovery sequence (MOLLI) . The scanning mode was 5 (3) 3 , Scanning parameters: TR 280.6 ms, TE 1.1 ms, FOV 360mmx306mm, TD 544ms, repetition times 3, bandwidth 1085 Hz/pixel. The gadolinium enhancer is glucosamine gadolinium pentoate (0.5mmol/ml Bayer), which is injected with a high-pressure syringe with a flow rate of 2.5ml/s and a dosage of 0.2-0.3mmol/kg. The T1 value of the spleen at the base, middle, apex and the same layer was measured and the T1 relative value (T1R) was calculated, and the difference in T1R before and after enhancement was compared, and the influence of various factors on the T1R in the enhanced group was analyzed.Results
Results: 1. There was no statistical difference in the T1R values of the the basal, middle and apical myocardium of left ventricle between enhanced group and non-enhanced group (t=0.33,p<0.05;t=1.08,p<0.05;t=0.62,p<0.05); 2. The enhanced group was divided into two subgroups according togender, age, Body Mass Index (BMI), cardiac function class, ejection fraction, hyperlipidemia, hypertension, diabetes, apical hypertrophy, delayed enhancement (LGE), interval time, total dose of gadolinium , and lesion changes.There were only significant differences in T1R between two enhanced groups according to gender and hypertension groups (t=2.24/2.34/2.69,p<0.05;t=2.86/2.28/2.15,p<0.05), and there was no statistical difference in T1R between two enhanced groups according to other factor groups (p>0.05). 3. The correlation analysis between T1R and age, BMI(Body Mass Index), apical hypertrophy, interval time, ejection fraction and dose of gadolinium in the enhanced group showed that only the total amount of gadolinium dose was correlated with T1R (r=0.48/0.48/0.41,p<0.05).Conclusion
With apical hypertrophic cardiomyopathy as the research object, the quantitative determination of T1 mapping showed that there was no gadolinium deposition in the myocardium of this kind of patients after several years with gadolinium injection, which strengthened the understanding of medical staff and patients on the heart safety of gadolinium contrast agent, and provided a certain theoretical reference and reference value for future research on myocardial gadolinium deposition.Acknowledgements
No acknowledgement found.References
No reference found.Figures
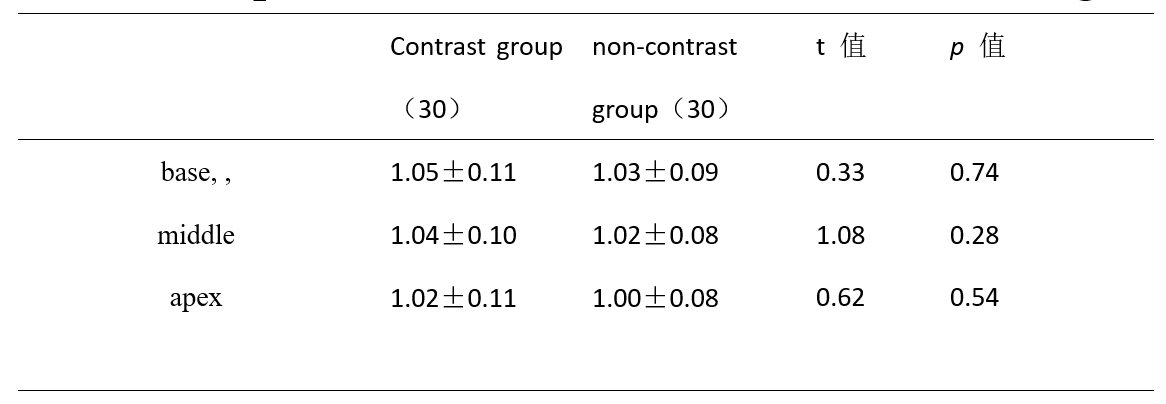
Table1: Comparison
of T1R between enhancement group and non-enhancement group
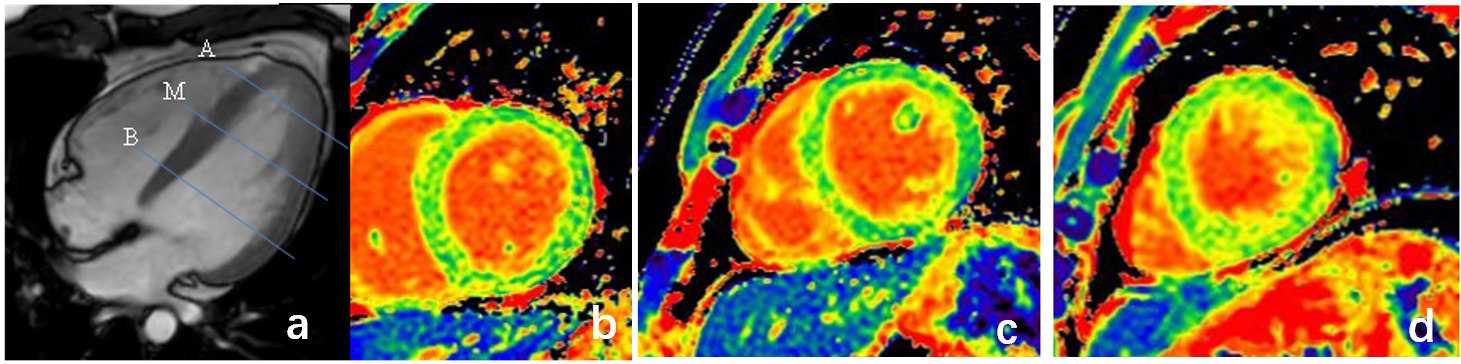
Figure1: Male, 39 years old, cardiac MRI diagnosis was early apical hypertrophic cardiomyopathy. a SSFP sequence left ventricular four chamber cardiogram at the end of diastole, apical myocardial thickening; Native T1 mapping was performed on the basal (blue line B), middle (blue line M) and apical (blue line A) planes perpendicular to the left ventricular long axis; b: Native T1 T1mapping at the basal layer of left ventricular short axis; c: Native T1mapping at the middle section of left ventricular short axis; d: T1 mapping of left ventricular short axis apical slice
DOI: https://doi.org/10.58530/2023/4472