4471
Using Magnetic Resonance Spectroscopy for Metabolomic Characterization of Blood Serum in Patients with Myocardial Fibrosis1Molecular Pathology, Massachusetts General Hospital, Boston, MA, United States, 2Charité - Berlin University of Medicine, Berlin, Germany, 3Nanjing University, Nanjing, China, 4Julius-Maximilians-University of Würzburg, Würzburg, Germany, 5Cardiovascular Research Center, Massachusetts General Hospital, Boston, MA, United States
Synopsis
Keywords: Myocardium, Spectroscopy
Myocardial fibrosis plays a key role in the pathological remodeling of the diseased heart. Yet, there is currently no routine screening method for it. The gold standard, histological examination, is highly invasive. Other alternatives are either costly (e.g. PET-CT, MRI) or subjective (echocardiography). Using HRMAS MRS, we analyzed blood samples from subjects diagnosed with common myocardial fibrosis (MF), amyloidosis (CA), or sarcoidosis (CS), plus controls. The identified regions of interest (ROI) and principal components (PC) enabled us to distinguish between diseased and not-diseased, and between the different disease groups. This may contribute to earlier diagnosis and increased success of treatment.
Introduction
Heart failure (HF) is a highly prevalent condition of great medical, social, and economic importance1. Its global mortality is estimated to be around 43.3%, and the burden of HF on healthcare expenditures in the USA alone is estimated to be around $69.8 billion by 20302,3. As such, it is crucial for optimal patient treatment to understand the pathomechanism of HF and the means to diagnose and treat it.During HF, the heart undergoes pathological cardiac remodeling that involves processes like cardiac hypertrophy and myocardial fibrosis4. The latter is shown to impact the onset and clinical outcome of HF by facilitating adverse conditions like malignant arrhythmias, systolic and diastolic dysfunction, and ventricular aneurysms4.
While diagnosing myocardial fibrosis is principally possible, it is not a common clinical routine since each diagnosing method has its own disadvantages. The gold standard, histopathological analysis of myocardial biopsies, is rarely used due to its invasive nature and the relevant false-negative rate due to sampling error5. Other techniques, like gadolinium-enhanced magnetic resonance imaging (MRI) and positron emission tomography/computerized tomography (PET/CT) of the heart, are very costly and are either not fully validated for diagnosing myocardial fibrosis (PET/CT) or have difficulties detecting certain patterns, like diffuse patterns (MRI)6. Finally, the most common diagnostic method, echocardiography, shows a low sensitivity for quantifying myocardial fibrosis6.
However, different forms of HF have been shown to have metabolomic profiles that included biomarkers of fibrosis like hydroxyproline7. At the same time, high-resolution magic angle spinning (HRMAS) magnetic resonance spectroscopy (MRS) has enhanced the diagnostic capability of MRS in evaluating blood specimens. Thus, this study aimed to evaluate the potential of HRMAS in detecting different metabolomic profiles in various cardiac diseases involving myocardial fibrosis.
Methods
The study was approved by our local IRB. The study population originated from three patient groups (+ matched controls): Myocardial fibrosis due to common causes like hypertension and coronary artery disease (MF; n = 13), due to Transthyretin cardiac amyloidosis (CA; n = 18), and due to cardiac sarcoidosis (CS; n = 12). Blood serum samples were obtained from our local biobank. In addition, the first 20 samples were used to generate three pooled quality control samples containing equal volumes of each sample. All samples were stored at -80°C. For the HRMAS MRS, the samples were thawed on ice for approximately an hour, followed by vortexing for 10 seconds. 10µL of the sample and 2.5µL of D2O were placed in the rotor. HRMAS MRS data were collected on a Bruker AVANCE III HD 600MHz instrument, at 4°C, with a spinning rate of 3.6kHz, and with a rotor-synchronized Carr-Purcell-Meiboom-Gill (CPMG) sequence. Statistical analysis involved identifying spectral regions of interest (ROI) and, for two-group comparisons, comparing the regional spectral intensities by t-test for equal/unequal variance, or Wilcoxon test, according to distribution pattern and variance. For comparison of more than two groups, one-way ANOVA, or one-way ANOVA on ranks, respectively, was performed. Additionally, principal component (PC) analyses (PCA) have been conducted. Type I errors were accounted for using the false discovery rate method (FDR). The software JMP 15.0.0 (Statistical Discovery LLC, North Carolina) was used for the statistical analyses.Results
Exemplary spectra for each disease group are shown (Fig. 1 for MF, Fig. 2 for CS, and Fig. 3 for CA). Within the MF group, 2 out of 47 ROI showed statistically significant differences between case and control. In the CS group, this was the case for 13 out of 55 identified ROIs, and in the CA group for 16 out of 59 identified ROIs. Additionally, PCA revealed 18 PCs, out of which PC1 and PC2 showed significant differences within the CS and the CA group, and PC7 within the CA group.In addition, in a comparison between all six subgroups, we analyzed 62 ROIs (Fig. 4), out of which 21 showed statistically significant differences (19 after FDR). Among the comparisons between the case groups of the different disease groups, the ROIs 5.10-5.08ppm, 3.43-3.41ppm, 3.40-3.37ppm (diamond plot shown in Fig. 5), 3.12-3.10ppm, 2.71-2.69ppm, 2.54-2.52ppm, and 2.23-2.21ppm showed the greatest intergroup variability. The comparison between the different control groups revealed no statistically significant difference for almost every analyzed ROI.
Discussion & Conclusion
This pilot study found that there are detectable metabolomic changes that allow us to distinguish individuals with fibrotic diseases of the heart from individuals without, as well as between different etiologies. The ROIs involved could be associated with altered energy, protein, and, specifically, collagen metabolism, like Carnitine, Lysine, 5-Hydroxylysine, Proline, Deoxypiridinoline, and Glycerophosphocholine. Given the minimally invasive nature of the procedure, our study indicates further research with this approach to be advisable. Particularly, the potential to distinguish CA from CS could prove to be clinically valuable, since the two entities can show overlapping findings in other diagnostics and, especially in the case of CA, the disease is often diagnosed at a late stage, leading to limited therapeutic options and poor therapy response8. Prospectively, our findings should be complemented through other analytical procedures like mass spectrometry. Studies regarding the influences of time before and after diagnosis, and cardiovascular risk factors, as well as the correlation with histopathological examinations of myocardial tissues, are underway in our laboratory.Acknowledgements
This study is supported in part by NIH grants AG070257, CA273010, and by MGH Martinos Center for Biomedical Imaging.
References
1. Savarese G, Becher PM, Lund LH, et al. Global burden of heart failure: a comprehensive and updated review of epidemiology. Cardiovasc Res. 2022;00:1-16.
2. Jones NR, Roalfe AK, Adoki I, et al. Survival of patients with chronic heart failure in the community: a systematic review and meta‐analysis. Eur J Heart Fail. 2019;21(11): 1306–1325.
3. Heidenreich PA, Albert NM, Allen LA, et al. Forecasting the impact of heart failure in the United States: a policy statement from the American Heart Association. Circ Heart Fail. 2013;6(3):606-19.
4. Azevedo PS, Polegato BF, Minicucci MF, et al. Cardiac Remodeling: Concepts, Clinical Impact, Pathophysiological Mechanisms and Pharmacologic Treatment. Arq Bras Cardiol. 2016;106(1):62-9.
5. López B, González A, Ravassa S et al. Circulating Biomarkers of Myocardial Fibrosis: The Need for Reappraisal. J Am Coll Cardiol. 2015;65(22):2449-56.
6. Karamitsos TD, Arvanitaki A, Karvounis H, et al. Myocardial Tissue Characterization and Fibrosis by Imaging. JACC Cardiovasc Imaging. 2020;13(5):1221-1234.
7. Hage C, Löfgren L, Michopoulos F, et al. Metabolomic Profile in HFpEF vs HFrEF Patients. J Card Fail. 2020;26(12):1050-1059.
8. Rubin J, Maurer MS. Cardiac Amyloidosis: Overlooked, Underappreciated, and Treatable. Annu Rev Med. 2020;71(1):203-219.
Figures
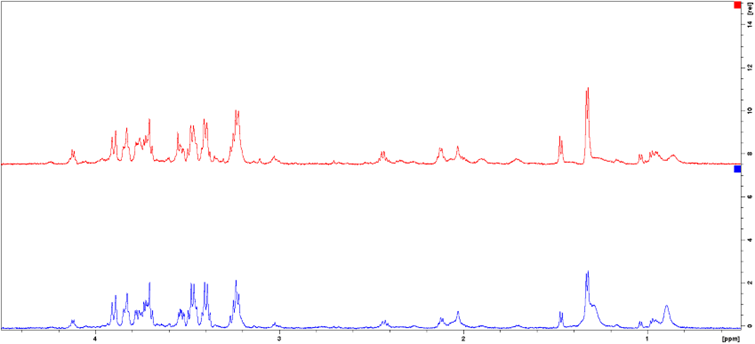
Fig. 1. Exemplary spectra of a case (blue) and control (red) from the MF group. Spectral intensities [rel] have been plotted against the chemical shift [ppm] and region 4.5-0.5ppm is shown. For better overview, the spectra are not superimposed but shown control above case.
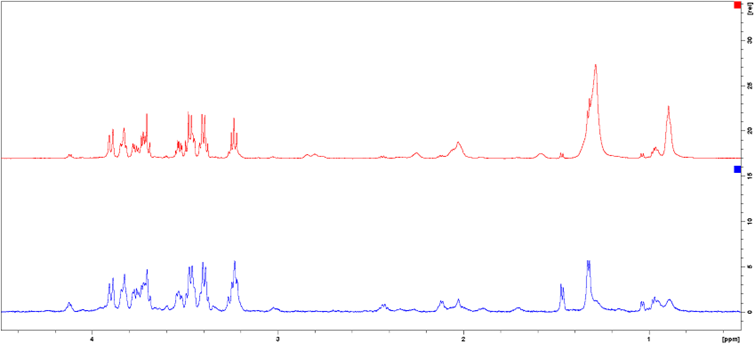
Fig. 2. Exemplary spectra of a case (blue) and control (red) from the CS group. Spectral intensities [rel] have been plotted against the chemical shift [ppm] and region 4.5-0.5ppm is shown. For better overview, the spectra are not superimposed, but shown control above case.
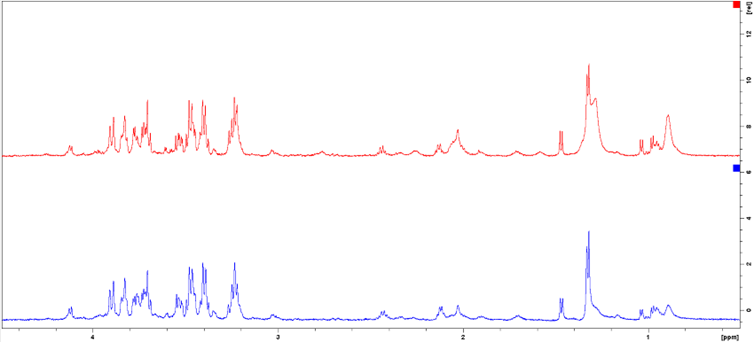
Fig. 3. Exemplary spectra of a case (blue) and control (red) from the CA group. Spectral intensities [rel] have been plotted against the chemical shift [ppm] and region 4.5-0.5ppm is shown. For better overview, the spectra are not superimposed, but shown control above case.
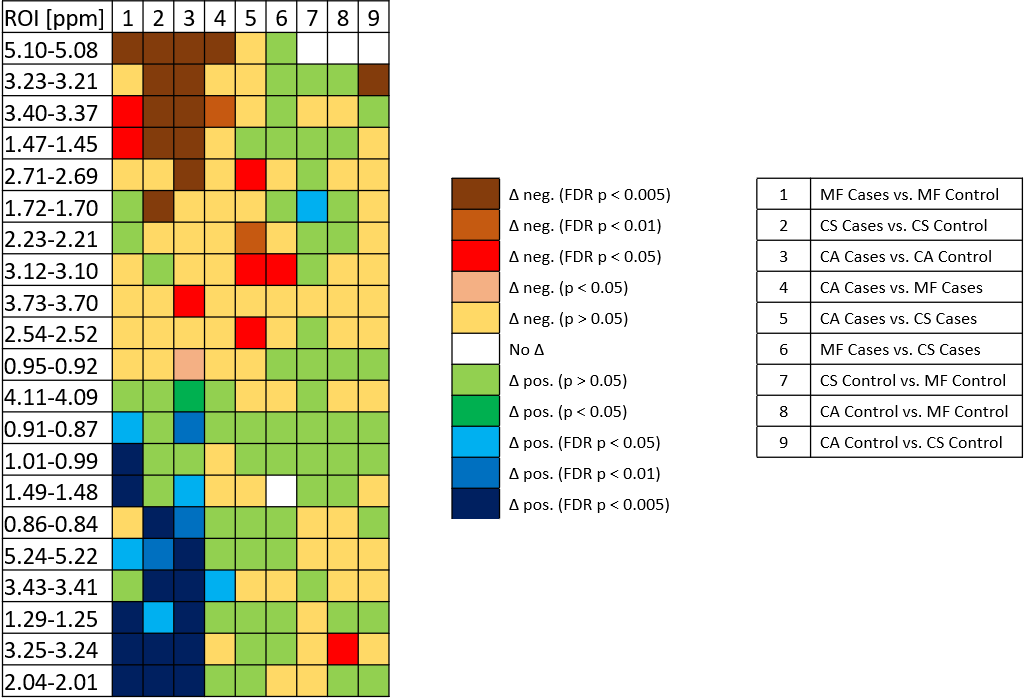
Fig. 4. Multi-group comparison of the spectral ROIs [ppm], between MF, CS, and CA, and their respective controls. Positive differences (Δ pos.), negative differences (Δ neg.), and no differences (No Δ) are shown, as well as the statistical significance of the difference (with and without FDR). The key summarizes the color coding, and which groups were compared in which column. For better overview, only those ROIs are shown, which revealed statistically significant differences between the groups.
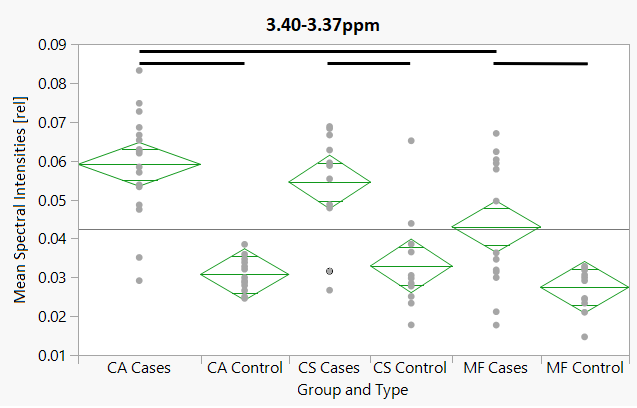
Fig 5. Diamond plot of the mean spectral intensities [rel] for the ROI 3.40-3.37ppm, plotted against all six groups. Horizontal thin black line: Grand sample mean. Horizontal line in the middle of the diamonds: group mean. Upper and Lower horizontal line: 95% confidence interval. Horizontal thick black line: statistically significant difference (p < 0.05 after FDR).