4463
Papillary Muscle Derived Radiomic Features Facilitate LVH Detection and Improve LVH Etiology Classification
Qifan Lu1, Qiming Liu1, Yezi Chai1, and Meng Jiang1
1Renji Hospital,Shanghai Jiao Tong University School of Medicine, Shanghai, China
1Renji Hospital,Shanghai Jiao Tong University School of Medicine, Shanghai, China
Synopsis
Keywords: Cardiomyopathy, Radiomics
Detecting left ventricular hypertrophy(LVH) is common in a clinical scenario, while a precise classification of LVH etiology is quite challenging. In this study, we applied radiomics methods to LVH detection and LVH etiology classification. Innovatively, we extracted radiomic features not only from the myocardium(MYO) but also includes features from the papillary muscle(PM). After strict feature selection and analysis, we found the incorporation of PM features improves our model performance compared with models that simply use MYO features.Summary of main findings
The result showed the best LVH detection accuracy of 96.7%, and an etiology accuracy of 81.3% in HCM and HHD patients.The ROC of MYO features ranged from 0.72-0.80, and the PM features ranged from 0.61-0.65. By combining PM derived features with MYO features, the average AUC value of HCM and HHD differentiation improved around 5-10 percents.Abstract
IntroductionHypertrophic cardiomyopathy (HCM) is one of the most common cardiomyopathy (prevalence around 1:500 in adults) which leads to left ventricular hypertrophy (LVH). While hypertensive heart disease (HHD) is another common LVH etiology present in long-term poor controlled or uncontrolled Hypertension patients.In both diseases, myocardium (MYO) structure change is an important diagnosis criterion, however, papillary muscle (PM) as another muscular tissue is often neglected in these two diseases. In this study, we sought to compare the performance of radiomic features derived from different anatomy structures (MYO, PM, and MYO+PM) on LVH detection and etiology differentiation.
Method
Study patients were included consecutively in our EARLY-MYO-HHD dataset (clinical trial gov. ID: NCT03278315); 168 HCM, 77 HHD, and 57 healthy control were included based on clinical diagnosis. Patients were randomly divided into 2 parts: 80% for model development and 20% for independent validation. All patients underwent cardiac magnetic resonance (CMR) examination in two 3T CM scanners (Ingenia from Philips and Prisma from SIEMENS). Short-axis cine images covering the heart from base to apex were selected. To improve the stability of extracted features, short-axis Cine images with a 7mm slice thickness and a 3mm gap between slices were collected. Other typical parameters were, Echo Time (TE) / Repetition Time (TR) / flip angle = 1.4 ms/3.0 ms/45°, typical in-plane resolution = 0.8-1.2 × 0.8-1.2 mm, number of cardiac phases = 30. The range of interest (ROI) for MYO and PM were manually depicted in itk-snap (v 3.8.0), MYO was defined as the area between epicardial and endocardial borders as previously1. For the ROI of PM, the border was manually delineated by three experienced cardiologists in accordance, examples from the classic paper were also taken as reference2. Radiomic features were extracted by Pyradiomics (v3.0.1) tool with suitable parameters. Only original features were included in this study. After feature extraction, Spearman correlation coefficient was calculated for each feature. We filtered features with correlation coefficient higher than 0.9. Left features were further selected by Least Absolute Shrinkage and Selection Operator (LASSO) model with optimized Lamda value. If more than 6 features were left after LASSO selection, 6-best features were selected for both MYO and PM using K-best method in Scikit-learn library3. Machine learning was performed using three classical classifiers: support vector machine(SVM), random forest(RF), and AdaBoost(ADA). All three classifiers were trained and tuned based on selected features and Grid Search method with training and validation datasets using a 10-fold cross-validation scheme. Best models were tested with independent datasets and compared according to classification accuracy and area under curve (AUC) value. All results were analyzed using SPSS (version 26.0) and Medcalc (version 19.0), LASSO, K-best, and machine learning classifiers used according to Scikit-learn documentation.
Results
Figure 1 showed the flowchart of this study. A total of 214 features were selected after initial extraction, including shape (n=14), first order(n=18), and texture (n=75) for both MYO and PM. After correlation coefficient calculation (Figure 2a) and LASSO method (Figure 2b and 2c), only 35 features were left (N_features MYO=18 and N_features PAPI=17 ). The final 12 were selected from the 35 features. Figure 2 showed the ROC curves for LVH detection, our results showed that radiomic features derived from MYO alone were sufficient for LVH detection (AUC: 0.97-0.98) while PM features alone only showed a ROC of 0.90-0.94, incorporation of two sets of features slightly increase 0.01 on SVM models. Figure 3 showed the ROC curves for LVH etiology differentiation. The ROC of MYO features ranged from 0.72-0.80, and the PM features ranged from 0.61-0.65, after combining two sets of features, the average AUC value improved around 5-10 percents. Table 1 showed the accuracy of LVH etiology differentiation. The MYO features classification accuracy of SVM, RF and ADA were 0.75,0.69, and 0.73 respectively, after PM features incorporation, the classification accuracy increased to 0.79, 0.81, and 0.77.
Discussion and Conclusion
Our results showed that radiomic features from PM alone are not adequate for an etiology classification task. However, the incorporation of PM features increased the AUC values significantly with AdaBoost on HCM and HHD classification. This result indicates that PM features possess huge potential for accurate categorization of LVH etiology.
Highlights
First, to our knowledge, we are the first group to focus on PM radiomics. Previous research on PM mainly focuses on PM morphology, variants, and CMR parameters. Second, our proposed methods already showed PM features could facilitate LVH-associated classification.
Acknowledgements
No acknowledgement found.References
1. Neisius, U. et al. Radiomic Analysis of Myocardial Native T1 Imaging Discriminates Between Hypertensive Heart Disease and Hypertrophic Cardiomyopathy. JACC Cardiovasc. Imaging 12, 1946–1954 (2019).
2. Bartoli, A. et al. Deep Learning–based Automated Segmentation of Left Ventricular Trabeculations and Myocardium on Cardiac MR Images: A Feasibility Study. Radiol. Artif. Intell. 3, e200021 (2021).
3. Pedregosa, F. et al. Scikit-learn: Machine Learning in Python. Mach. Learn. PYTHON 6.
Figures
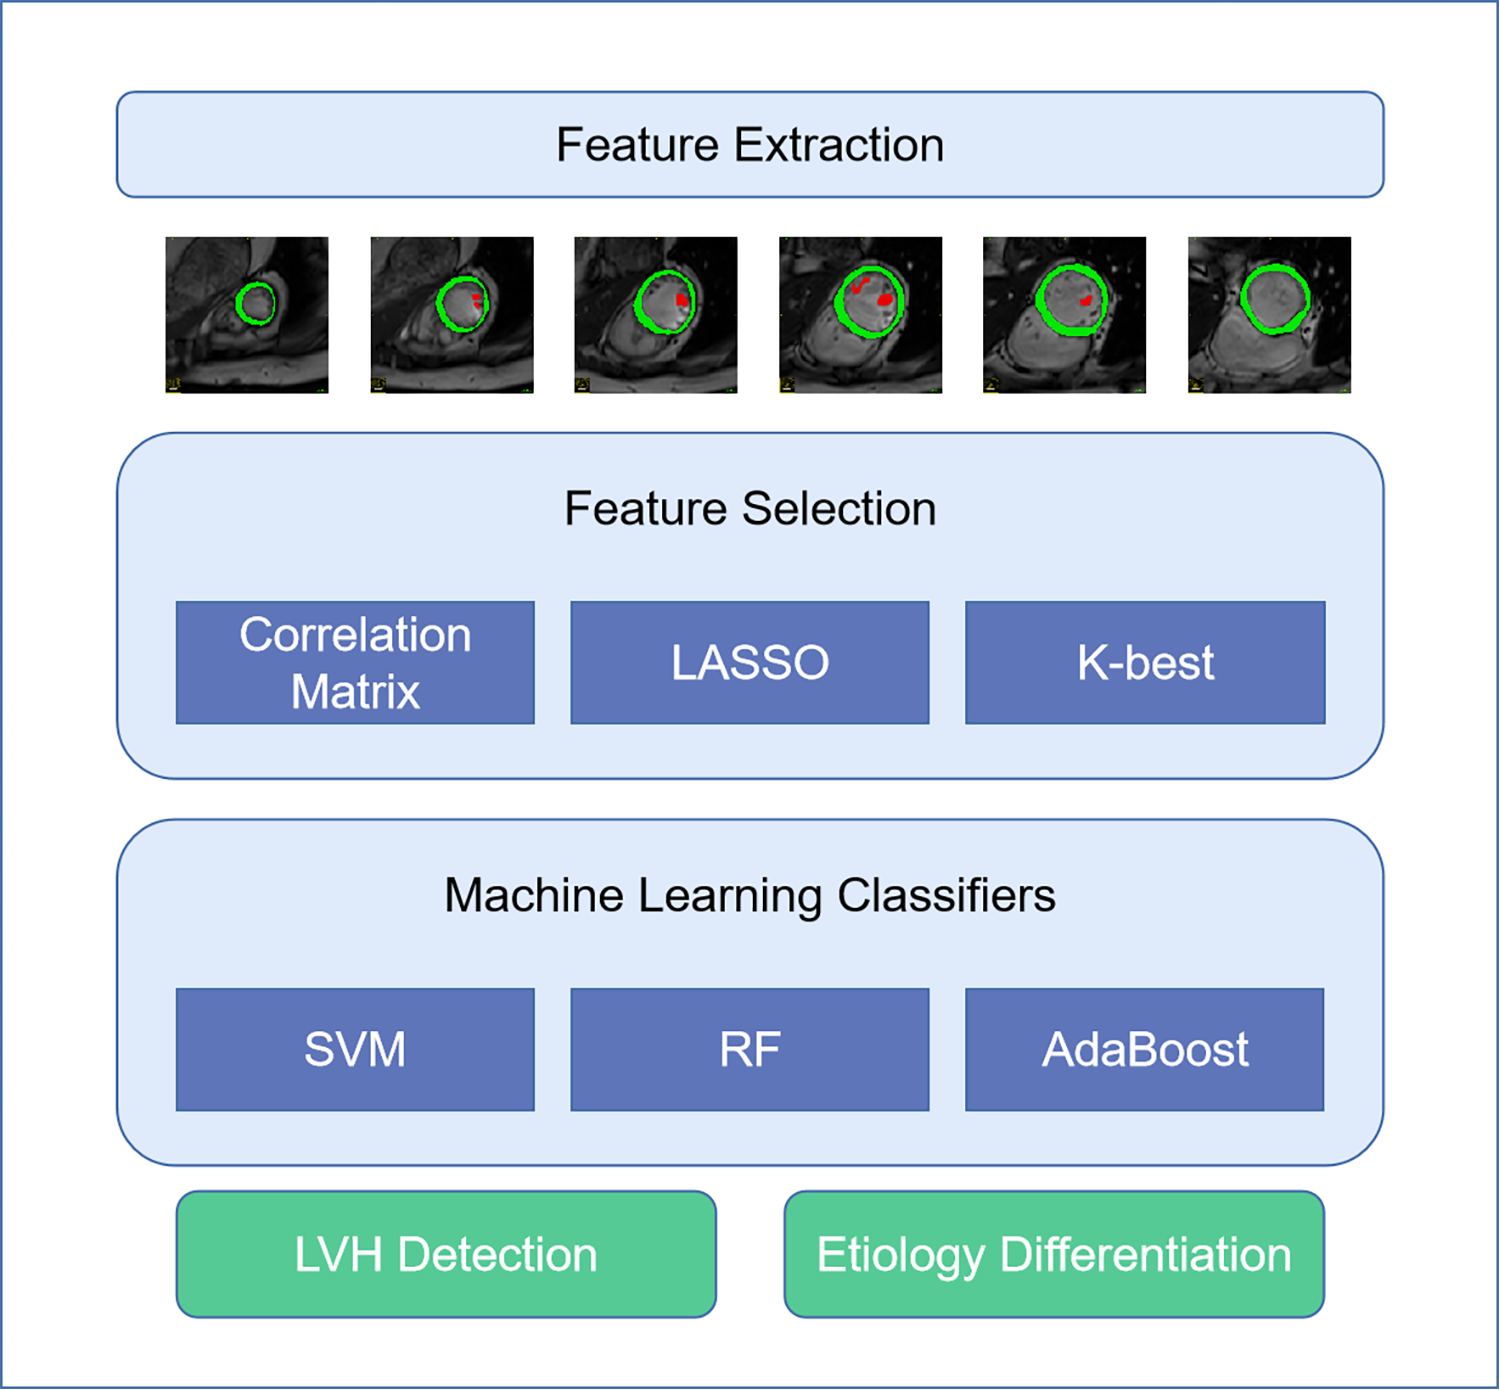
Figure 1. Flowchart of the Study
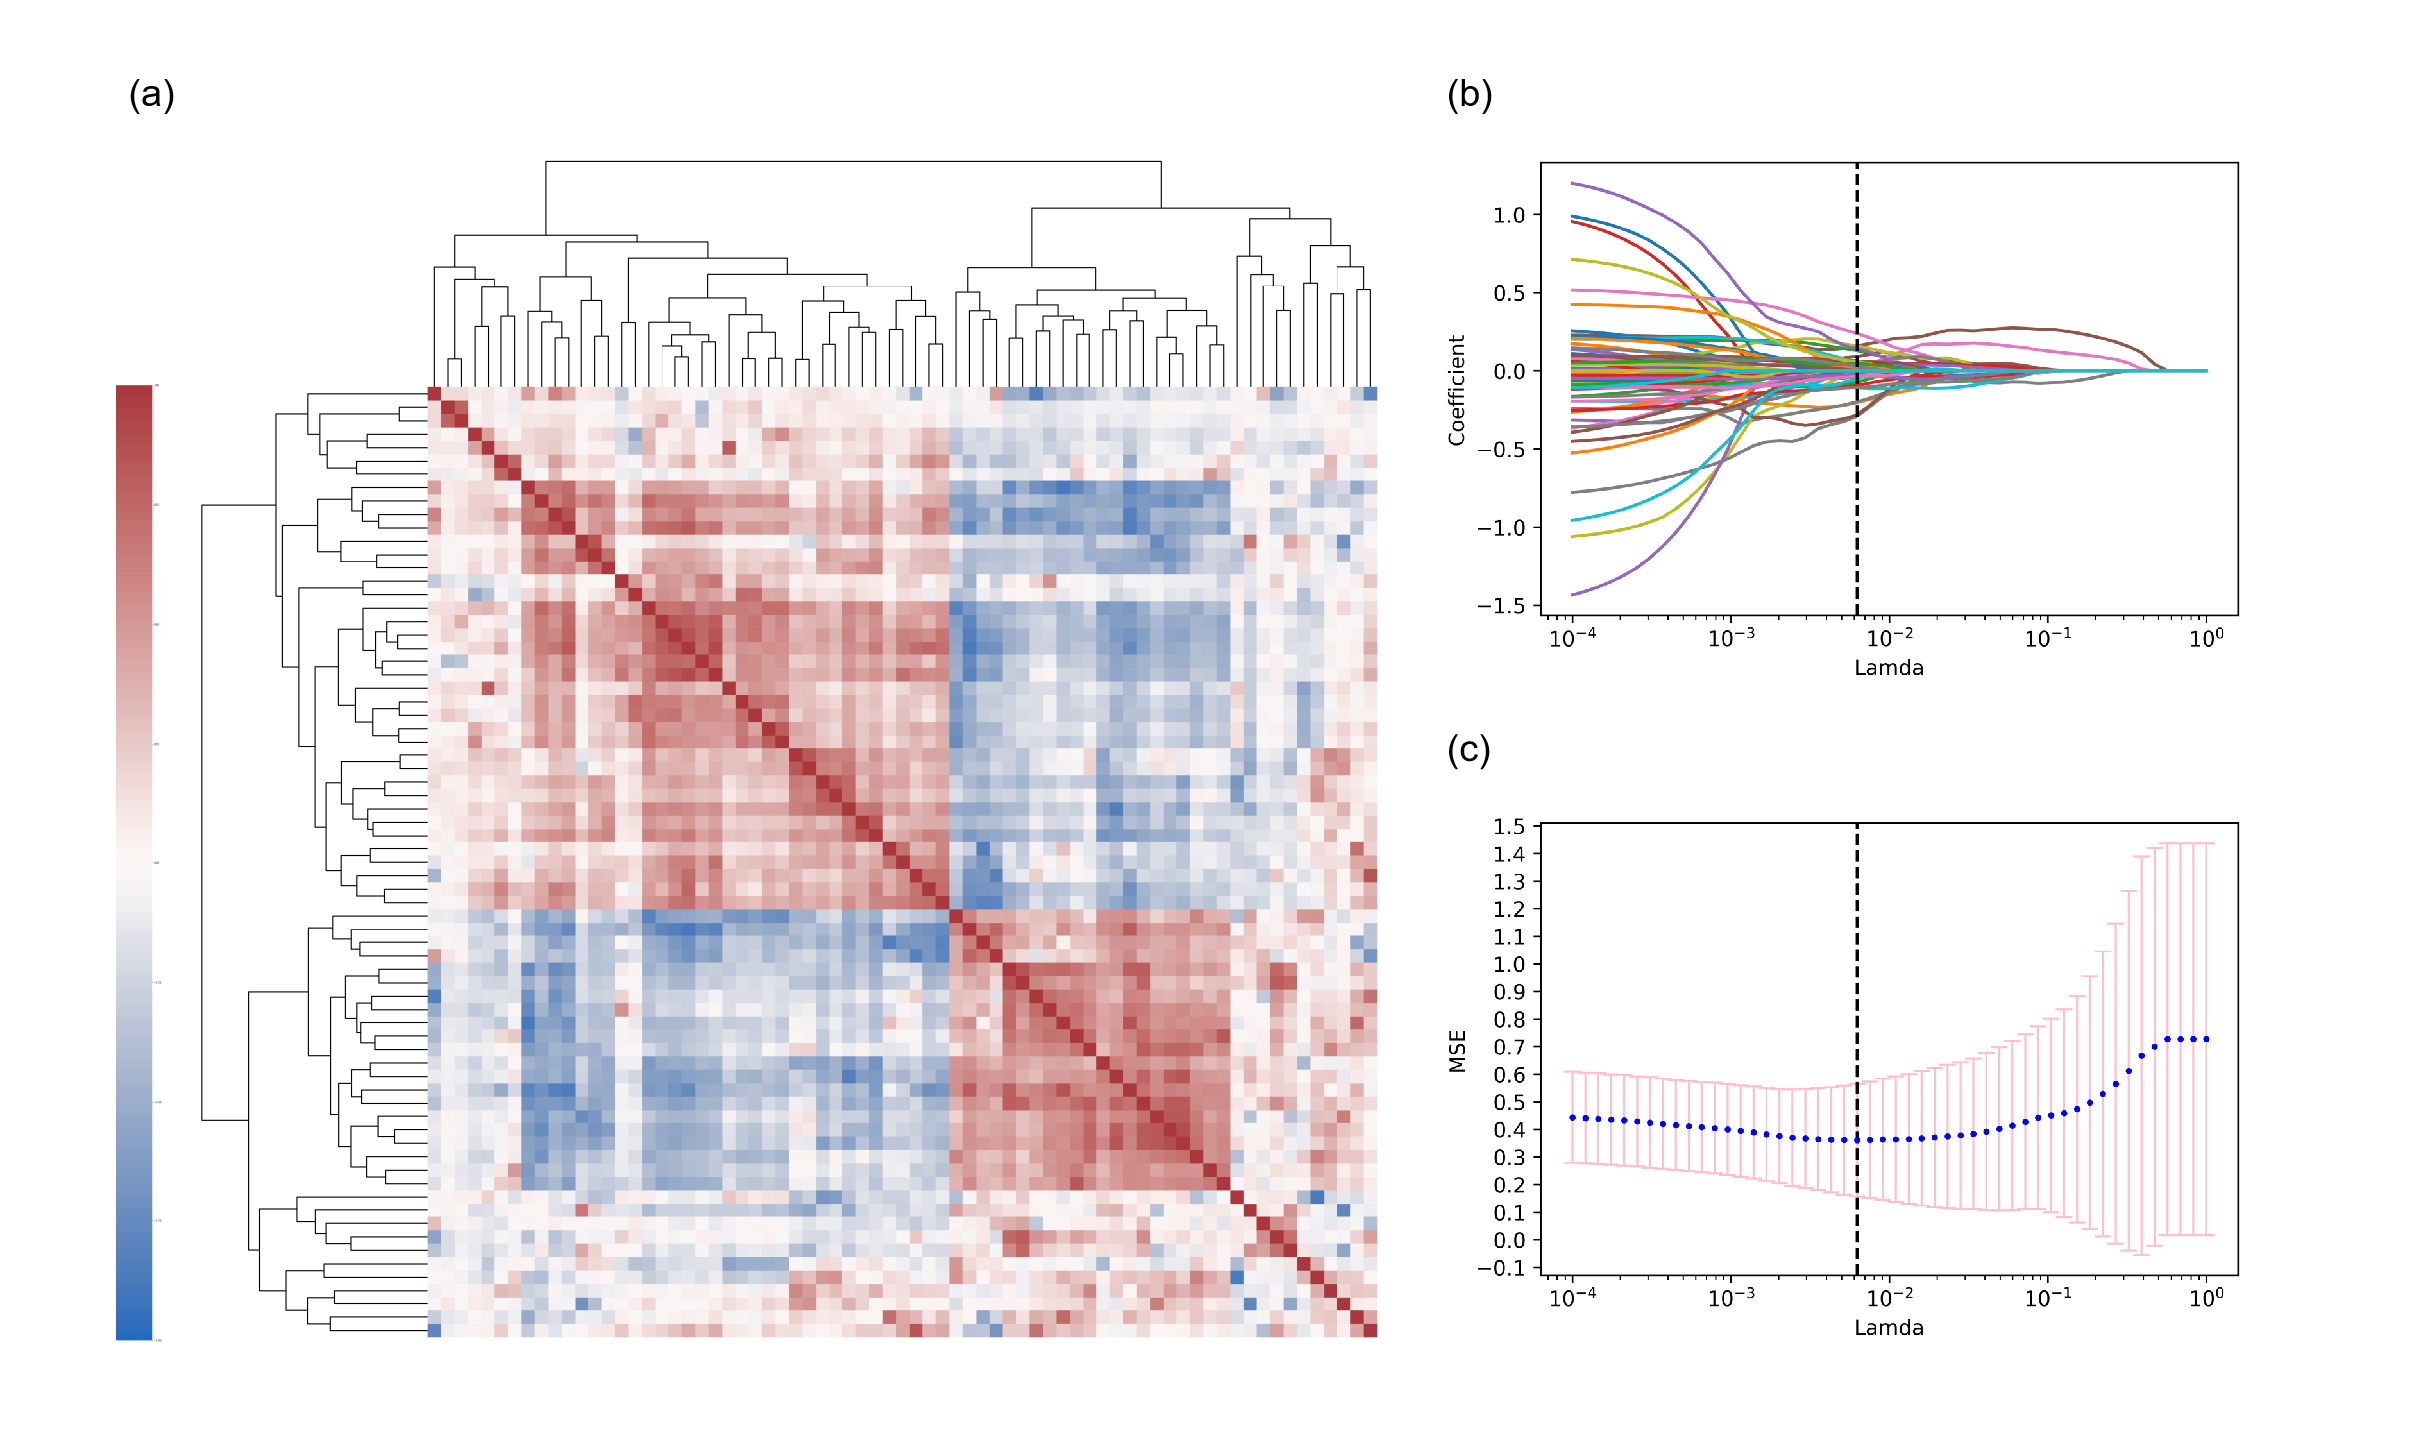
FIgure 2. a) Correlation Matrix; b) Feature Selection by LASSO
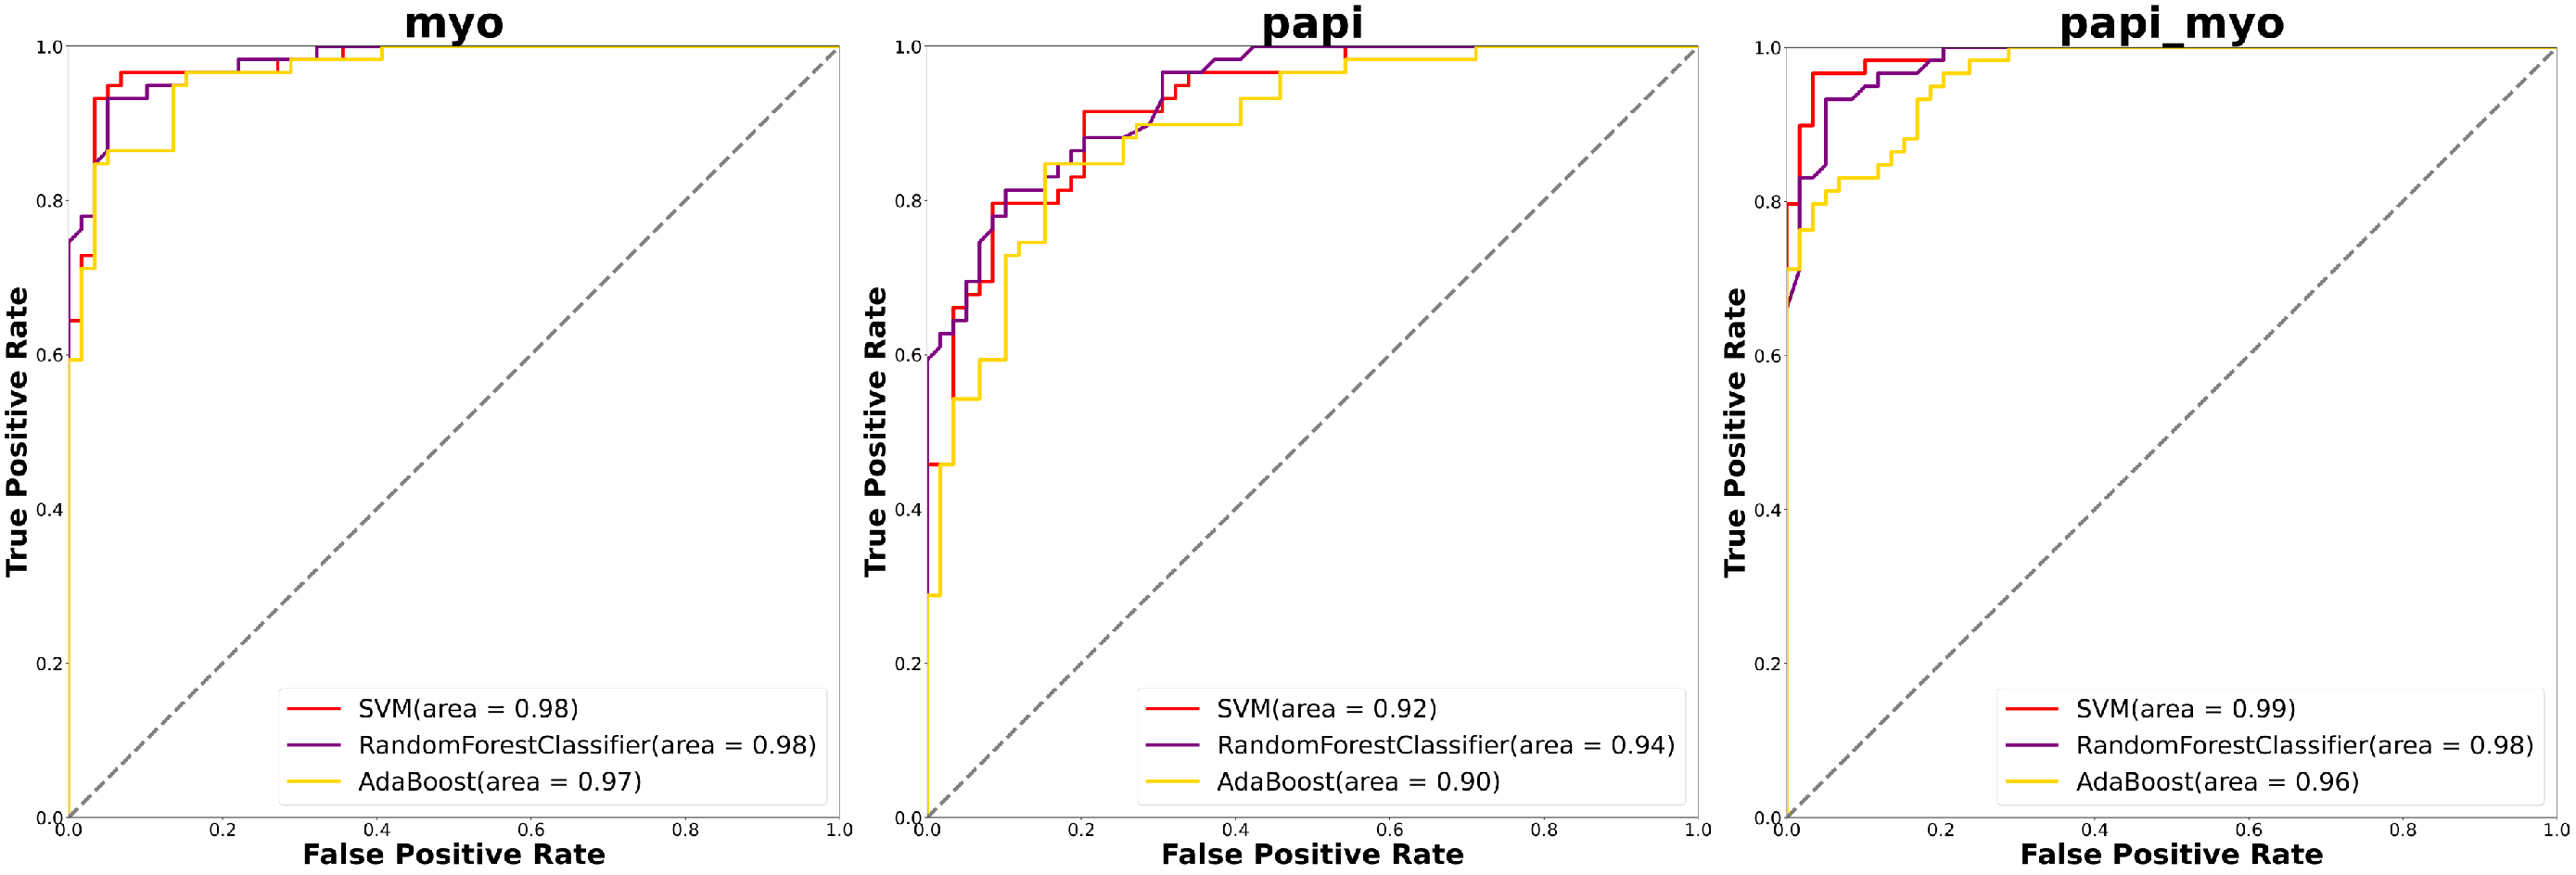
Figure 3. The ROC Curves for LVH Detection
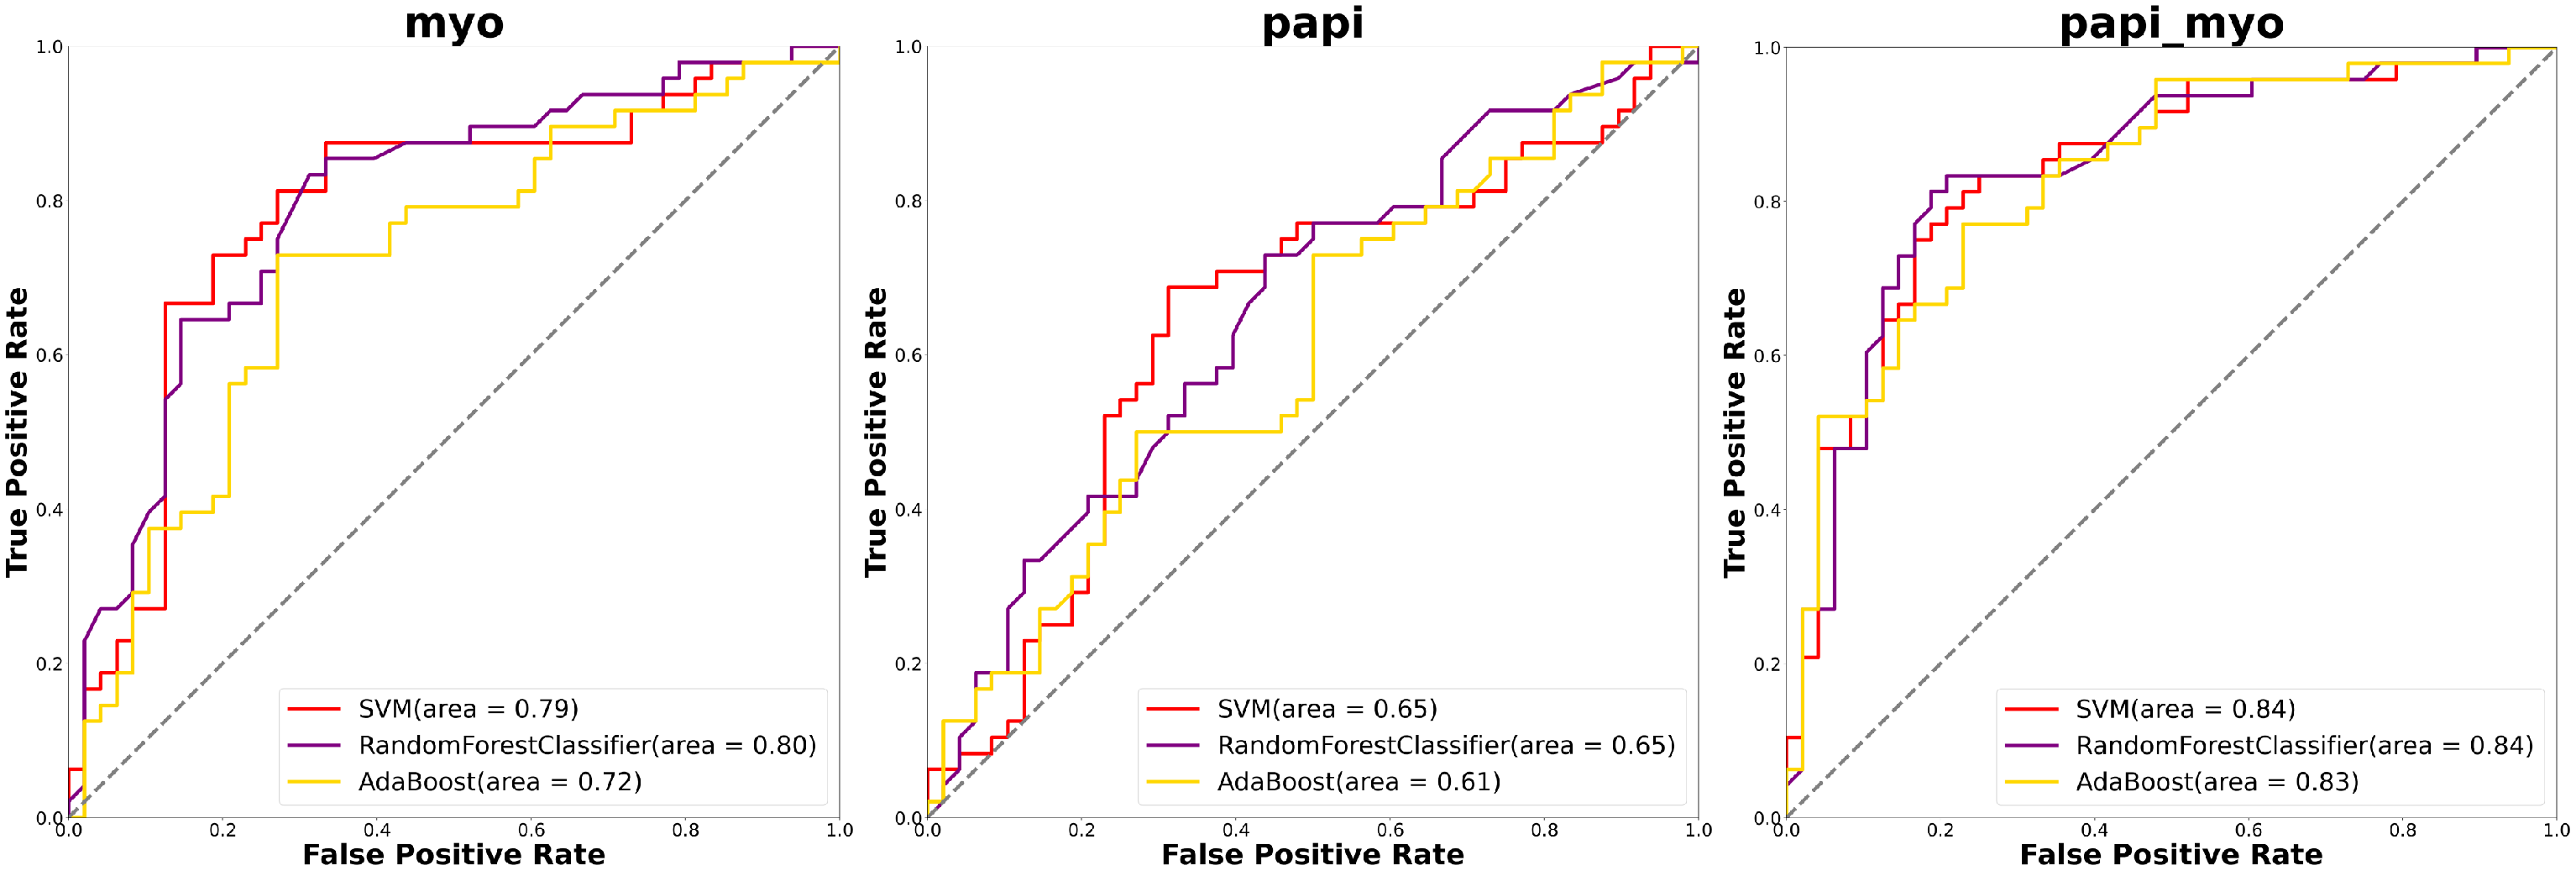
Figure 4. The ROC Curves for LVH Etiology Differentiation
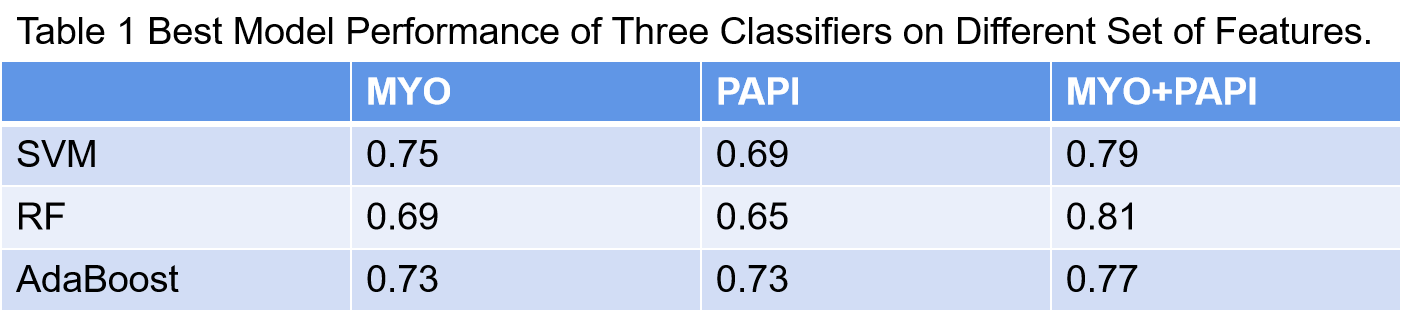
Table1. The Accuracy of LVH Etiology Differentiation
DOI: https://doi.org/10.58530/2023/4463