4452
Comparison of fat fraction techniques within the pelvis: evaluating repeatability and accuracy1MRI Unit, The Royal Marsden NHS Foundation Trust, London, United Kingdom, 2Division of Radiotherapy and Imaging, The Institute of Cancer Research, London, United Kingdom
Synopsis
Keywords: Fat, Whole Body, Dixon
Dixon-derived fat fraction (FF) has proven to play a pivotal role in whole-body MRI examinations for assessment of bone marrow disease in advanced prostate cancer. However, Dixon sequences are known to be subject to multiple sources of bias compared to the proton-density fat fraction (PDFF) gold standard. In this study, FF within the pelvis was measured for healthy tissues, active lesions and treated lesions with six different Dixon sequences. All sequences demonstrated good repeatability in scan-rescan studies of healthy volunteers. Statistically significant differences were observed between T1w-FF and PDFF for both active and treated lesions which requires further investigation.
Purpose
The acquisition of T1w-FF is commonplace in oncological settings for assessing malignant infiltration of bone marrow, such as in multiple myeloma, metastatic prostate cancer and metastatic breast cancer1. The T1w-FF is recommended to be used in several international radiology whole-body reporting guidelines2,3 as it provides a useful estimate of fat fraction for assessing treatment response alongside anatomical T1w-imaging within a feasible acquisition time. Various other Dixon sequences are used on clinical MRI systems, including a PDw 6-point Dixon that is recommended by an ISMRM Workshop as the standardised MR-based biomarker for tissue fat concentration4. In manufacturer implementations, this PDw 6-point Dixon sequence contains spectral modelling of liver fat. Furthermore, T2w-TSE Dixon sequences are used clinically for whole-spine imaging for both fat suppression5 and for fat fraction6. Each Dixon sequence has its advantages and disadvantages, and the resulting FF is subject to different degrees of bias, e.g. T1 bias7,8, T2* decay, noise bias7,9, eddy currents7,8, B0 inhomogeneity10 and the spectral fat complexity of fat7-10. This pilot study aimed to assess the differences between fat fraction measurements provided by different Dixon sequences, both in healthy tissues and in bony lesions.Methods
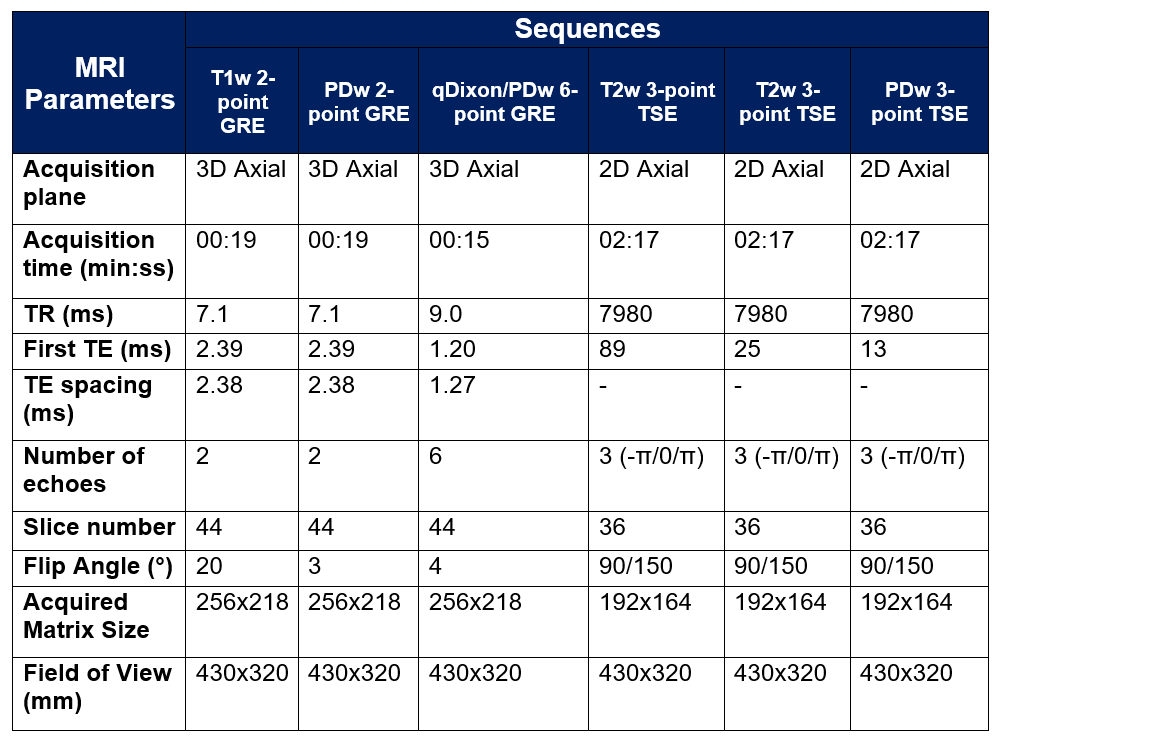
10 healthy volunteers (age = 33.9±7.4yrs, 5 female, 5 male) and 28 male patients (age = 72.0±8.0yrs) with metastatic prostate cancer were imaged with a single pelvis station , covering L5 to the femoral heads, on a MAGNETOM Sola, Siemens Healthcare, Erlangen, Germany, using an 18-channel phased-array surface coil and a 32-channel spine coil. The sequence parameters are displayed in Table 1.For the volunteer cohort, these sequences were repeated after repositioning the subject to assess the repeatability of each sequence. For the patient cohort, the study sequences were appended to their clinical whole-body examination. Sequence 5 was omitted from the patient study due to scan time constraints. All volunteer and patient studies were approved by an Institutional Review Board and all subjects gave informed consent.
In order to characterise a comprehensive fat fraction range, ROIs were drawn in the gluteus medius muscles, L5 vertebrae, posterior iliac bones, femoral heads and subcutaneous fat using Horos/Osirix MD. For the patient cohort, ROIs were drawn on focal lesions in the bones, which were defined as either active (defined by an abnormal fat fraction and ADC < 800 x 10-6 mm2/s, N = 12), or treated (defined by an abnormal fat fraction and ADC > 1400 x 10-6 mm2/s due to treatment-induced response, N = 7). A maximum of one active and one treated lesion were included for each patient. Lesions were excluded if they were of insufficient size (area<1cm2).
ROIs were converted into DICOM-RT using a PyOsirix plugin11 and converted into masks in MATLAB, using an in-house software (MATLAB R2021b, The MathWorks, Inc.) where all analysis was performed. Median fat fraction values were evaluated from each ROI for each sequence. Both volunteer and patient datasets were pooled to assess healthy tissues, which demonstrate varying degrees of fatty infiltration due to age, and bony lesions.
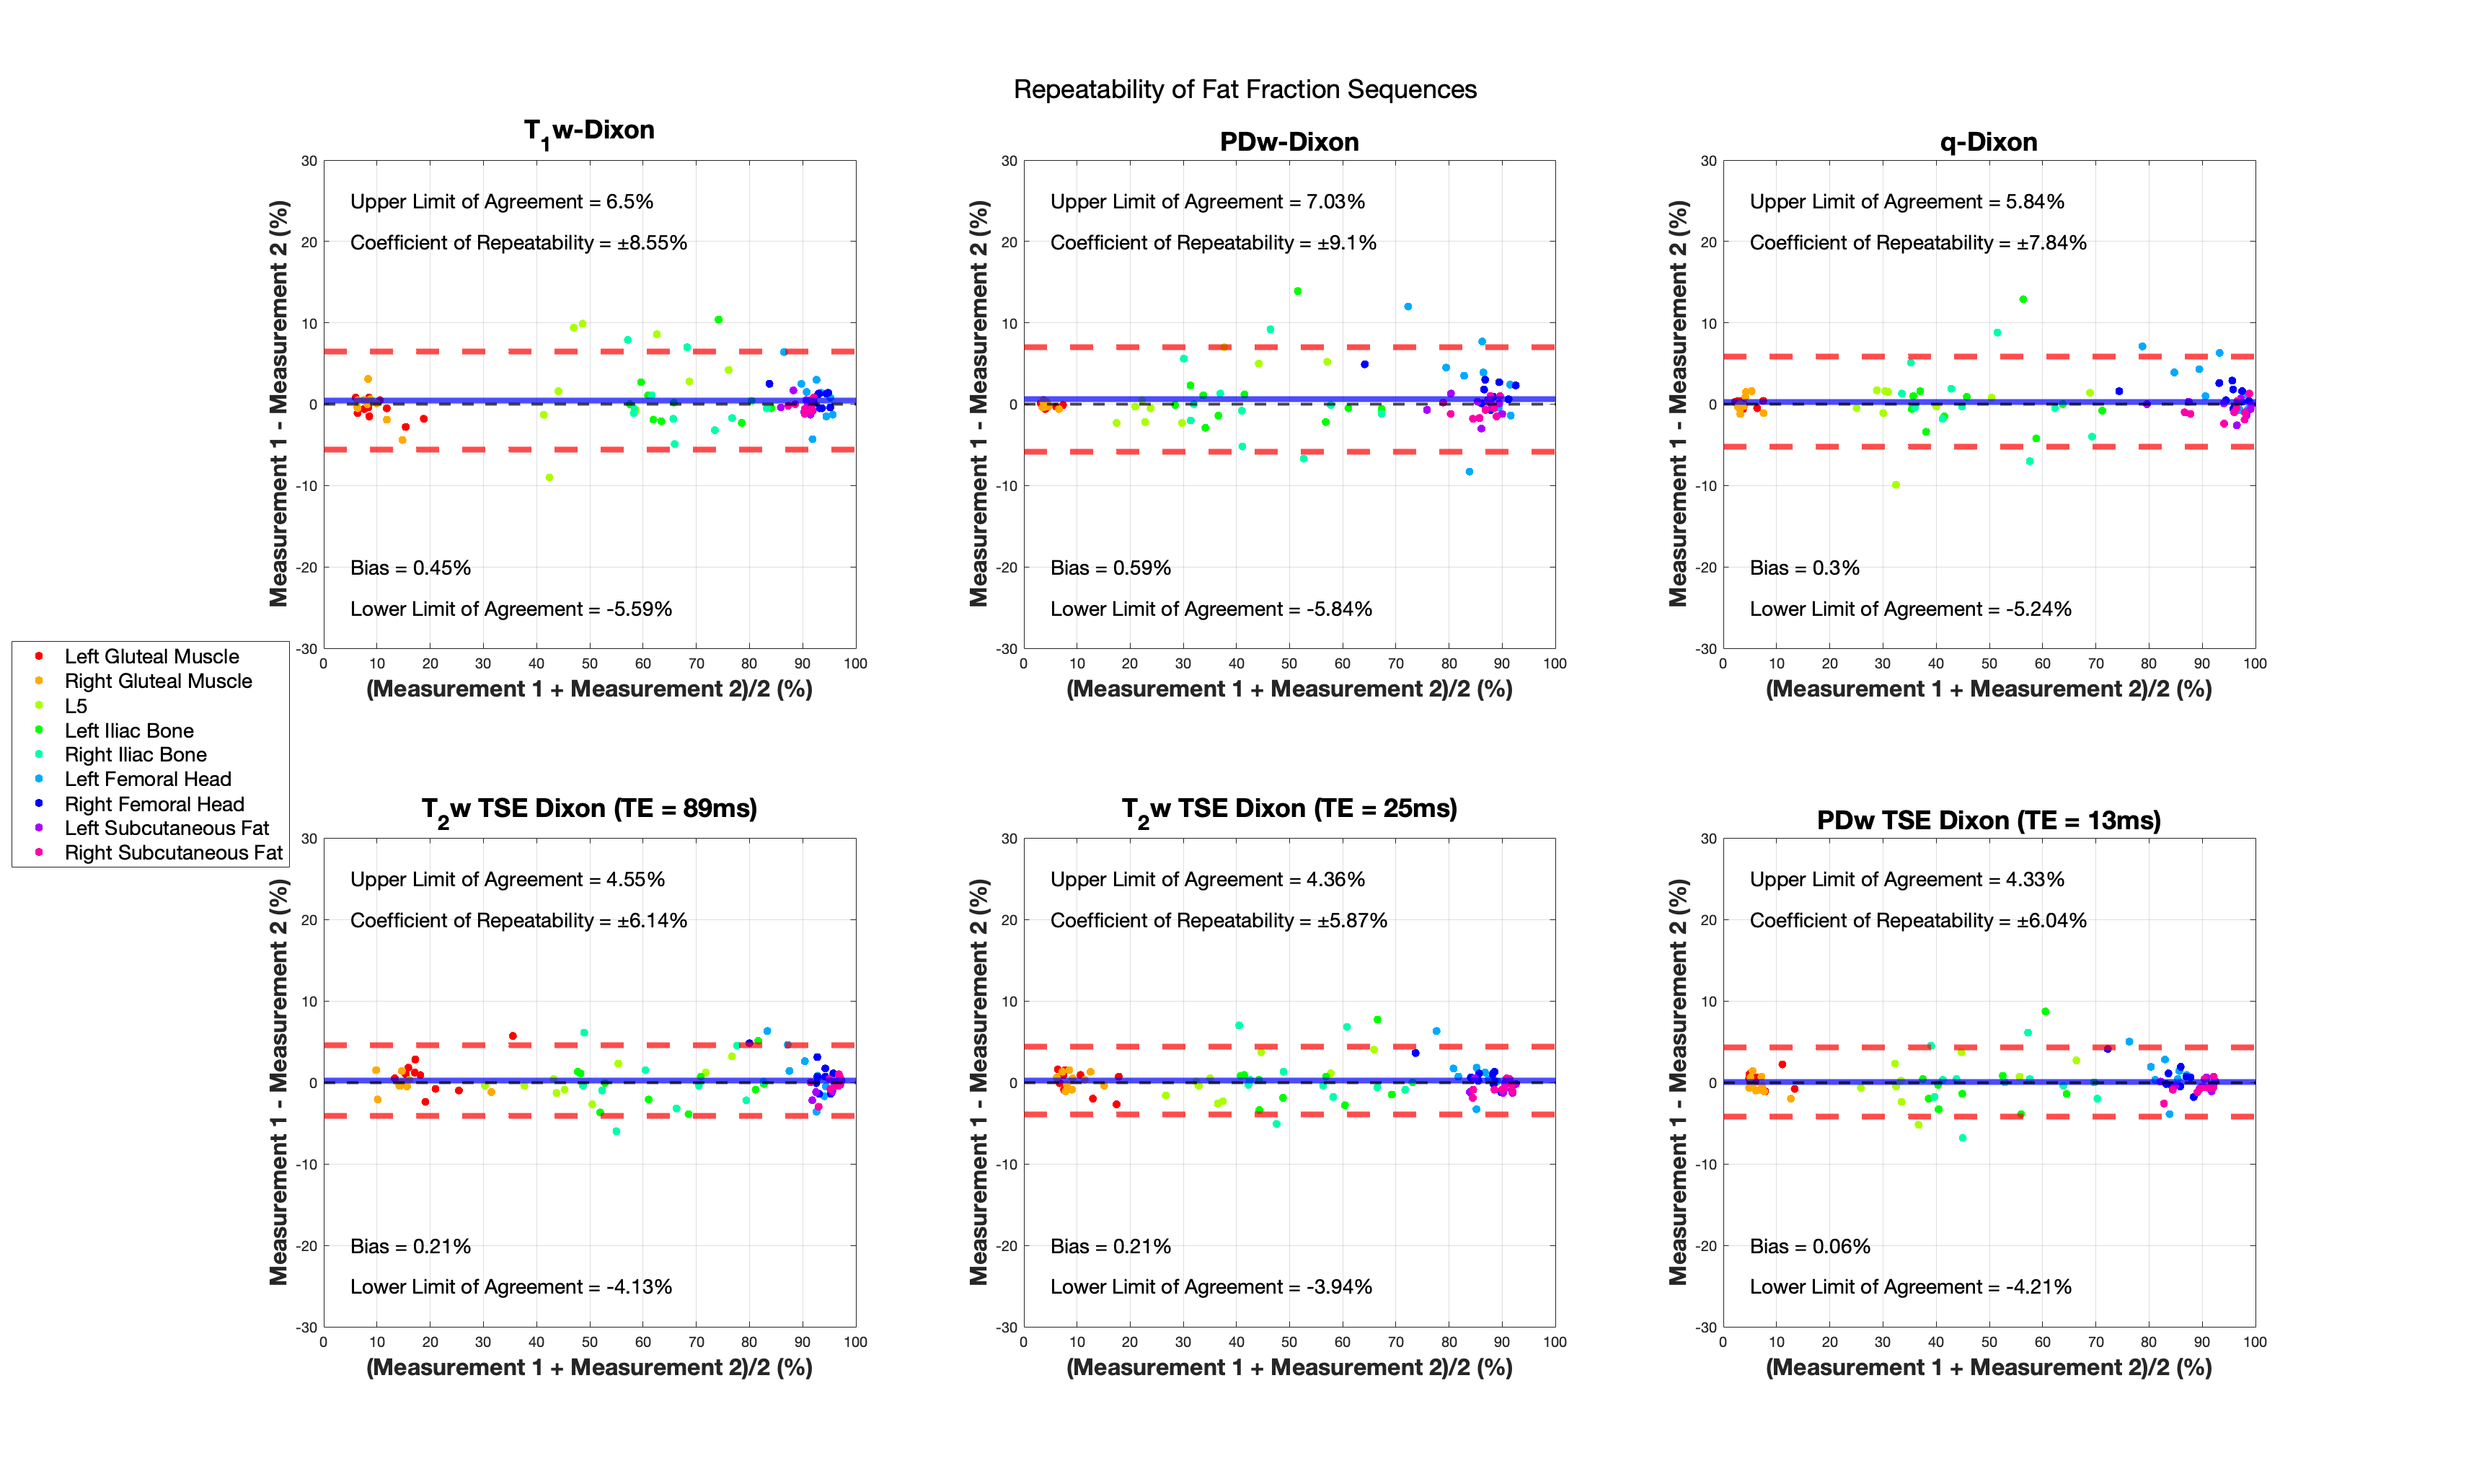
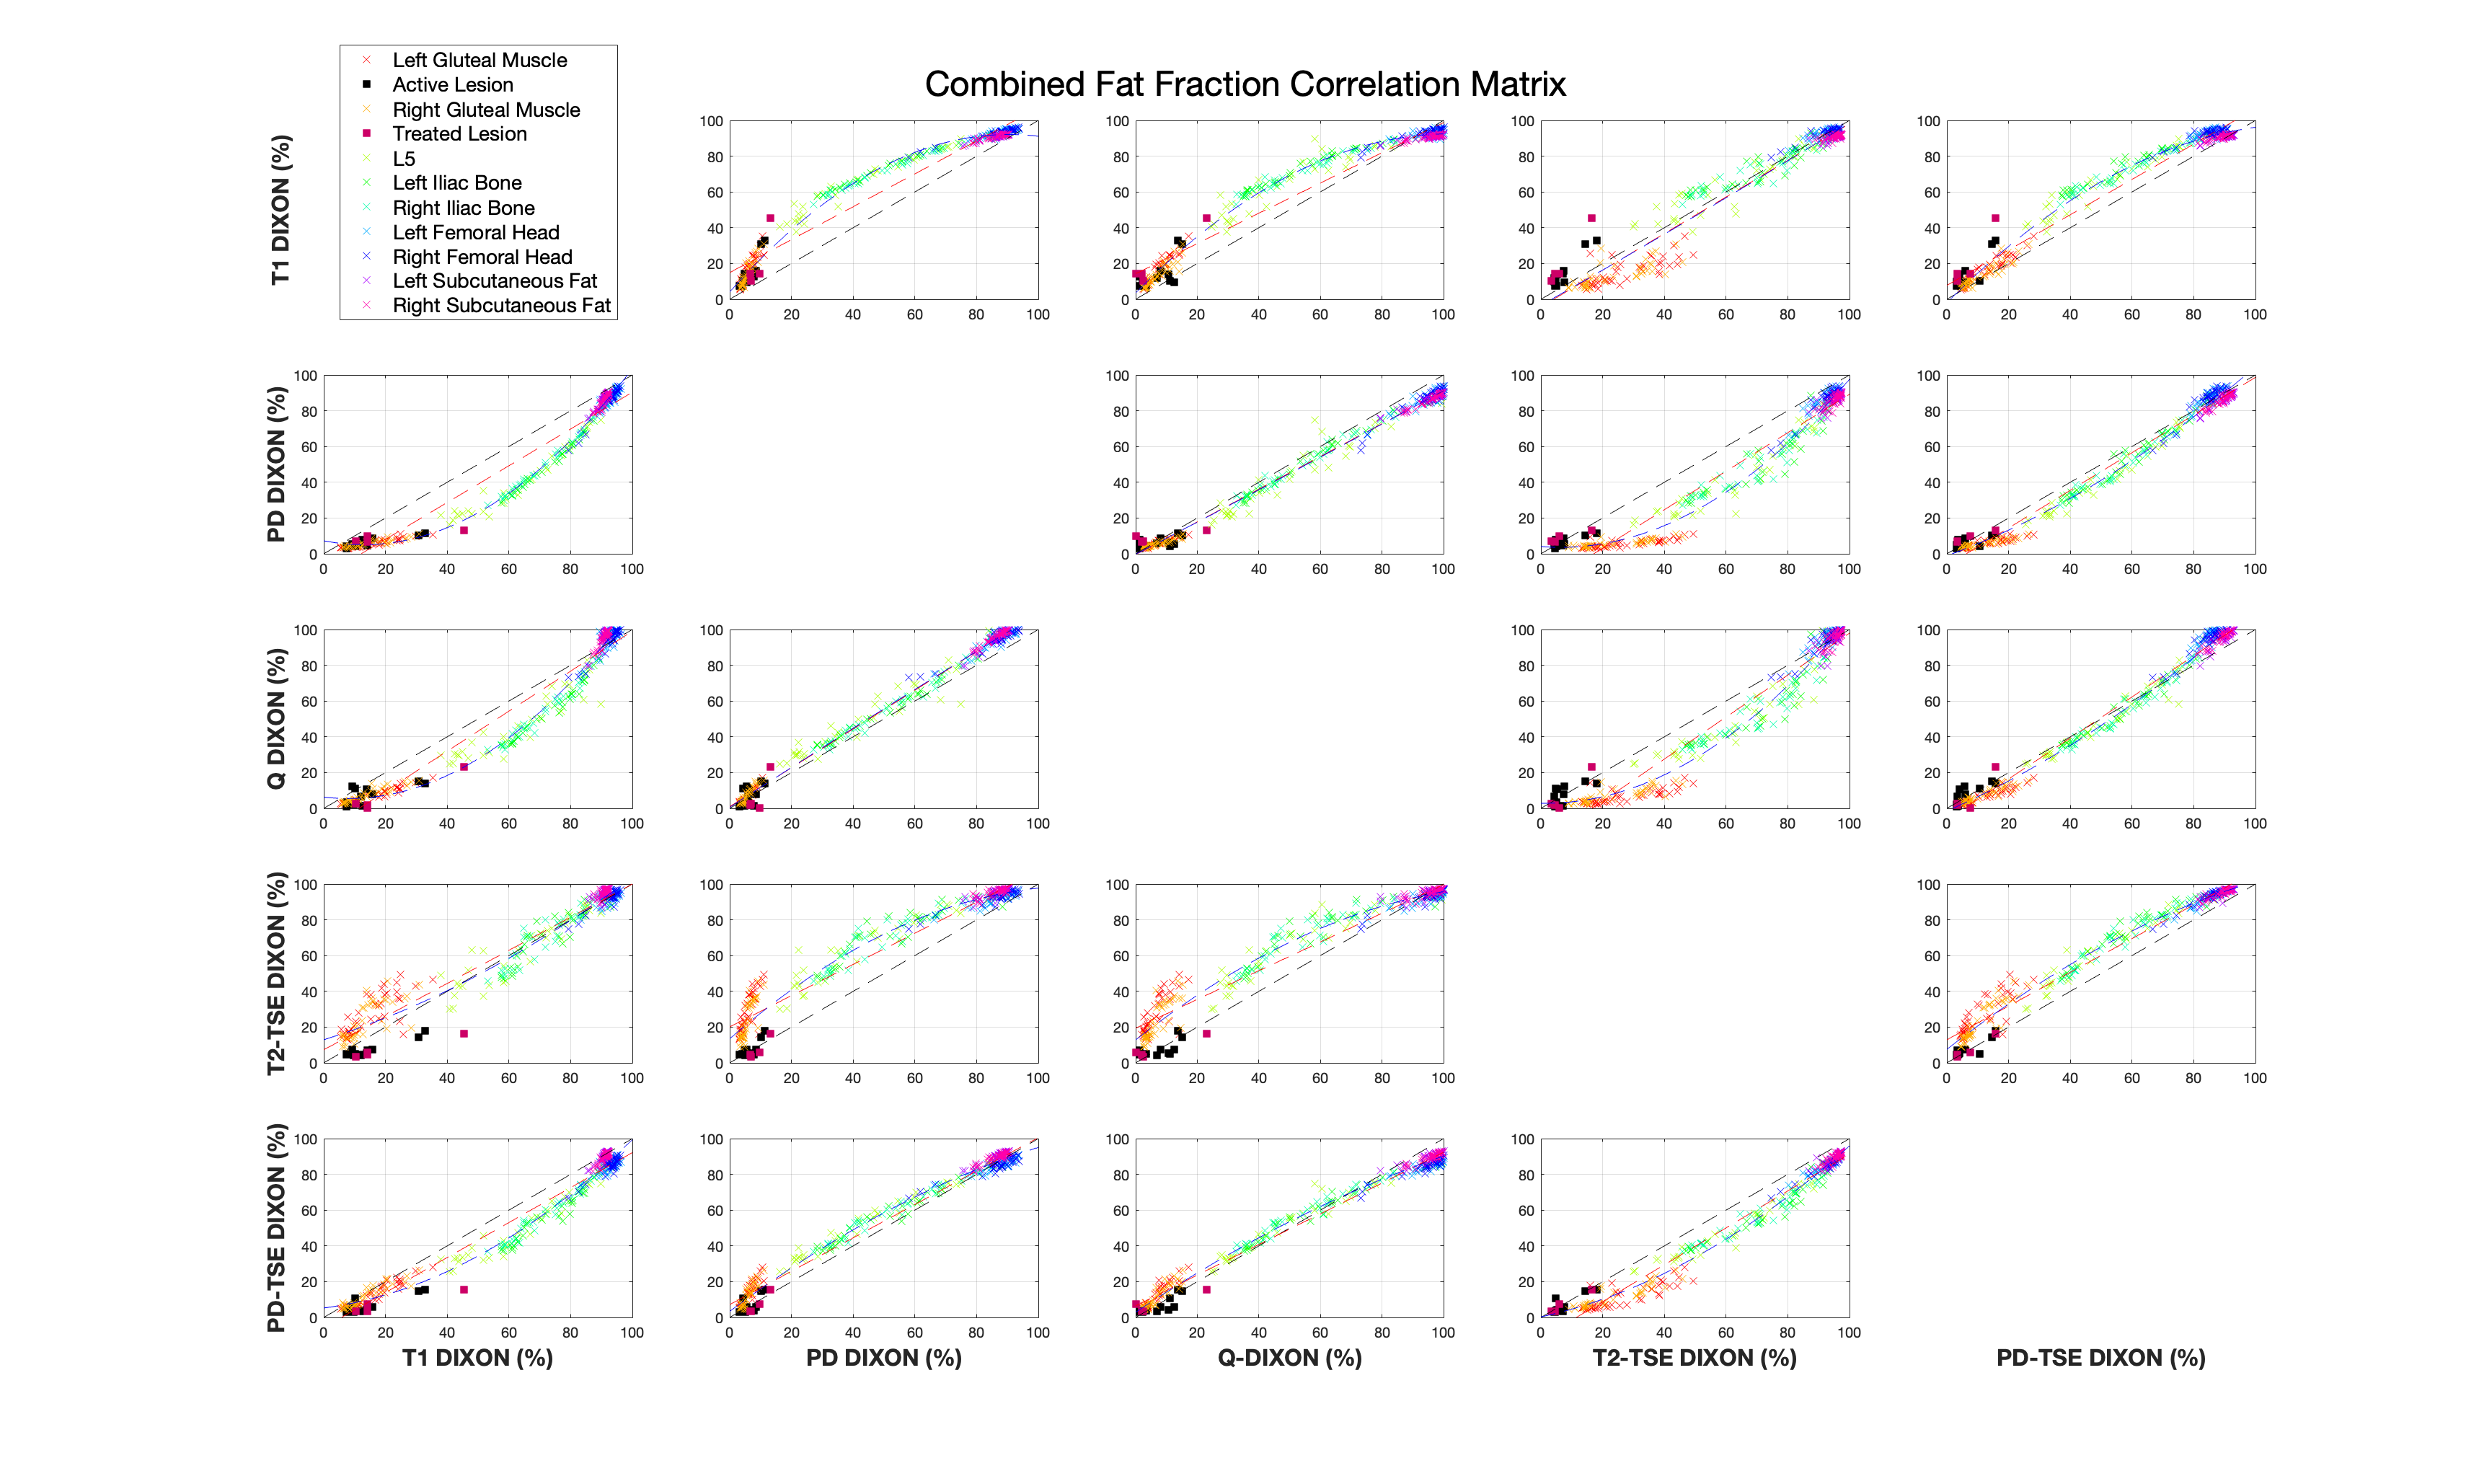
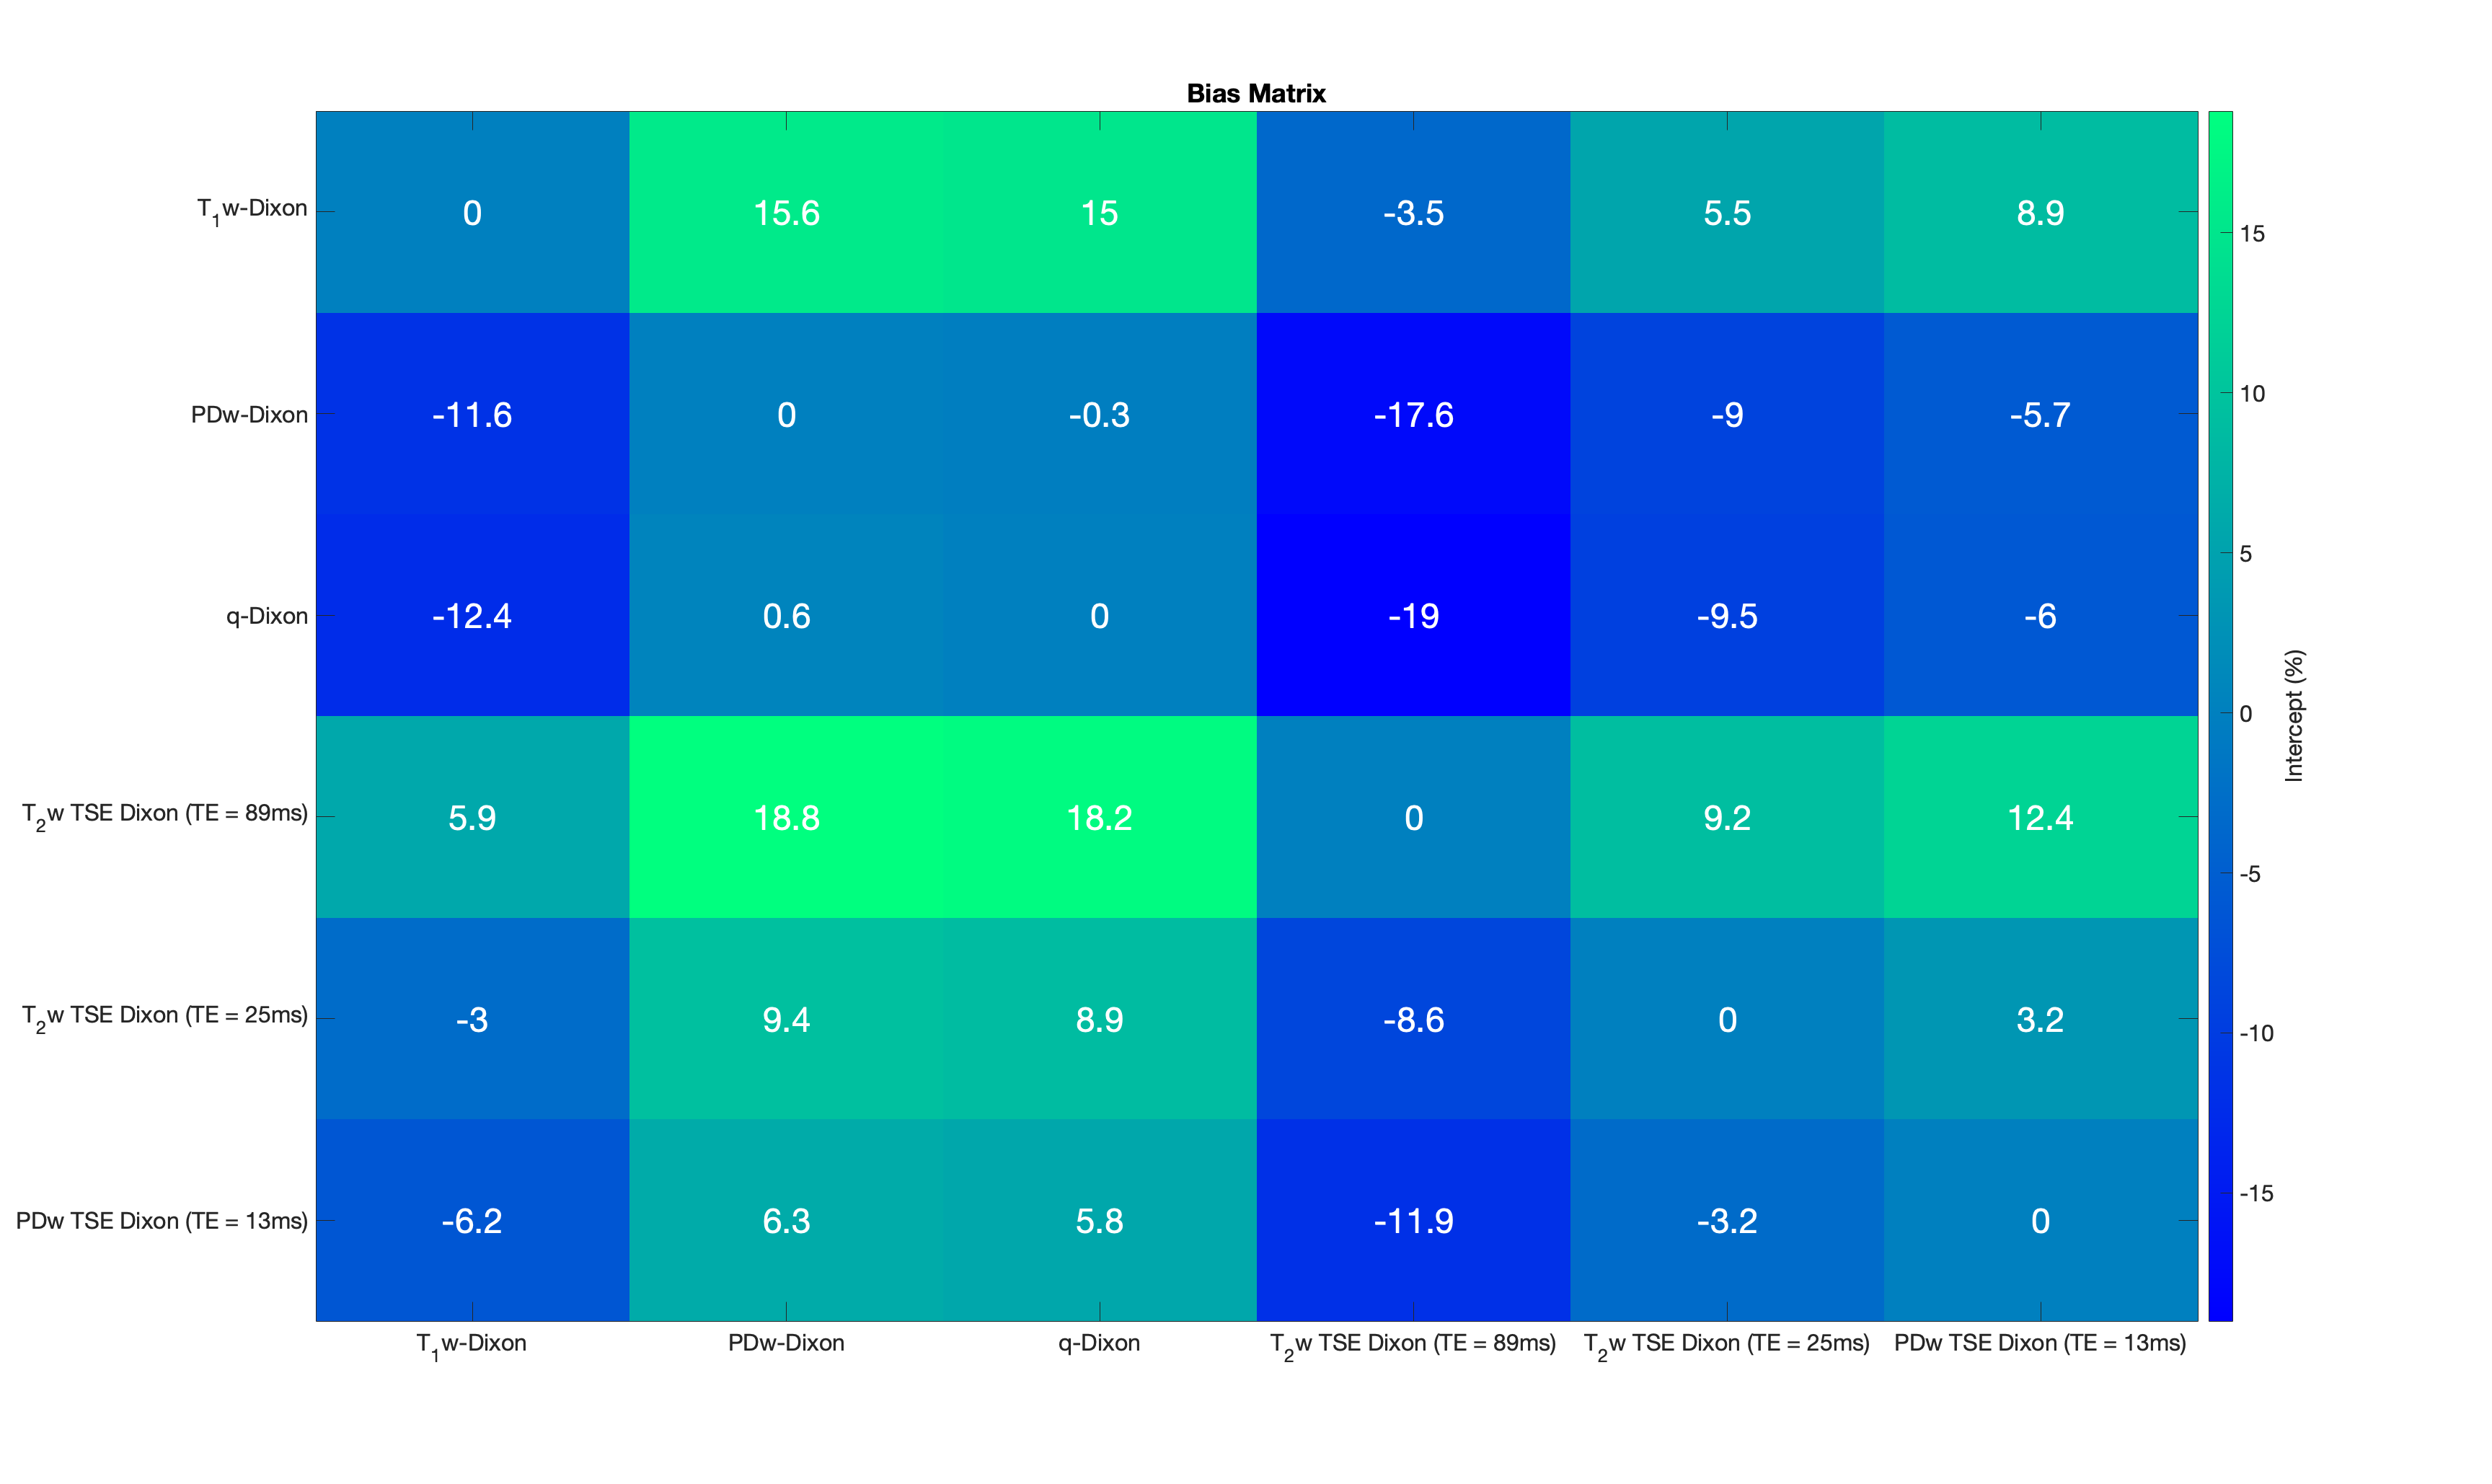
Repeatability was assessed using Bland-Altman plots and the 95% limits of agreement. Differences between FF estimates were assessed using linear regressions between each Dixon permutation to assess bias by evaluation of intercepts. Statistical significance of differences in lesion FF for these sequences against the PDFF from the PDw 6-point Dixon sequence was evaluated using the Friedman test.
Results and Discussion
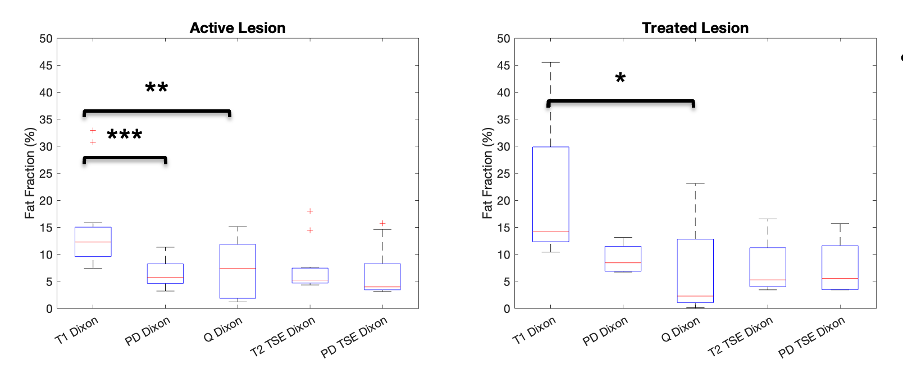
Bland-Altman analysis of the volunteer studies (Figure 1) demonstrate limits of agreement for all sequences that are comparable to those seen in studies of hepatic PDFF repeatability12. Linear regressions performed on the pooled analysis of all volunteer and patient data demonstrate significant bias in the T1w-Dixon and T2w-TSE Dixon compared with the PDw 6-point Dixon (Figures 2 and 3) due to T1 and noise bias respectively. The Friedman test (Figure 4) demonstrated significant increase in fat fraction measured by T1w-Dixon compared to the PDw 6-point Dixon for both active and treated lesions (p<0.001 and p<0.01 respectively). The significant decrease in FF seen between treated lesions measured by the T1w-Dixon sequence and the PDw 6-point Dixon sequence is contradictory to the FF variation seen between the T1w-FF and other sequences’ FF results. This could be due to the liver fat spectral model being inappropriate for a treated lesion or the adaptive fitting step in the q-Dixon reconstruction13,14 artefactually lowering the fat fraction measured in treated lesions.Limitations of this work include the lack of an appropriate ground truth, as the PDw 6-point Dixon sequence used has a spectral model that has been optimised for liver, and the small number of lesions in the study.
Conclusions
Our preliminary results indicate that PDw 2-pt Dixon and PDw 3-pt TSE Dixon sequences are suitable surrogates for producing a PDFF across all assessed tissue types with good repeatability for sites without a sequence to calculate PDFF. The T2w 3-point TSE Dixon is adequate for evaluating lesion FF but demonstrates significant noise bias within the muscle with increasing T2-weighting. Future work will focus on the acquiring of additional lesion data, particularly longitudinally, to assess whether the significant differences in fat fraction measured by the PDw 6-point Dixon sequence and the T1w-Dixon are clinically significant.Acknowledgements
This study represents independent research funded by the National Institute for Health and Care Research (NIHR) Biomedical Research Centre and the Clinical Research Facility in Imaging at The Royal Marsden NHS Foundation Trust and The Institute of Cancer Research, London. The views expressed are those of the author(s) and not necessarily those of the NIHR or the Department of Health and Social Care.References
1. Bray, T.J.P. et al. (2017) “Fat fraction mapping using magnetic resonance imaging: Insight Into Pathophysiology,” The British Journal of Radiology, p. 20170344. Available at: https://doi.org/10.1259/bjr.20170344.
2. Padhani, A.R. et al. (2017) “Metastasis reporting and Data System for prostate cancer: Practical guidelines for acquisition, interpretation, and reporting of whole-body magnetic resonance imaging-based evaluations of Multiorgan involvement in Advanced prostate cancer,” European Urology, 71(1), pp. 81–92. Available at: https://doi.org/10.1016/j.eururo.2016.05.033.
3. Messiou, C. et al. (2019) “Guidelines for Acquisition, interpretation, and reporting of whole-body MRI in myeloma: Myeloma response assessment and diagnosis system (MY-RADS),” Radiology, 291(1), pp. 5–13. Available at: https://doi.org/10.1148/radiol.2019181949.
4. Reeder, S.B., Hu, H.H. and Sirlin, C.B. (2012) “Proton density fat-fraction: A standardized MR-based biomarker of tissue fat concentration,” Journal of Magnetic Resonance Imaging, 36(5), pp. 1011–1014. Available at: https://doi.org/10.1002/jmri.23741.
5. Ma, J. et al. (2004) “T2-weighted spine imaging with a fast three-point Dixon technique: Comparison with chemical shift selective fat suppression,” Journal of Magnetic Resonance Imaging, 20(6), pp. 1025–1029. Available at: https://doi.org/10.1002/jmri.20201.10. Donners, R. et al. (2021) “T2-weighted Dixon MRI of the spine: A feasibility study of quantitative vertebral bone marrow analysis,” Diagnostic and Interventional Imaging, 102(7-8), pp. 431–438. Available at: https://doi.org/10.1016/j.diii.2021.01.013.
6. Donners, R. et al. (2021) “T2-weighted Dixon MRI of the spine: A feasibility study of quantitative vertebral bone marrow analysis,” Diagnostic and Interventional Imaging, 102(7-8), pp. 431–438. Available at: https://doi.org/10.1016/j.diii.2021.01.013.
7. Liu, C.-Y. et al. (2007) “Fat quantification with IDEAL gradient echo imaging: Correction of bias from T1 and noise,” Magnetic Resonance in Medicine, 58(2), pp. 354–364. Available at: https://doi.org/10.1002/mrm.21301
8. Kühn, J.-P. et al. (2013) “T1 bias in chemical shift-encoded liver fat-fraction: Role of the flip angle,” Journal of Magnetic Resonance Imaging, 40(4), pp. 875–883. Available at: https://doi.org/10.1002/jmri.24457..
9. Peterson, P. and Månsson, S. (2013) “Fat quantification using multiecho sequences with bipolar gradients: Investigation of accuracy and noise performance,” Magnetic Resonance in Medicine, 71(1), pp. 219–229. Available at: https://doi.org/10.1002/mrm.24657..
10. Hernando, D. et al. (2011) “Addressing phase errors in fat-water imaging using a mixed magnitude/complex fitting method,” Magnetic Resonance in Medicine, 67(3), pp. 638–644. Available at: https://doi.org/10.1002/mrm.23044.
11. Blackledge, M.D. et al. (2016) “Rapid development of Image Analysis Research Tools: Bridging the gap between researcher and clinician with pyOsiriX,” Computers in Biology and Medicine, 69, pp. 203–212. Available at: https://doi.org/10.1016/j.compbiomed.2015.12.002.
12. Yokoo, T. et al. (2018) “Linearity, bias, and precision of hepatic proton density fat fraction measurements by using MR imaging: A meta-analysis,” Radiology, 286(2), pp. 486–498. Available at: https://doi.org/10.1148/radiol.2017170550.
13. LiverLab Siemens Healthineers. Available at: https://www.siemens-healthineers.com/en-uk/magnetic-resonance-imaging/options-and-upgrades/clinical-applications/liver-lab (Accessed: October 14, 2022).
14. Zhong, X. et al. (2013) “Liver fat quantification using a multi-step adaptive fitting approach with multi-echo GRE imaging,” Magnetic Resonance in Medicine, 72(5), pp. 1353–1365. Available at: https://doi.org/10.1002/mrm.25054.
Figures