4449
The value of amide proton weighted imaging in predicting perineural invasion of prostate cancer
Xiwei Li1, Lihua Chen1, Nan Wang1, Jiazheng Wang2, and Ailian Liu1
1The First Affiliated Hospital of Dalian Medical University, Dalian, China, 2Philips Healthcare,Beijing, Beijing, China
1The First Affiliated Hospital of Dalian Medical University, Dalian, China, 2Philips Healthcare,Beijing, Beijing, China
Synopsis
Keywords: Prostate, Cancer
Perinerval infiltration (PNI) is closely related to the degree of radical operation and postoperative recurrence. Pathological examination is the gold standard for PNI diagnosis, but it is an invasive examination. The APTw imaging can be used for disease diagnosis and therapeutic evaluation by detecting the content of protein and polypeptide in tissues and cells. In this study, APTw was used to evaluate the PNI in prostate cancer. The results showed that the APT values of PNI (+) group was higher than other one group. Therefore, APTw is of great value in differentiation of perinerval invasion from prostate cancer.Summary of Main Findings
This study assessed using APTw APT values to predict the value of the neural invasion of prostate cancer. APT values of the PNI(+) group were significantly higher than those of the PNI(-) group [(2.77±0.65)% vs(2.30±0.42)%, p < 0.05]. The ROC curve for APT values in two groups is shown with an AUC value of 0.707. When setting the threshold of 2.45%, the corresponding diagnostic sensitivity and specificity would be 71.43% and 63.16%.Introduction
Tumor cells infiltrate through lymphatic vessels in the endoneurium or perineurium, which is one of the important ways for tumor cells to metastasize distally. Related studies have shown that tumor cells can spread into the surrounding soft tissues through peripheral nerve invasion and promote cancer progression. APTw is a novel quantitative imaging technique based on the saturating transfer effect of chemical exchange between free water, proteins and peptides, which can detect the abundant amide proton components in tumors. At present, APT imaging has been used for the diagnosis of uterine, rectal, parotid and other diseases. In this study, we investigated the value of APTw in predicting PNI in prostate cancer.Methods
This study was approved by the Ethics Committee of our hospital, and patients were exempted from informed consent. Fifty-two patients with confirmed prostate cancer who underwent the first 3.0T MRI (Ingenia CX, Philips, the Netherlands) were retrospectively collected and divided into PNI group (Group A, n=14, age range 54-78, mean age 73.39±7.96 years) and non-PNI group (group B, n=38, age range 58-94, mean age 66.30±6.60) based on the biopsy pathological results. The imaging sequence includes T1WI, T2WI, DWI, and APTw, as shown in Table 1 for details. APT mapping (calculated as asymmetric magnetization transfer ratio based on APTw imaging) was obtained through post-processing and were fused onto the DWI images to identify the slice with largest lesion coverage for each patient. ROIs (31.6±11.3)mm2 were drawn on these slices independently by two radiologists to cover the lesion avoiding the cystic degeneration and necrotic areas(Figure 2). The APT values within each ROI were recorded as mean±SD. Bland-Altman images were used to evaluate the agreement of the measurement of the parameter value between the two observers. Independent sample t-test or Mann-Whitney U test to evaluate the difference of APT values between two cases. The ROC curve was used to evaluate the efficacy of APT values in the differentiation between the two groups,and record the sensitivity, specificity and threshold of APT value to distinguish the two groups of cases.Results
The measurement agreement between the two observers was good,as the points in the image are evenly distributed within the line difference of +1.96~-1.96(Figure 1).The APT values of the two groups were in line with normal distribution. The APT value of PNI (+) group was higher than that of PNI(-) group(t=2.163,P=0.035)(Finger 3)。The AUC value, sensitivity, specificity and threshold of APT value in predicting the two groups of diseases were 0.707,71.43%,63.16% and 2.45%(Finger 4).Discussion
The results of this study showed that the APT values have good value for distinguishing PNI in prostate cancer. APTw is mainly affected by the contents of protein and polypeptide in tumor tissue and the pH of microenvironment. Therefore, it is speculated that the reason for this result is that with the increase of tumor aggressiveness, tumor tissue metabolism becomes more active, and the increase of protein and peptide content leads to the increase of APT value. In addition, due to the more vigorous metabolism of tumor tissues in the neuroinvasive group, the tumor microenvironment will increase hypoxia, which will lead to the change of pH value of the microenvironment,protein structure and enzyme reaction rate, and finally lead to the change of APT value.Conclusion
The APT values have good value for distinguishing PNI in prostate cancer,which provides a novel imaging technique for predicting PNI in prostate cancer from the molecular and metabolic aspects.Acknowledgements
The Philips Research team (Beijing, China) is gratuitous for guidance on this study.References
[1]Takayama Y, Nishie A, Sugimoto M, et al. Amide proton transfer (APT) magnetic resonance imaging of prostate cancer: comparison with Gleason scores. MAGMA. 2016;29(4):671-679. doi:10.1007/s10334-016-0537-4
[2]Sotirios B, Demetriou E, Topriceanu CC, Zakrzewska Z. The role of APT imaging in gliomas grading: A systematic review and meta-analysis. Eur J Radiol. 2020;133:109353. doi:10.1016/j.ejrad.2020.109353
Figures
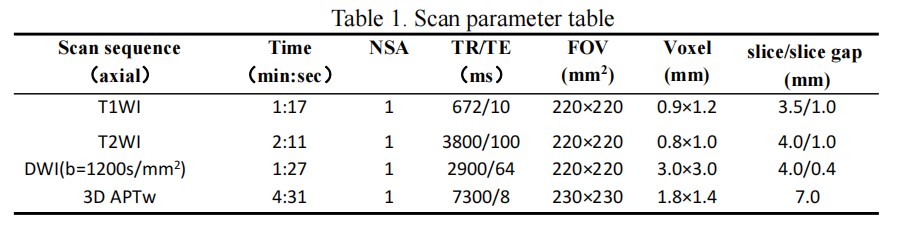
Table 1. Scan parameter table
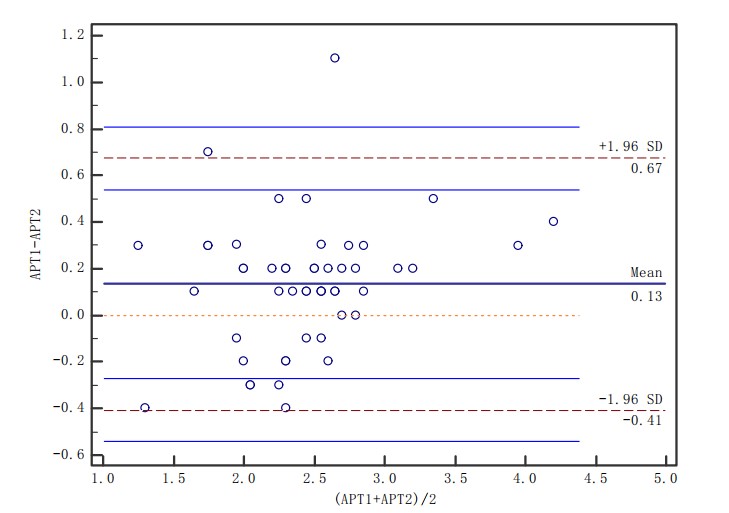
Figure 1. Blant-Altman diagram of APT measured by two observes
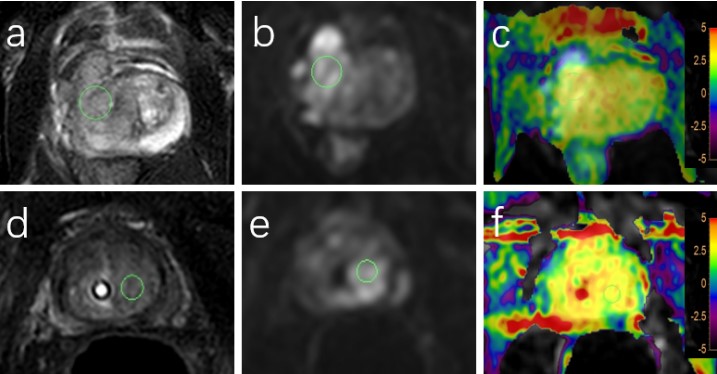
Figure 2. (a-c) Prostate cancer with neuroinvasive patients. The images of T2WI(a), DWI (b) and DWI and APT fusion (c) showed abnormal signal nodules in the right central zone, and APT value was 3.4%. (d-f) Patients with prostate cancer who are neuroinvasive. The images of T2WI(d), DWI (e) and DWI and APT fusion (f) showed abnormal signal nodules in the left central zone, and the APT value was 2.6%.
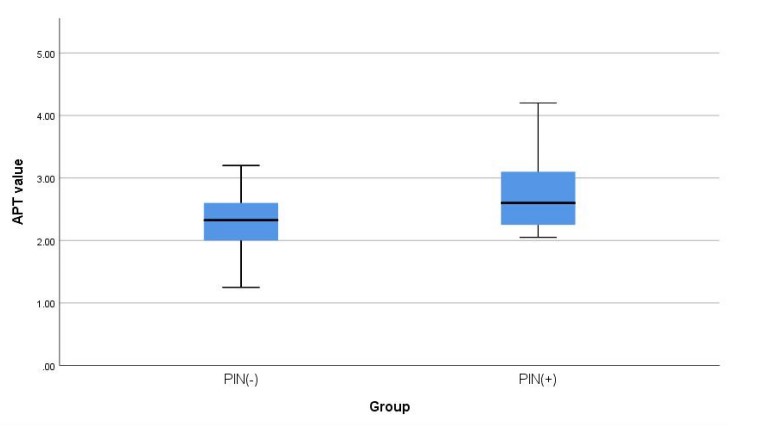
Figure 3. Box diagram of APT values of the two groups of cases
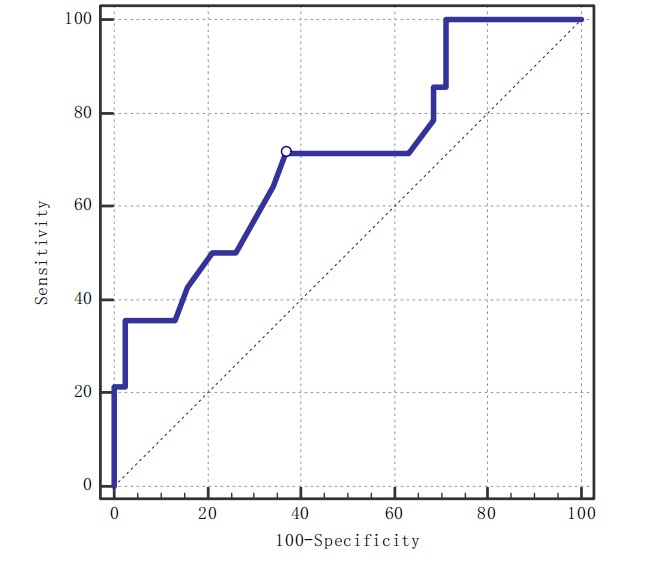
Figure 4. ROC Curve of APT value for predicting PIN in prostate cancer
DOI: https://doi.org/10.58530/2023/4449