4448
Development and clinical utility analysis of a prostate zonal segmentation model on T2-weighted imaging: a multicenter study1Peking Union Medical College Hospital, Beijing, China, 2Deepwise AI Lab, Beijing, China
Synopsis
Keywords: Prostate, Machine Learning/Artificial Intelligence, Multicenter study
Zonal segmentation is important in the management of prostatic diseases. Many studies have demonstrated the feasibility of training CNN models for zonal segmentation. However, they lack validation in non-public datasets and consideration of the patients’ characteristics. In this study, we validated the model’s utility for prostate zonal segmentation on T2WI in different external testing datasets. The model yielded good performance regardless of the variations in the patients’ clinicopathological characteristics. The model showed higher performance than the junior radiologist in PZ segmentation. Prostate morphology and MR scanner parameters, especially CG volume and vendor, impact zonal segmentation performance.Introduction
Accurate prostate zonal segmentation is important for the localization of prostate cancer and surgical planning 1, as well as for standardizing the calculation of prostate-specific antigen density 2. Nevertheless, manual segmentation is a time-consuming process with considerable interobserver variability 3. Many researchers have proposed automated segmentation methods for prostate zonal delineation on T2-weighted images (T2WI) using deep learning convolutional neural networks (CNN), which yielded good performance with substantially less time consumption. The Dice similarity coefficients (DSCs) of previously reported models were 0.765–0.938 for central gland (CG) and 0.640–0.868 for peripheral zone (PZ) 4-7. Despite their well-demonstrated feasibility, the applicability of CNN models in external testing datasets has been less investigated. In addition, the factors influencing CNN models’ performance have not been thoroughly analyzed 8. In this study, we aimed to develop a 3D U-Net–based segmentation model for accurate and efficient auto-delineation of the prostate PZ and CG on T2WI, and to assess its clinical utility in various external datasets by comparison with a junior radiologist and by investigating relevant factors influencing the model performance.Methods
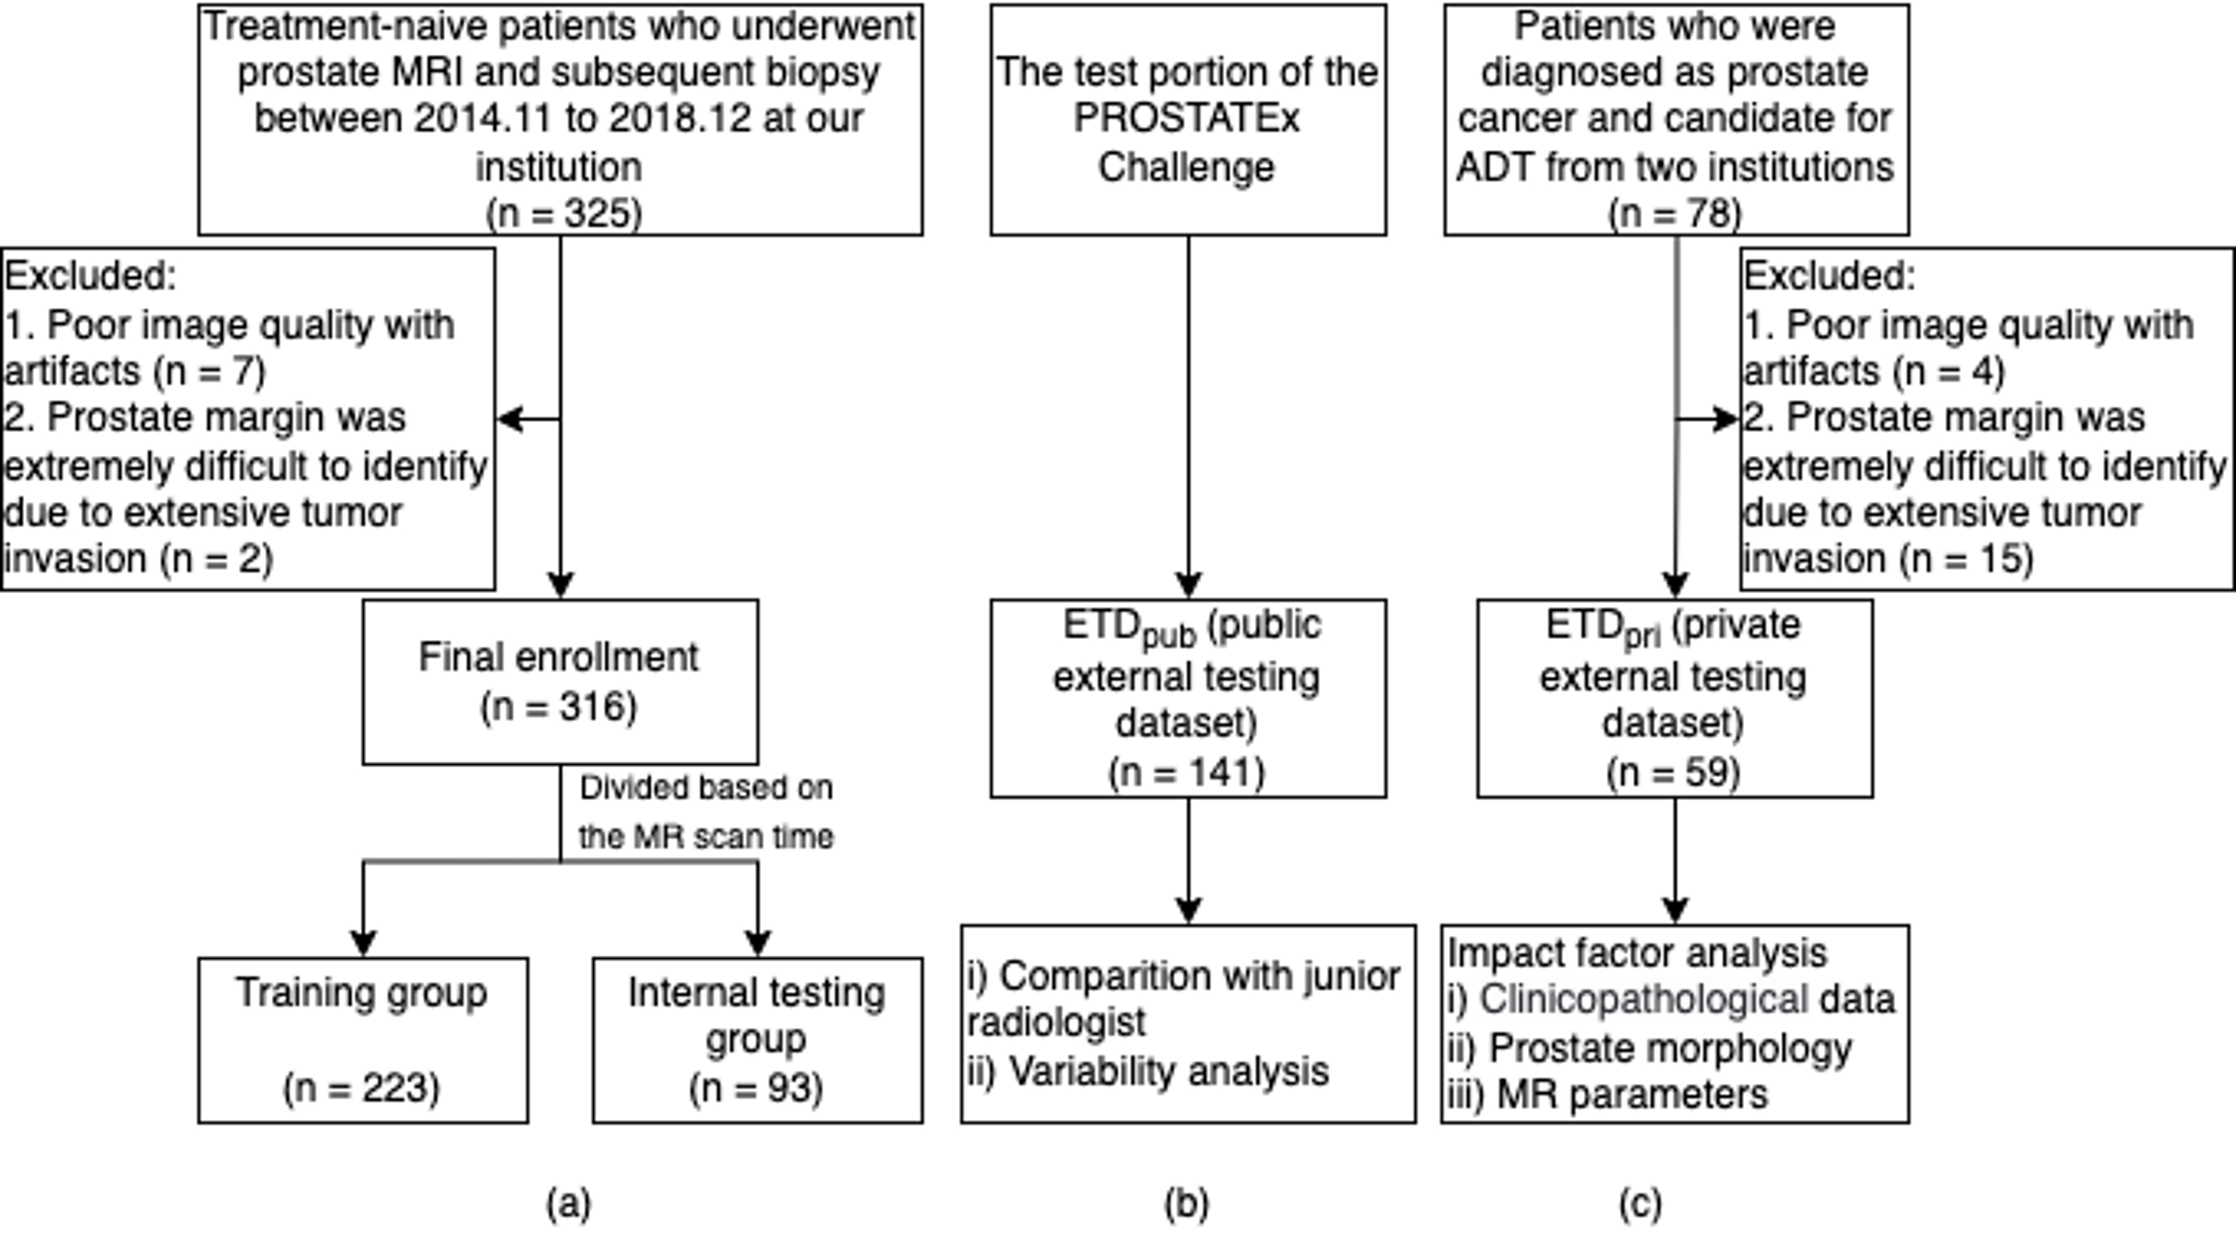
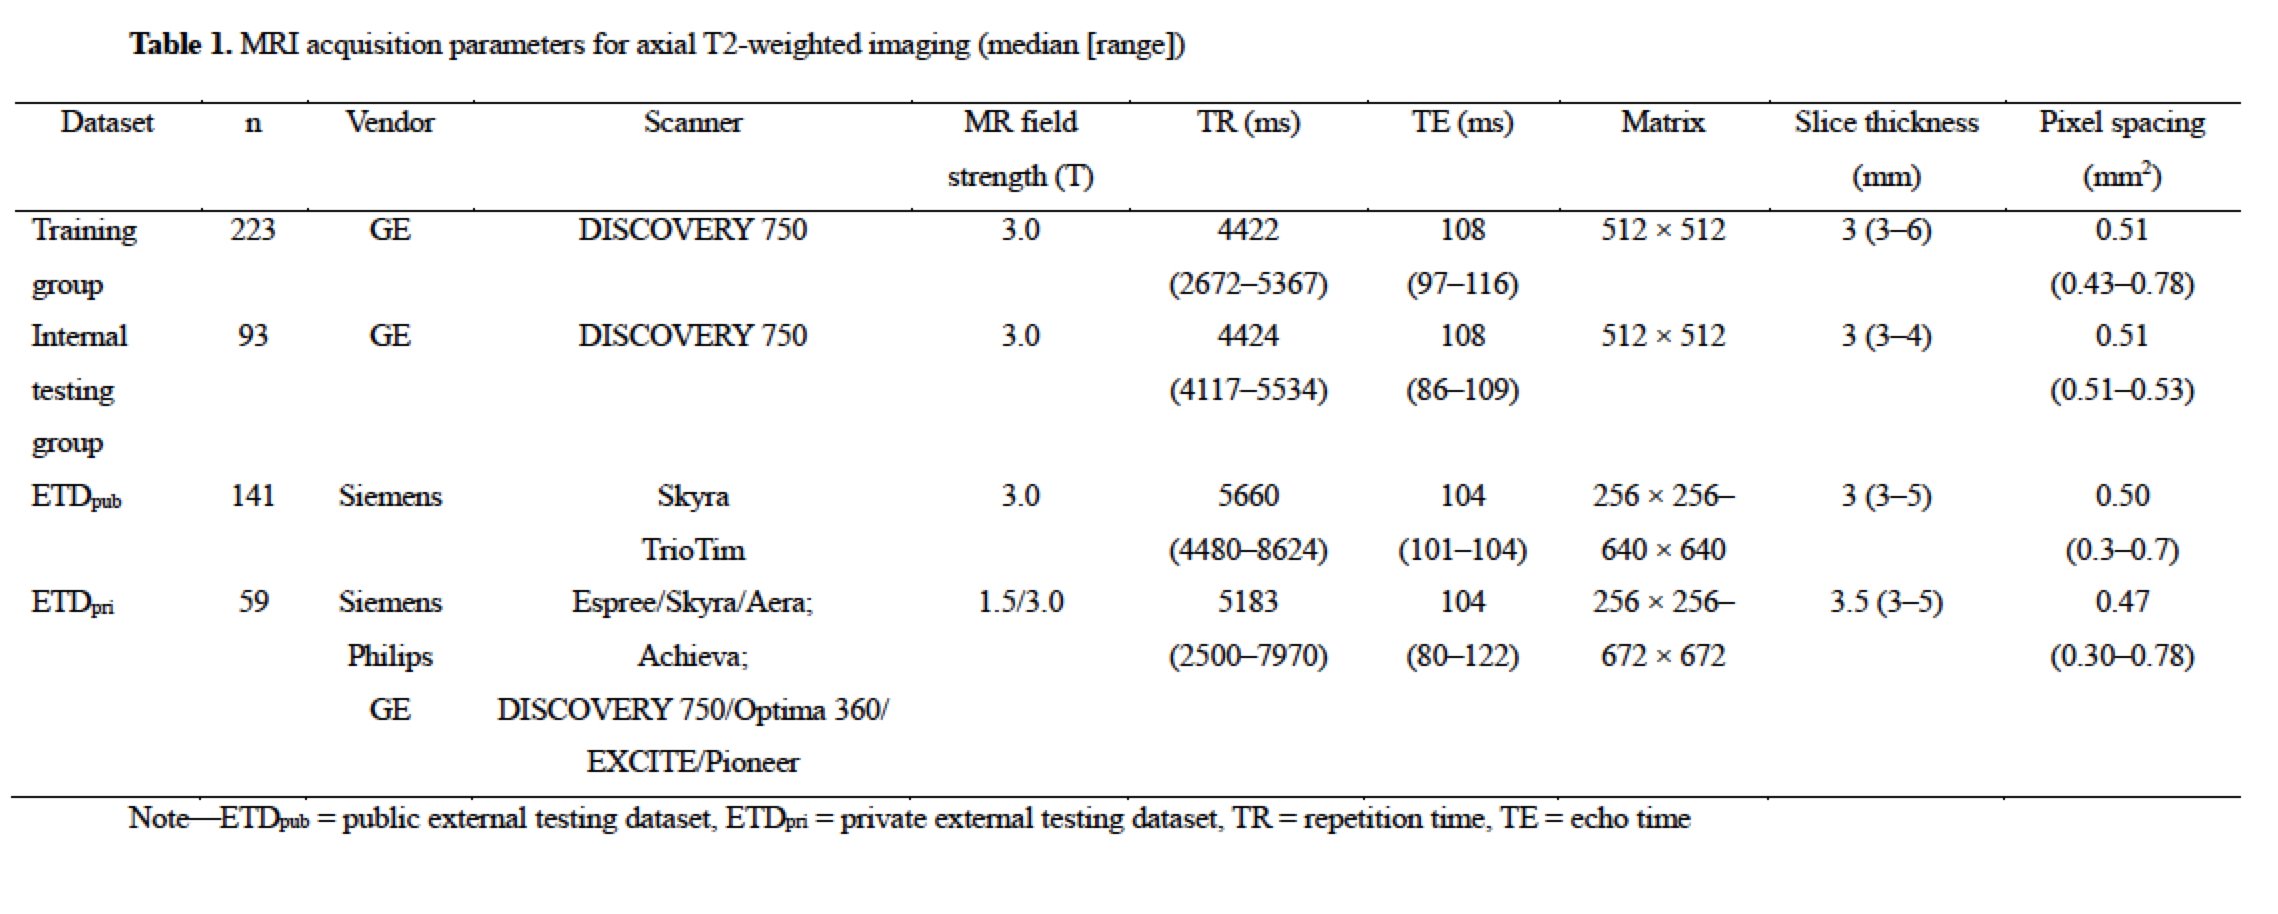
Treatment-naive patients who had undergone multiparametric prostate MRI and subsequent biopsy at our institution between November 2014 and December 2018 were retrospectively enrolled. A total of 316 patients were finally included and divided into a training-validation group (n = 223) and an internal testing group (n = 93) based on their examination time of MRI. Two external testing groups, one public and one private, were employed in this study. The public external testing dataset (ETDpub, n = 141) used the testing group of the PROSTATEx Challenge available from The Cancer Imaging Archive 9, 10. The private external testing dataset (ETDpri, n = 59) collected patients from two different centers. Figure 1 shows the datasets selection process of this study. The detailed MRI acquisition parameters of each group were presented in Table 1. The 3D U-Net–based prostate zonal segmentation model was trained by self-configuring nnU-Net framework 11. To demonstrate the U-Net model’s clinical utility, the model was compared with a junior radiologist for prostate zonal segmentation. The junior radiologist manually segmented the CG and PZ on 50 randomly selected cases from ETDpub. To analyze factors influencing the model’s auto-segmentation performance in the external testing dataset, we collected the clinicopathological data, prostate morphology features, and MR acquisition parameters of patients in the ETDpri. We calculated the DSC, 95th Hausdorff distance (95HD), and average boundary distance (ABD) to evaluate the performance of our 3D U-Net model. A multivariate beta regression analysis was used to model the DSC for CG and PZ segmentation according to various influencing factors 12. The volume variability between U-Net and ground truth, and between junior radiologist and ground truth, was calculated using the intraclass correlation coefficient (ICC).Results
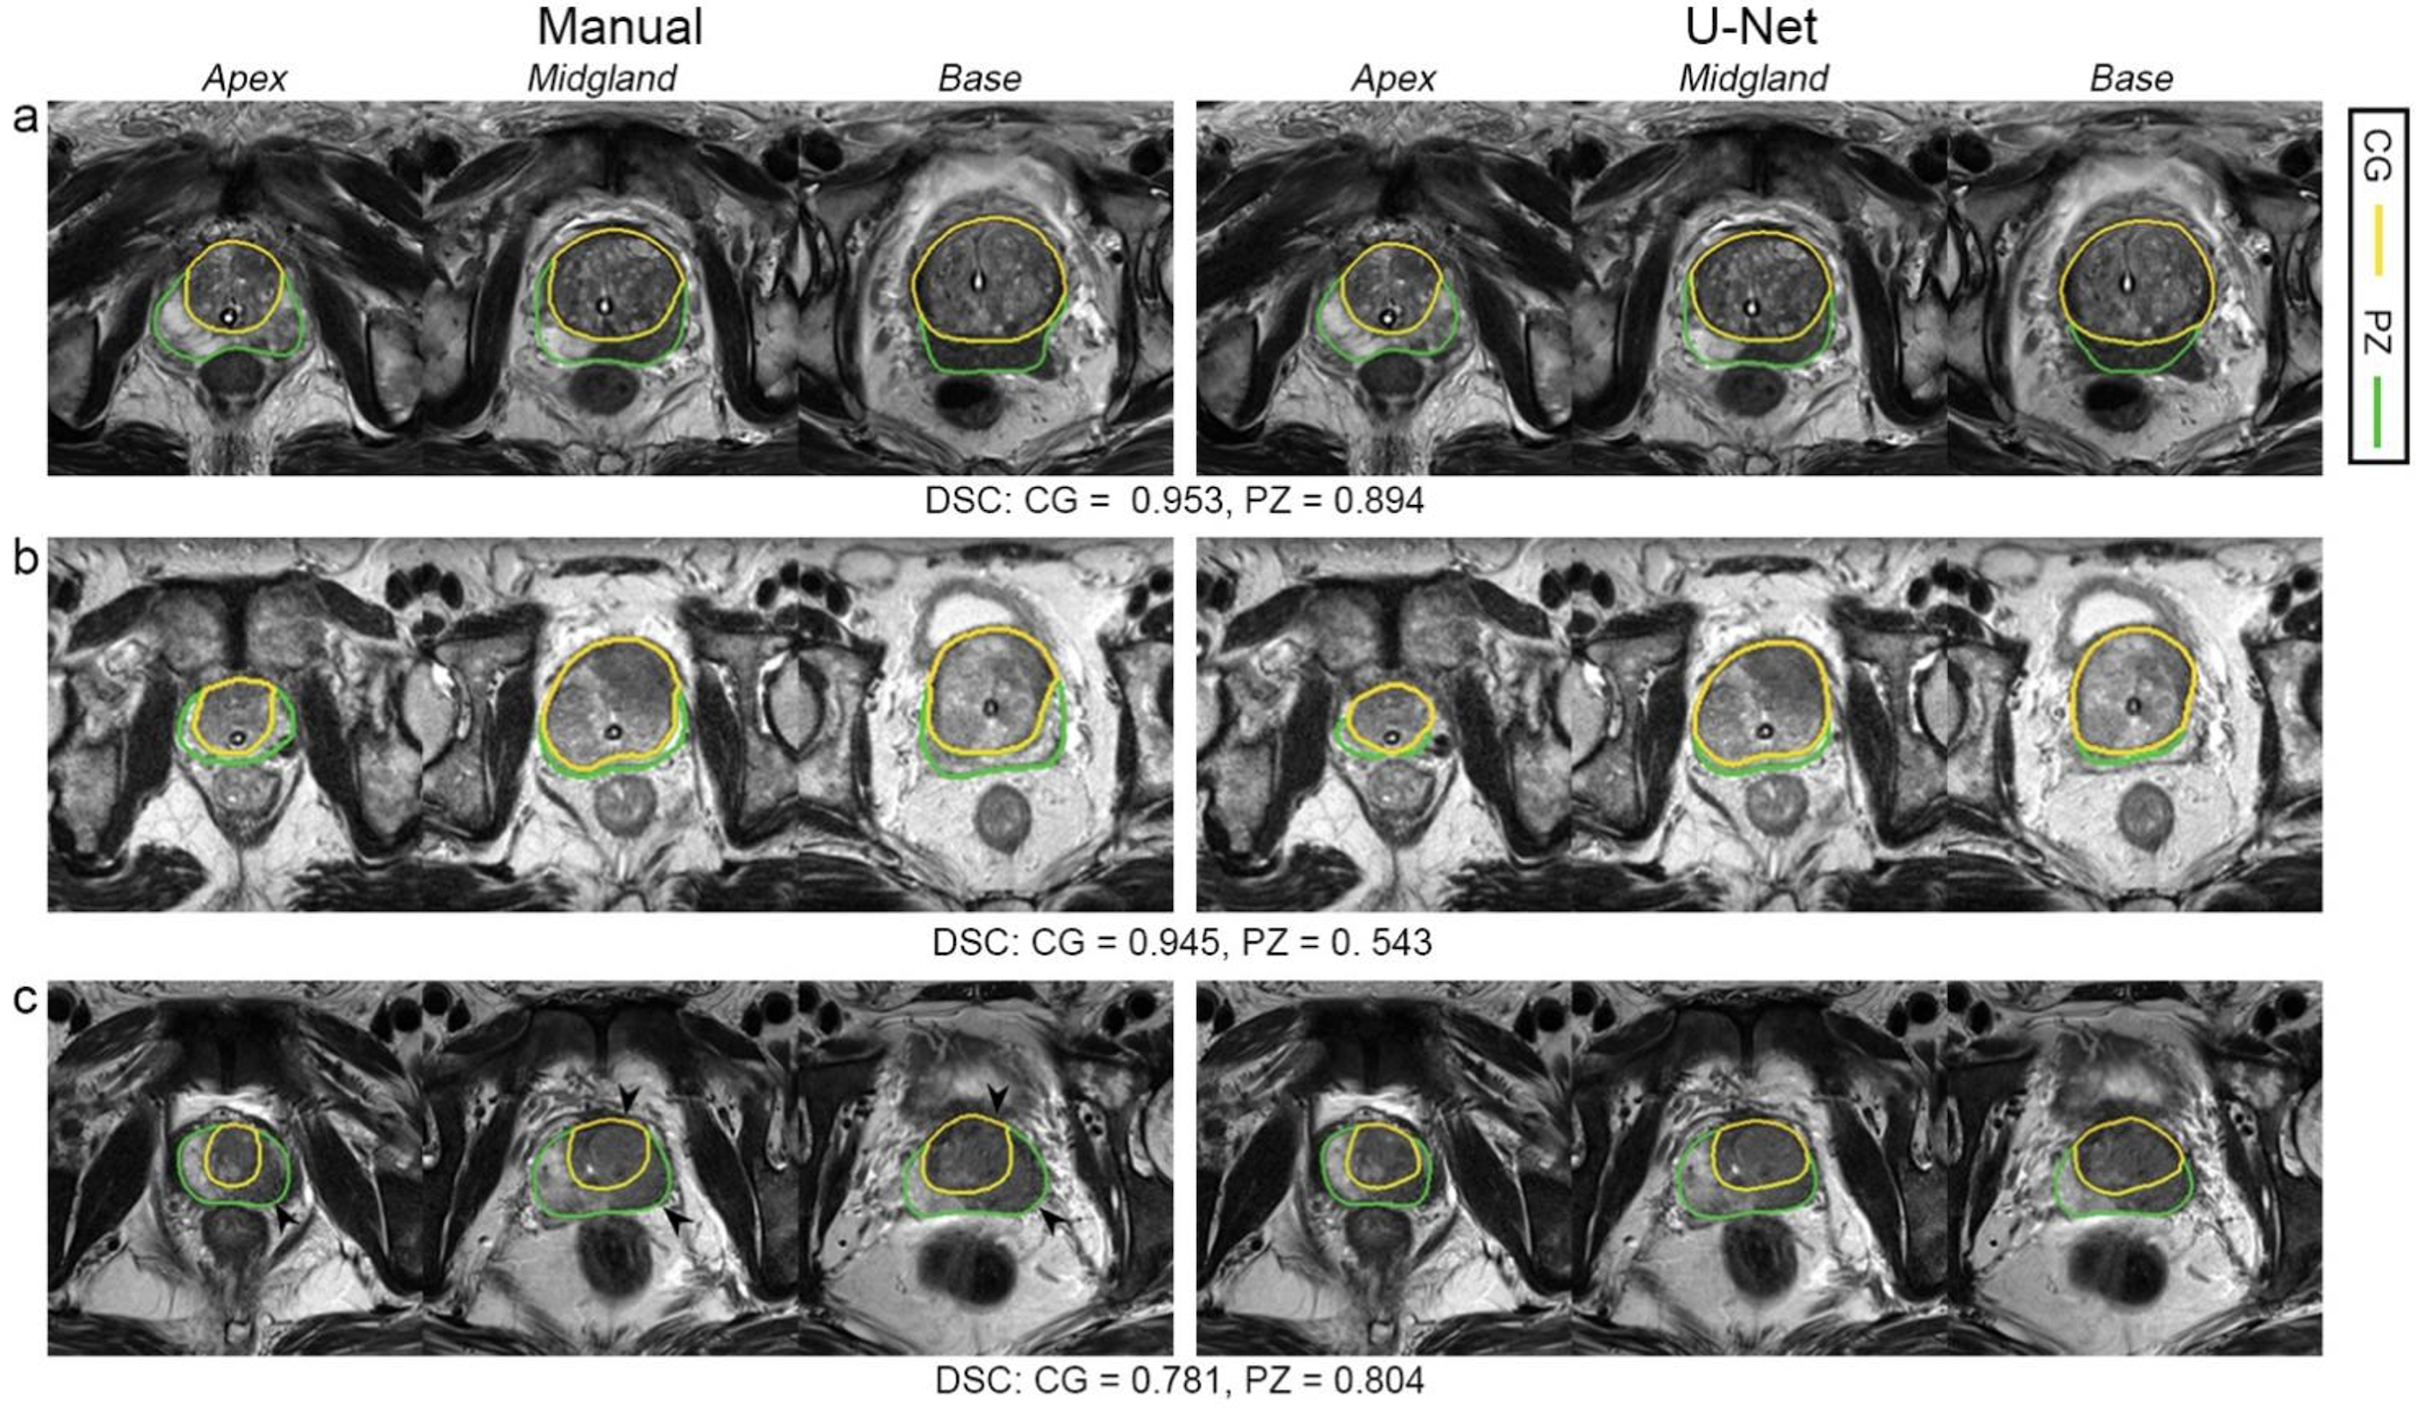
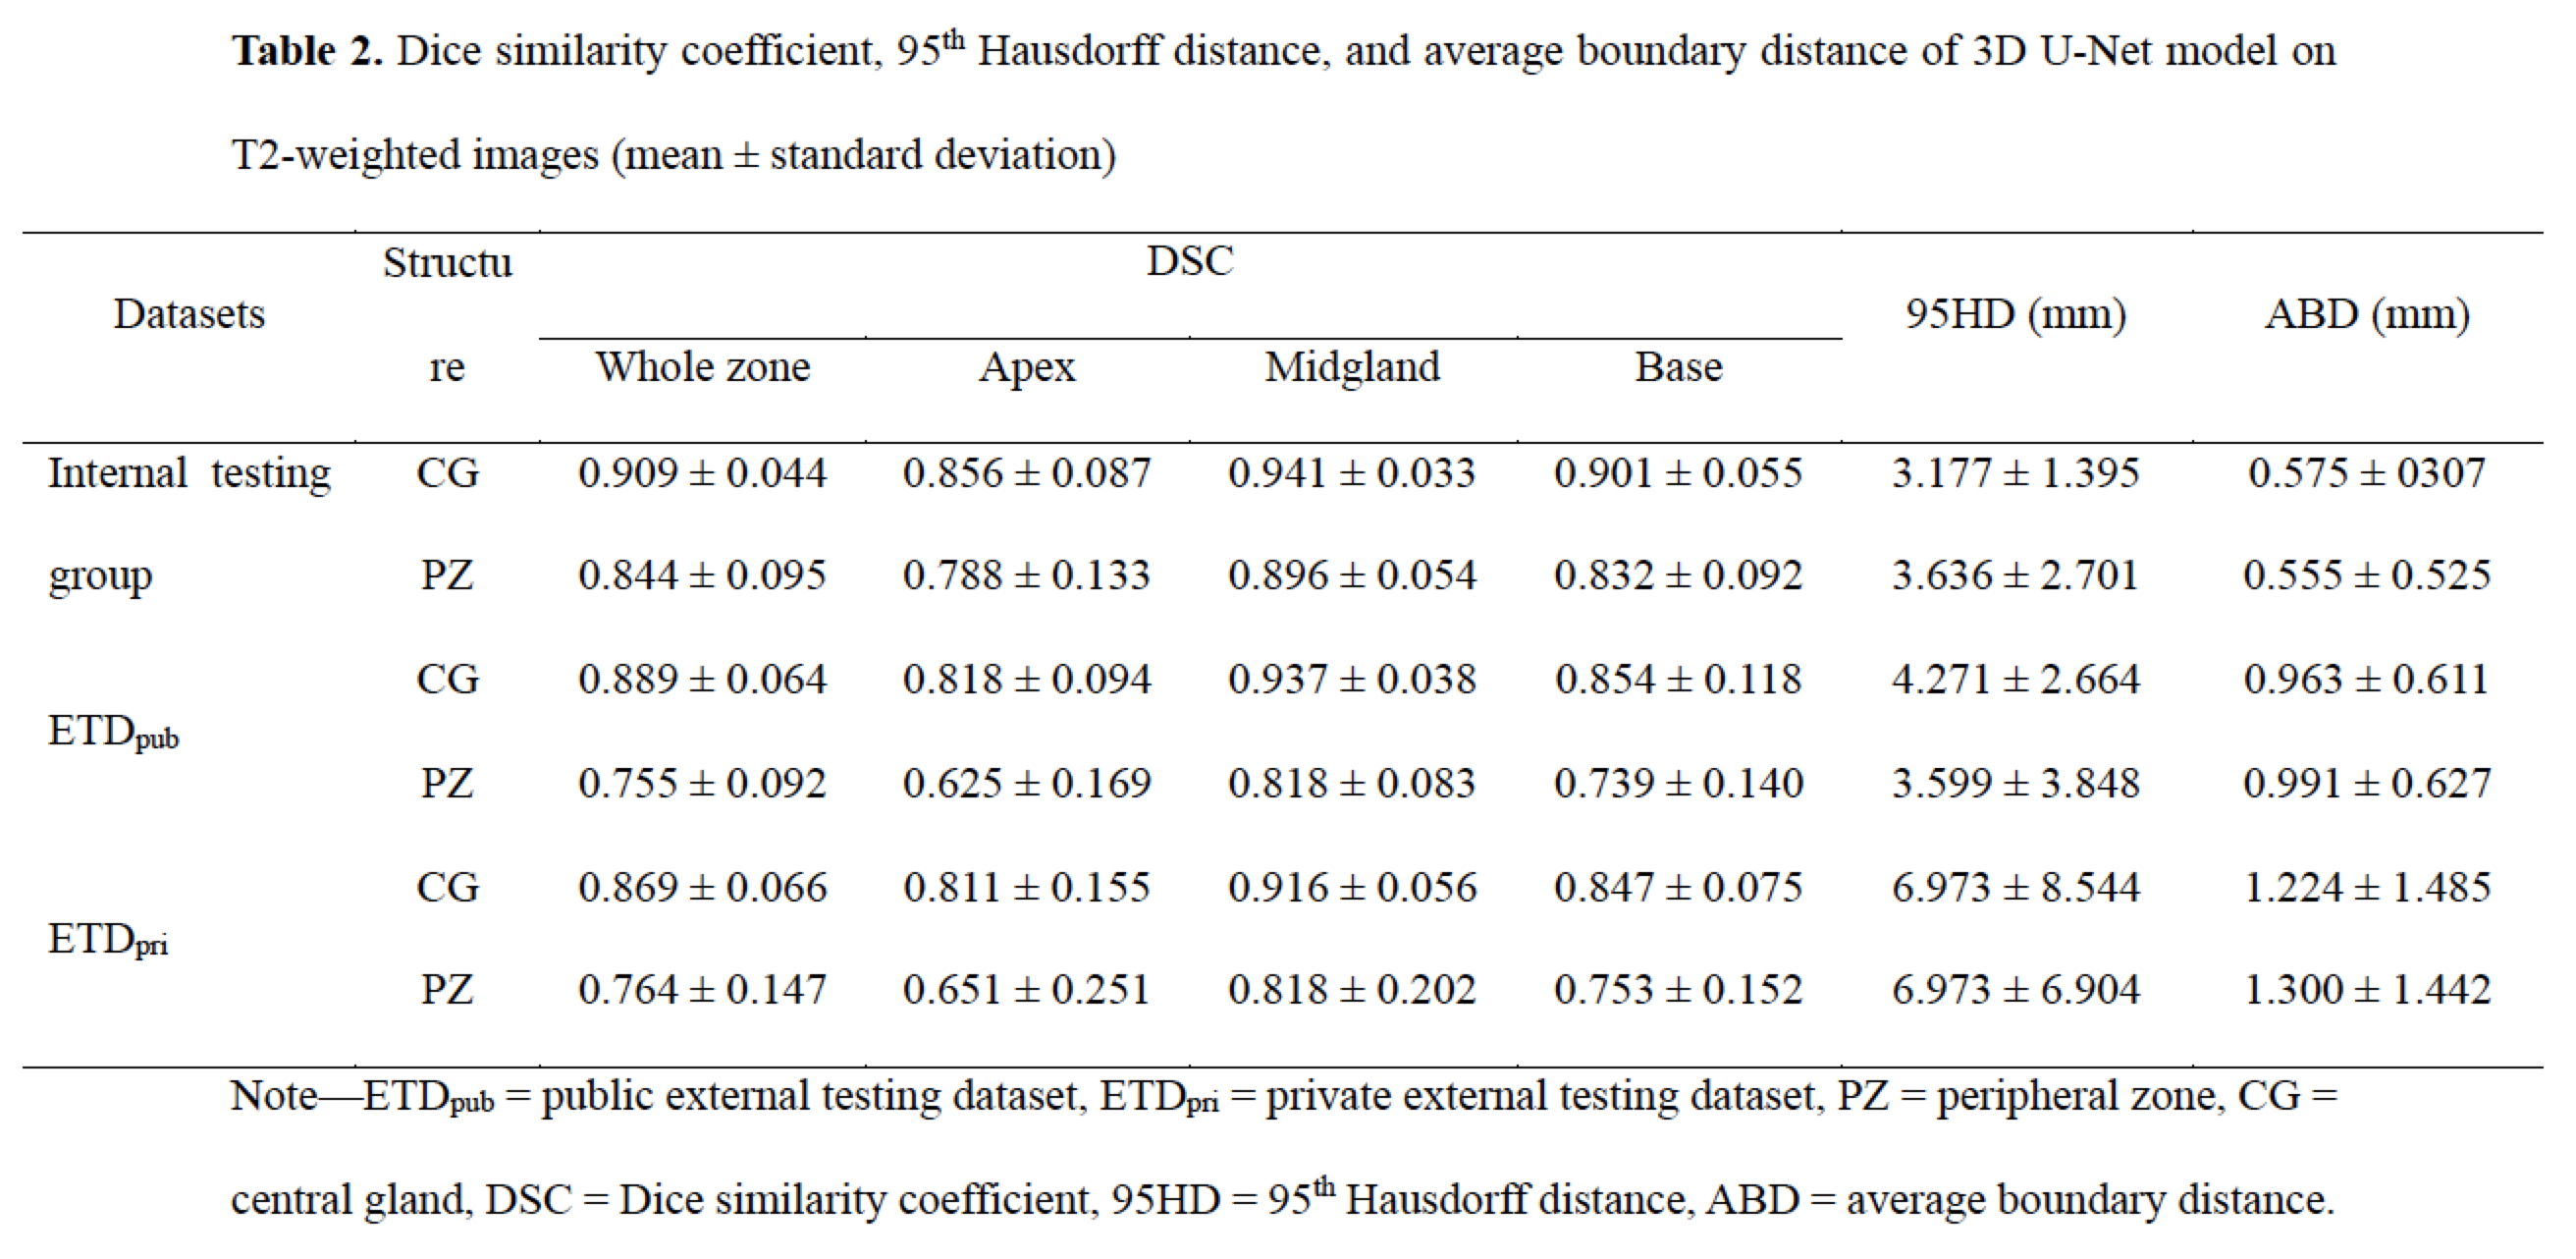
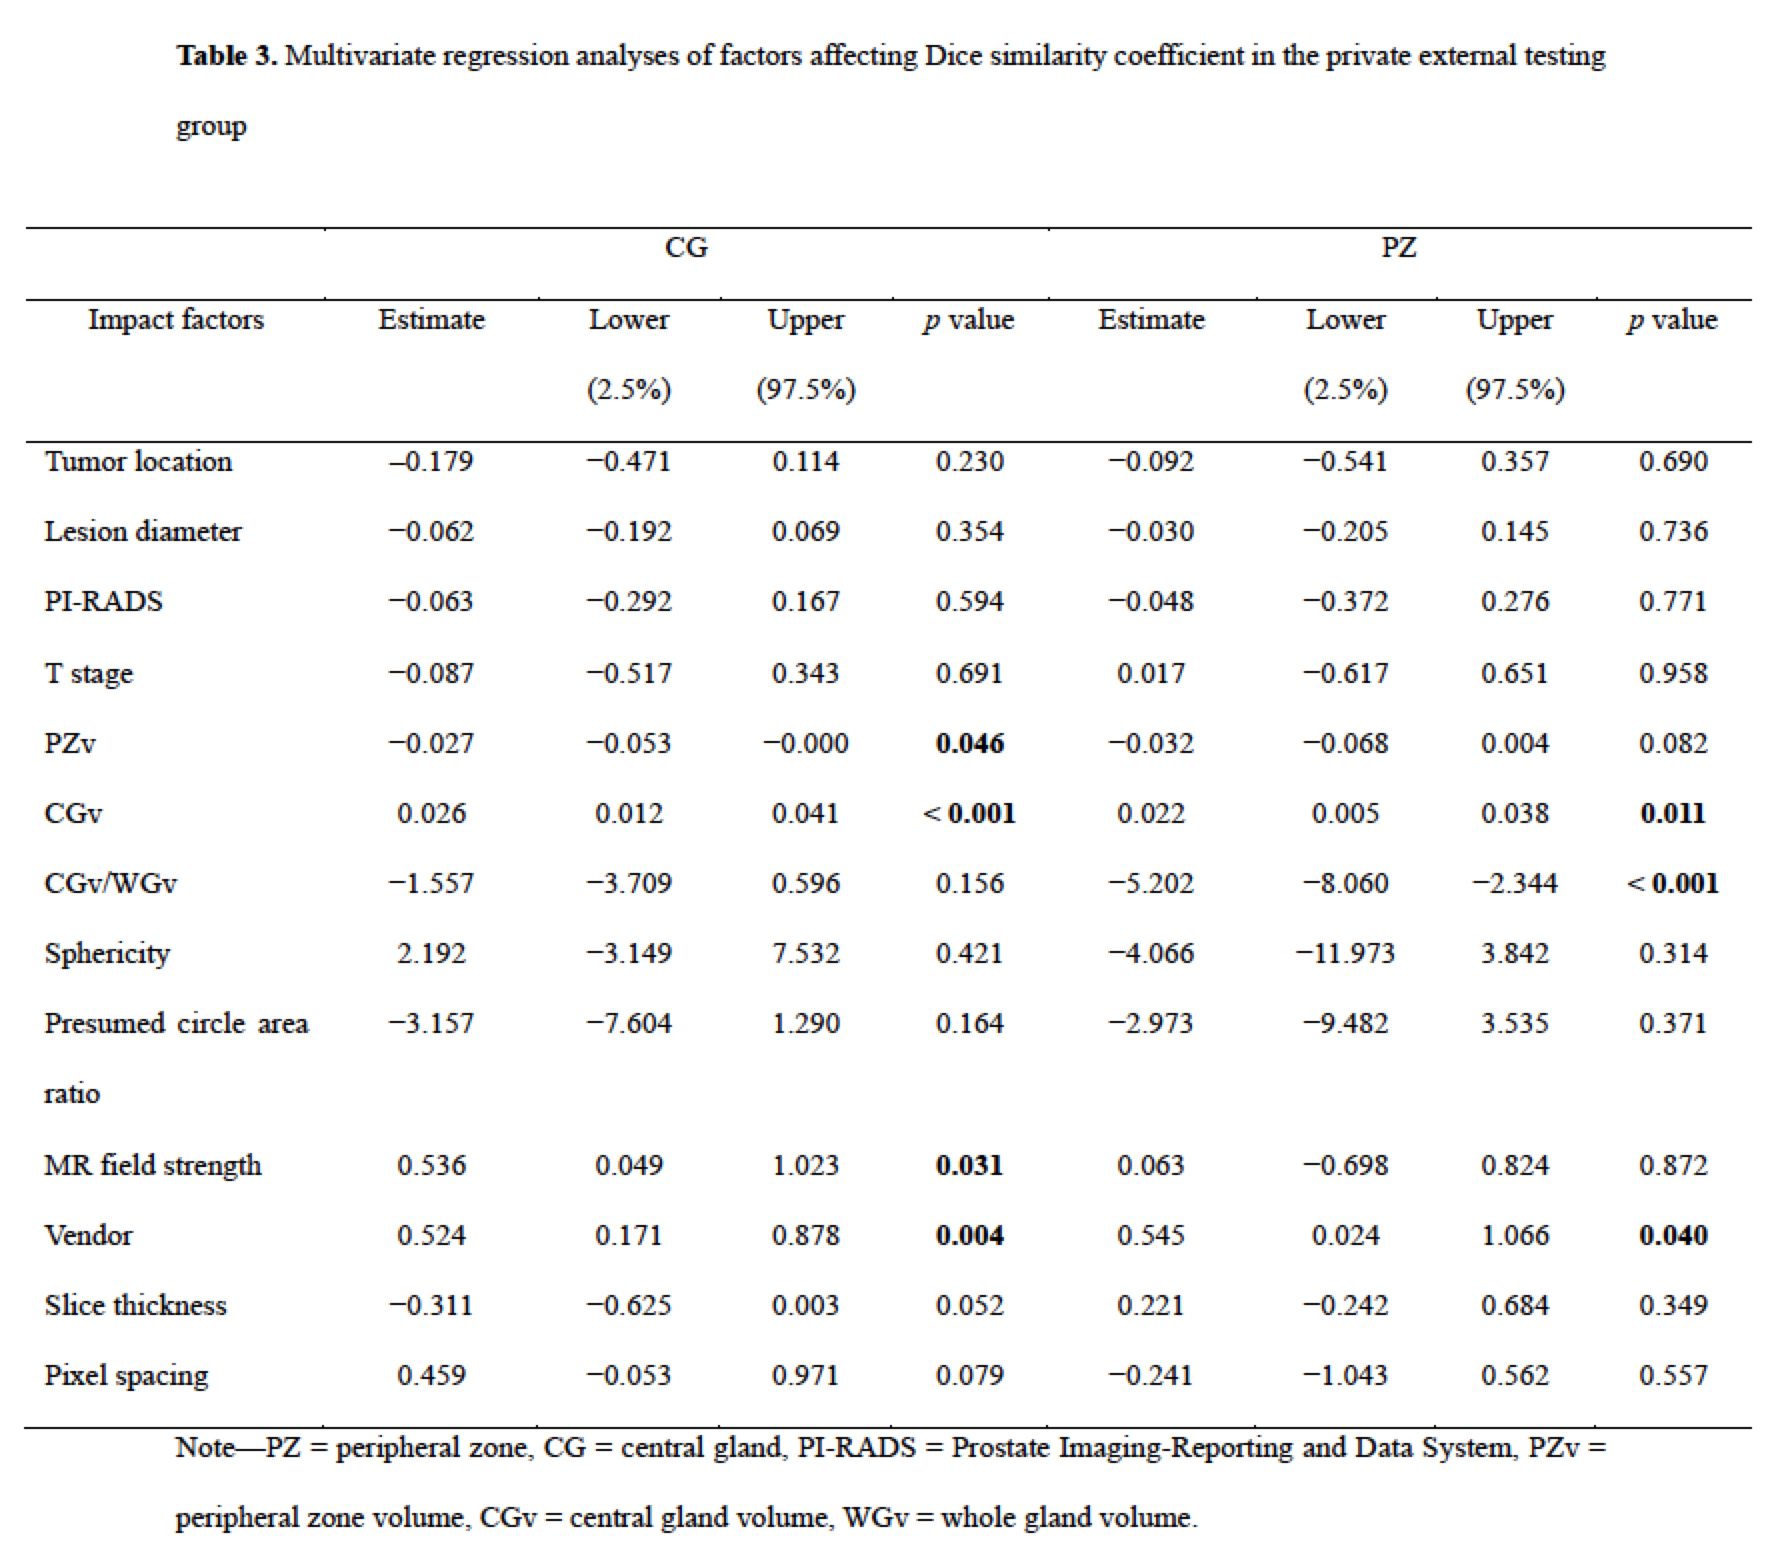
The mean DSCs of U-Net for CG in the internal testing group, ETDpub, and ETDpri were 0.909, 0.889, and 0.869, respectively, while the DSCs for PZ were lower with values of 0.844, 0.755, and 0.764, respectively. As shown in Table 2, The mean 95HD and ABD were less than 7.0 mm and 1.3 mm for both zones. For both PZ and CG, the U-Net showed better performance in the midgland of prostate than in the base and the apex among the three testing groups. The U-Net model showed comparable performance with the junior radiologist in CG countering (DSC: 0.883 vs. 0.868, p = 0.149), but significantly better performance in PZ countering (DSC: 0.769 vs. 0.706, p < 0.001). As for prostate zonal volume estimation, the U-Net model had higher agreement with the ground truth than the junior radiologist for PZ (ICC: 0.836 vs. 0.668) but showed slightly lower agreement for CG (ICC: 0.953 vs. 0.985). Multivariate regression analysis showed that CG volume and MR vendor were significant influencing factors for both CG (p = 0.046 and 0.004) and PZ segmentation (p = 0.011 and 0.040) (Table 3). Figure 2 illustrates the effect of prostate morphology on the U-Net auto-delineation performance.Discussion
Zonal segmentation is important in the management of prostatic diseases. Many studies have demonstrated the feasibility of training CNN models for zonal segmentation. However, they lack validation in non-public datasets and consideration of the patients’ characteristics. The application performance in patient cohorts with different clinicopathological characteristics remains unknown. Moreover, factors influencing the segmentation performance have rarely been investigated. In this study, we trained a 3D U-Net model for prostate zonal segmentation, and applied two external testing datasets to assess its clinical utility in different patient cohorts. The model yielded good performance in all the testing groups and outperformed the junior radiologist for PZ segmentation with higher DSC and ICC for volume estimation. The model performance was demonstrated to be susceptible to the prostate morphology and MR scanner parameters.Conclusion
The 3D U-Net model showed good performance for CG and PZ auto-segmentation in all the testing groups and outperformed the junior radiologist for PZ segmentation. The model performance was susceptible to prostate morphology and MR scanner parameters.Acknowledgements
No acknowledgement found.References
1. Weinreb JC, Barentsz JO, Choyke PL, Cornud F, Haider MA, Macura KJ, et al. PI-RADS Prostate Imaging - Reporting and Data System: 2015, Version 2. European urology 2016;69:16-40.
2. Hamzaoui D, Montagne S, Granger B, Allera A, Ezziane M, Luzurier A, et al. Prostate volume prediction on MRI: tools, accuracy and variability. European radiology 2022;32:4931-41.
3. Montagne S, Hamzaoui D, Allera A, Ezziane M, Luzurier A, Quint R, et al. Challenge of prostate MRI segmentation on T2-weighted images: inter-observer variability and impact of prostate morphology. Insights Imaging 2021;12:71.
4. Adams LC, Makowski MR, Engel G, Rattunde M, Busch F, Asbach P, et al. Prostate158 - An expert-annotated 3T MRI dataset and algorithm for prostate cancer detection. Comput Biol Med 2022;148:105817.
5. Zabihollahy F, Schieda N, Krishna JS, Ukwatta E. Automated segmentation of prostate zonal anatomy on T2-weighted (T2W) and apparent diffusion coefficient (ADC) map MR images using U-Nets. Med Phys 2019;46:3078-90.
6. Lee DK, Sung DJ, Kim CS, Heo Y, Lee JY, Park BJ, et al. Three-Dimensional Convolutional Neural Network for Prostate MRI Segmentation and Comparison of Prostate Volume Measurements by Use of Artificial Neural Network and Ellipsoid Formula. AJR American journal of roentgenology 2020;214:1229-38.
7. Hamzaoui D, Montagne S, Renard-Penna R, Ayache N, Delingette H. Automatic zonal segmentation of the prostate from 2D and 3D T2-weighted MRI and evaluation for clinical use. Journal of medical imaging (Bellingham, Wash) 2022;9:024001.
8. Nai YH, Teo BW, Tan NL, Chua KYW, Wong CK, O'Doherty S, et al. Evaluation of Multimodal Algorithms for the Segmentation of Multiparametric MRI Prostate Images. Comput Math Methods Med 2020;2020:8861035.
9. Clark K, Vendt B, Smith K, Freymann J, Kirby J, Koppel P, et al. The Cancer Imaging Archive (TCIA): maintaining and operating a public information repository. J Digit Imaging 2013;26:1045-57.
10. Geert Litjens OD, Jelle Barentsz, Nico Karssemeijer, and Henkjan Huisman. ProstateX Challenge data. In: Archive TCI, editor. 2017.
11. Isensee F, Jaeger PF, Kohl SAA, Petersen J, Maier-Hein KH. nnU-Net: a self-configuring method for deep learning-based biomedical image segmentation. Nat Methods 2021;18:203-11.
12. Rouviere O, Moldovan PC, Vlachomitrou A, Gouttard S, Riche B, Groth A, et al. Combined model-based and deep learning-based automated 3D zonal segmentation of the prostate on T2-weighted MR images: clinical evaluation. European radiology 2022;32:3248-59.
Figures