4441
Toward Assessment of Renal Tubule Volume Fraction in Rat Kidney Using Decomposition of Parametric T2 Mapping1Berlin Ultrahigh Field Facility (B.U.F.F.), Max Delbrück Center for Molecular Medicine in the Helmholtz Association (MDC), Berlin, Germany, 2Hasso Plattner Institute for Digital Engineering, University of Potsdam, Potsdam, Germany, 3Institute of Translational Physiology, Charité – Universitätsmedizin, Berlin, Germany, 4Experimental and Clinical Research Center, a joint cooperation between the Charité Medical Faculty and the MAX Delbrück Center for Molecular Medicine in the Helmholtz Association, Berlin, Germany
Synopsis
Keywords: Kidney, Preclinical
Increased incidence of kidney diseases is a concern, for which rapid biomarkers are lacking. Changes in tubule volume fraction (TVF) is a potential biomarker for kidney disease. T2-mapping may be useful to asses TVF in noninvasive manner. To study this, we developed a protocol tailored for T2-mapping of the rat kidney, and determined a suitable numerical solution for multi-exponential decomposition of the T2-decay. Evaluation and validation of these algorithms using synthetic data and phantom showed an accuracy of 98%. This demonstrates that our approach is promising for research into quantitative assessment of renal TVF in in vivo applications.
Purpose:
Increased incidence of kidney diseases is a substantial global concern and current biomarkers and existing treatment options are unsatisfactory. Change in renal tubule luminal volume fraction (TVF) is a potential rapid biomarker for kidney disease1, and may also be valuable for gaining a better mechanistic understanding of renal (patho-)physiology2,3,4. T2 mapping is an established MRI technique that can be used for quantifying changes in the tissue water fraction in vivo, and may provide a tool to probe renal tissue properties noninvasively. The ultimate aim of this work is to determine the TVF in the rat kidney from MRI using T2 mapping, by applying multiexponential analysis of the T2 driven signal decay to examine the micro-morphological and physiological changes in renal tissue. In order to achieve this goal, we developed a protocol tailored for T2 mapping of the rat kidney, and determined a suitable numerical solution for multi-exponential decomposition of the T2-decay based on linformation from iterature and numerical algorithms. We evaluated and validated protocol and algorithms using synthetic data and measurements in purpose-built phantoms.Methods:
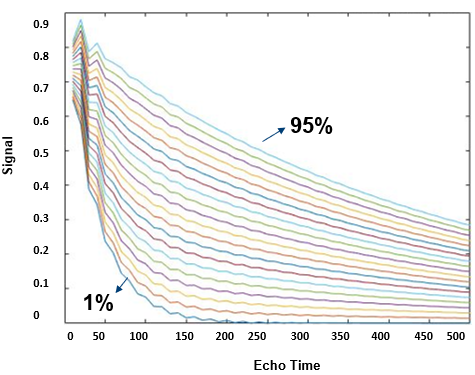
Tubular fluid, which originates from ultrafiltration in the glomeruli, has a substantially longer T2 compared to the renal parenchyma. Therefore, the tubular contribution to the signal should be separable from the tissue signal by nonlinear least squares regression. To improve the robustness of the regression, bisquare weights5 were applied, which minimizes a weighted sum of squares, such that the weight given to each data point depends on how far the point is from the fitted line. The numerical solution for multi-exponential decomposition was done using MATLAB functions. The algorithm was evaluated using synthetic data simulations and measurements in phantoms. We developed a 2-compartment-model based on Bloch-simulations toolkit (Brian.A. Hargreaves) to estimate the actual T2 echo modulation curve in a multi-spin-echo experiment. Simulations were repeated for a range of T2 and SNR, yielding a database of simulated T2, which was then used to identify the T2 value that most closely matched the experimentally measured data at each voxel (See example Figure1). Gaussian distributed white noise, was applied to the signal, such that the signal-to-noise ratio SNR =mean(s)/σ, is similar to the noise found in the magnitude images acquired during in vivo experiments. A full dictionary of simulated T2 decay curves was acquired by repeating the simulations, each time with a different: T2=[5:5:50,60,70:15:100,120,140:25:190,220,250:35:320,360,420,500];T1=[1400,1500,1720,1850], TR =[400,500:200:1500,1800:300:3000],flipAng=(120°to180°,with2°increments),echo-spacing=[5:10,12,13,15,16,18:2:38,41:3:50],SNR=[5,10,20,30,50,80,120,180,270,400,600,900] tubule fraction scale (0% to 95%, with 5% increments). A novel phantom was designed to mimic realistic changes of TVF in the rat kidney. The housing was designed using Autodesk Fusion 360 and printed in a cylinder on a 3D-Printer (Dimension 1200es). Pure water was used for comparison. Water doped with MnCl2 and CuSO4 was used to achieve T1 and T2 times similar to the tubular fluid and the renal parenchyma. MRI data were acquired with a 2-channel volumetric transceiver RF coil on a 9.4T animal MR scanner (Biospec, Bruker BioSpin). T2 mapping was performed with a MESE-technique: TE=6.4ms, TErange= 6.4,12.8,19.2,25.6,32,38.4,44.8,51.2,57.6,64,70.4,76.8,83.2ms, slice thickness=1mm, FOV=5x5cm, matrix=240x240, resolution 0.02mm, number of averages=1 and total acquisition time=4m 0 sec for each T2 map.Results:
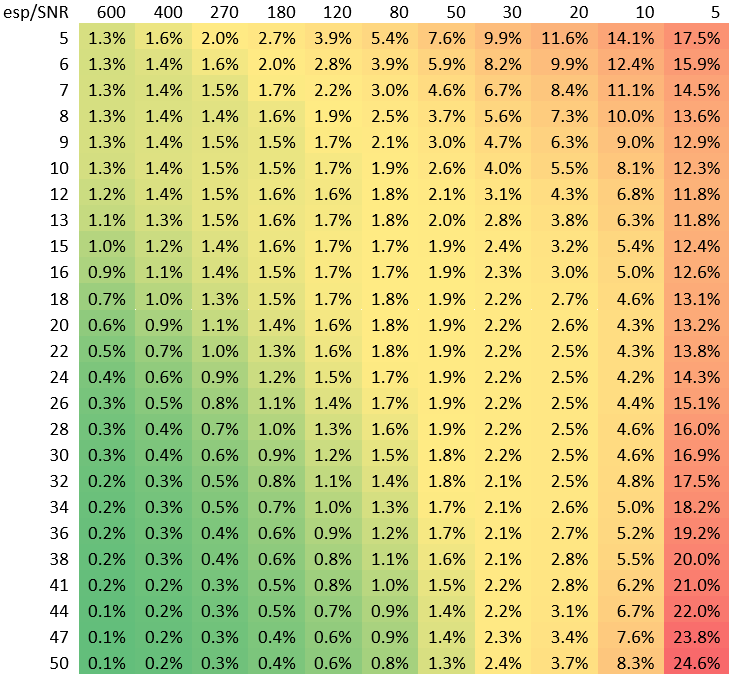
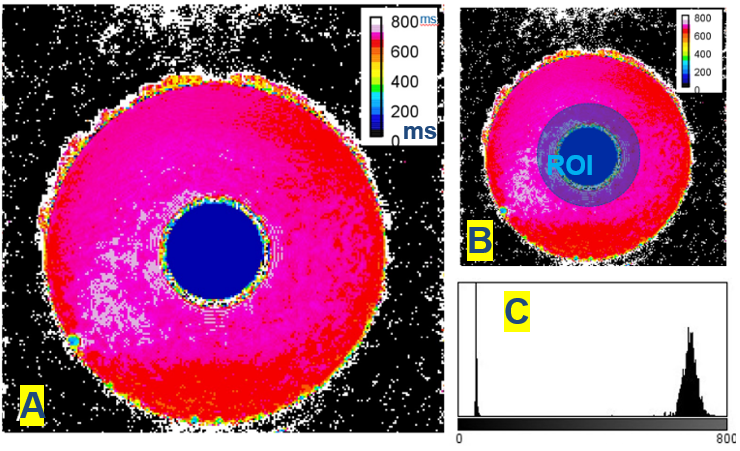
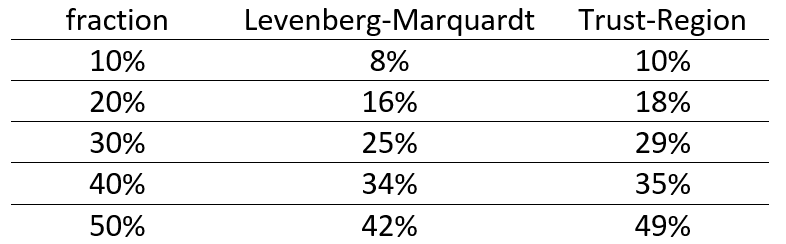
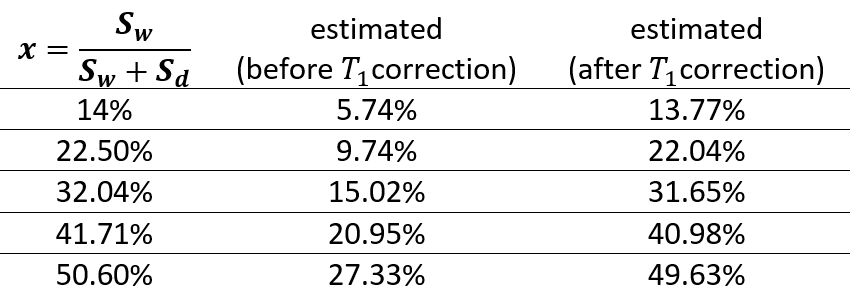
Table1 provides an example of the Mean Absolute Error (MAE) measuring TVF acquired with a modified numerical solution for multi-exponential decomposition, using the dictionary of distributed T2s with echo spacing. In addition, MAE was determined for varying volume fractions, number of echoes and flip angles. Our results demonstrate the mean error variation for (SNR=30,esp=15,T2=50ms,frac=15%,T1=500ms,flipAng=180°) was predicted to be 2.4%. An oscillation of about 2.6% was observed due to imperfect refocusing pulses. Figure2 shows a visualization of the reconstructed maps of the custom-built T1-T2 phantom; the histogram shows the T2 distribution corresponding to the selected exemplary ROI. An accuracy of 95% and 98% (Table2) was achieved with modified Levenberg-Marquardt and Trust-Region on the phantom. Table3 shows the estimated TVF after the fitting procedure (Trust-Region) before and after removing the contribution of T1.Discussion:
Since in vivo experiments are limited by the constraints of acquisition time and resolution, we applied multi-exponential decomposition on simulations of several different conditions of simulated T2 map acquisition, in order to determine the best protocol tailored for T2 mapping of the rat kidney. Application of this approach on the mechanical phantom showed that the accuracy increased gradually with increasing TVF, but the average accuracy (83.6%) was still suboptimal. Upon correction of T1 effects on signal intensity, the accuracy of our approached increased to 98.11%. Validation of initial results using a second independent measurement demonstrated excellent reproducibility.Conclusion:
Our preliminary results demonstrate that modified Trust-Region is promising for research into quantitative assessment of renal TVF in in vivo applications. Future in vivo experiments with physiologically relevant interventions (e.g. increased pressure in the renal pelvis and tubules) for altering TVF is required to further study these methods. Future validation of this MR approach with intravital microscopy, i.e. for quantitative comparison of changes in the vascular and renal tubular compartments with those observed by T2* and T2, is also warranted. Ultimately, these investigations have the potential to help uncover the hidden patterns in acute renal injury that lead to chronic kidney disease, which will improve diagnosis, prognosis and treatment of renal disorders.Acknowledgements
This work was funded in part (TN, ES, SW, TG, KC) by the German Research Foundation (Gefoerdert durch die Deutsche Forschungsgemeinschaft (DFG), Projektnummer 394046635, SFB 1365, RENOPROTECTION). We thank the MDC-Weizmann Helmholtz International Research School for Imaging and Data Science from the NAno to the MESo (iNAMES).References
1. Acute kidney injury caused by obstructive nephropathy. Chávez-Iñiguez, J. S., Navarro-Gallardo, G. J., Medina-González, R., Alcantar-Vallin, L., & García-García, G. 2020, International Journal of Nephrology.
2. How bold is blood oxygenation level‐dependent (BOLD) magnetic resonance imaging of the kidney? Opportunities, challenges and future directions. Niendorf, T., Pohlmann, A., Arakelyan, K., Flemming, B., Cantow, K., Hentschel, J., ... & Seeliger, E. 2015, Acta physiologica, Vol. 213(1), pp. 19-38.
3. Linking non‐invasive parametric MRI with invasive physiological measurements (MR‐PHYSIOL) towards a hybrid and integrated approach for investigation of acute kidney injury in rats. Pohlmann, A., Cantow, K., Hentschel, J., Arakelyan, K., Ladwig, M., Flemming, B., ... & Niendorf, T. 2013, Acta Physiologica, Vol. 207(4), pp. 673-689.
4. Continuous diffusion spectrum computation for diffusion-weighted magnetic resonance imaging of the kidney tubule system. Quantitative Imaging in Medicine and Surgery. Periquito, J. S., Gladytz, T., Millward, J. M., Delgado, P. R., Cantow, K., Grosenick, D., ... & Niendorf, T. 3098, s.l. : Quantitative Imaging in Medicine and Surgery, 2021, Vol. 11(7).
5. Dumouchel, William, and Fanny O’brien. "Integrating a robust option into a multiple regression computing environment." Computer science and statistics: Proceedings of the 21st symposium on the interface. Alexandria: American Statistical Association, 1989.
Figures