4437
A Fully Automated Hybrid Approach to Assessing Liver Fibrosis and Necroinflammation on Conventional MRI:A Multi-center Study1Jiangsu Key Laboratory of Molecular and Functional Imaging, Department of Radiology, Zhongda Hospital, School of Medicine, Southeast University, Nanjing, China, 2MR Scientific Marketing, Siemens Healthineers Ltd, Shanghai, China
Synopsis
Keywords: Liver, Radiomics, liver fibrosis
To our knowledge, this is the first study developing a multi-task hybrid models incorperating conventional MR tissue texture and routine clinical biomarkers with both good accuracy and explainability in detecting fibrosis and necroinflammation. Our study used an interactive deep learning approach to automatedly segment the entire volumetric liver contours more effectively. Our CoRC models outperformed routine clinical fibrotic scores (FIB-4, APRI), and TE-LSM by discrimination, calibration in the large multicenter cohorts. Our CoRC models could be as a potential alternative when biopsy, hepatobiliary phase (HBP) images, liver stiffness measurement (LSM) are unavailable.Introduction/Purpose
Large-scale validation of a non-invasive combined radiomics-clinic (CoRC) model for assessing fibrosis and necroinflammation remains lacking. We aimed to develop and validate a CoRC model based on conventional MRI for diagnosing clinically significant liver fibrosis (≥ F2) and necroinflammation (≥ G2).Methods
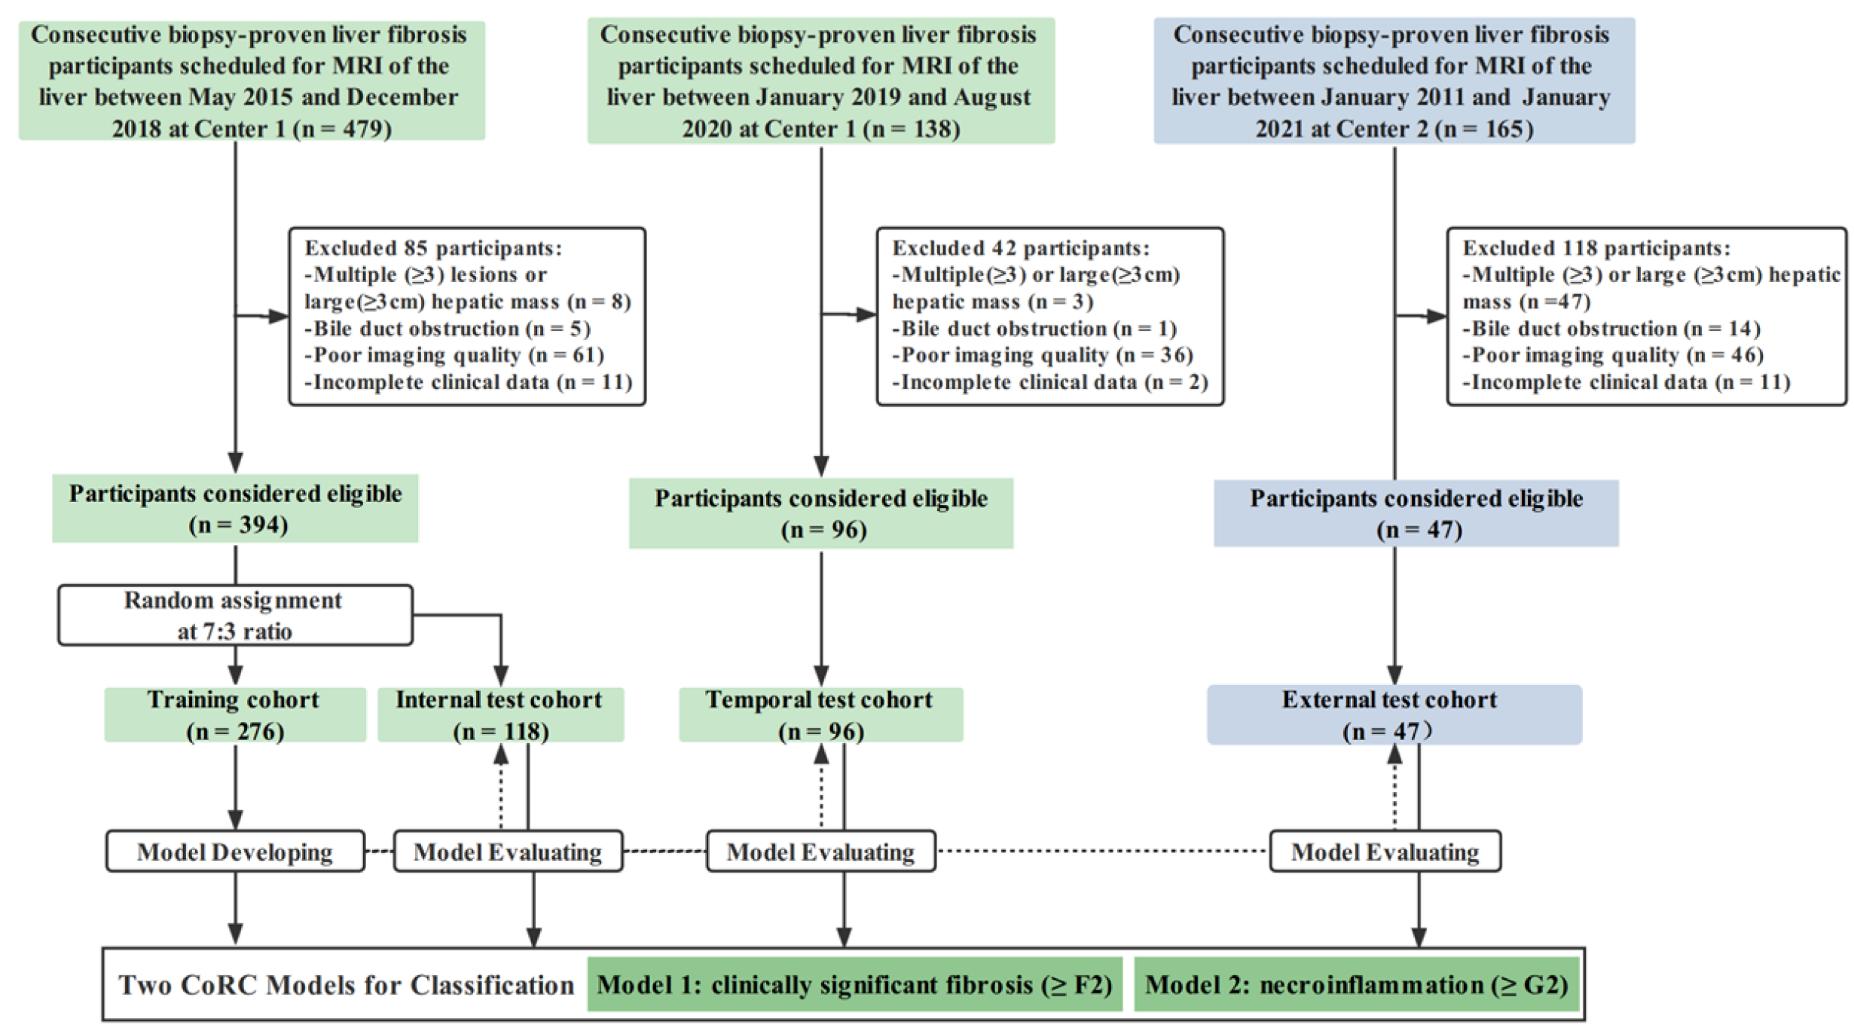
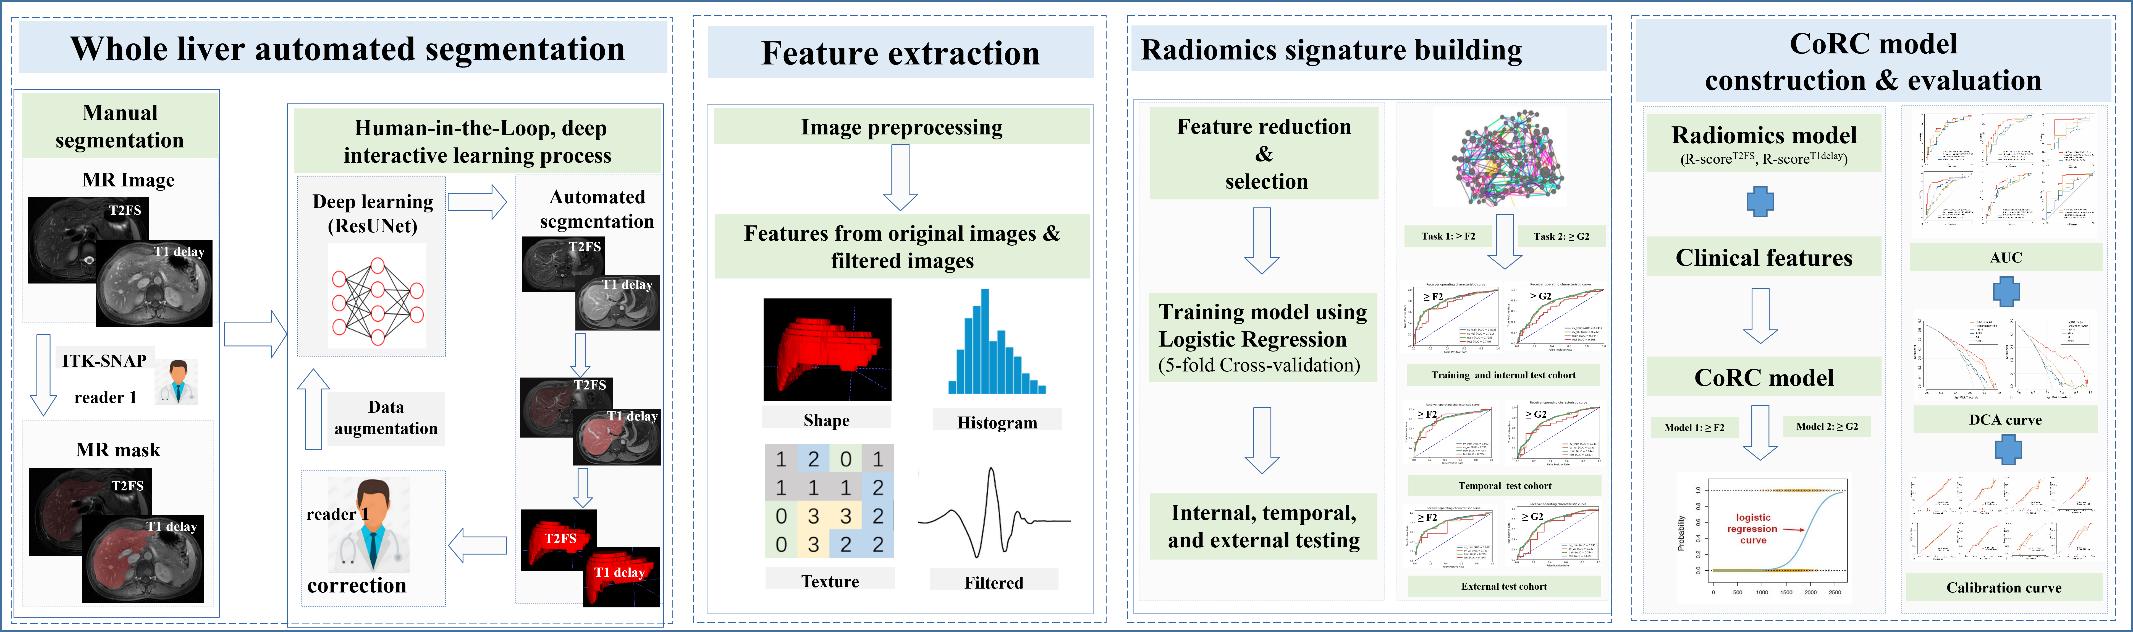
This retrospective cohort study recruited 537 patients with pathologically proven liver fibrosis and necroinflammation at center 1 from May 2015 to Aug 2020 and center 2 between Jan 2011 and Jan 2021. 394 patients were randomly allocated into training (n = 276) and internal test (n = 118) cohorts at center 1. A temporal test cohort at center 1 (n = 96) and an external test cohort from center 2 (n = 47) were used for validation. Automated entire liver segmentation used ResUNet-based Human-in-the-Loop approach. Radiomics features were extracted from the mask on fat-suppressed T2-weighted and delayed enhanced T1-weighted images separately. Radiomics signatures were generated using logistic regression. Radiomics-scores and optimal clinical biomarkers as independent risk factors were integrated into the CoRC models in the training cohort with multivariate logistic regression. Models were tested in independent cohorts. Model performances were mainly evaluated with the area under the receiver operating characteristic curves (AUCs).Result
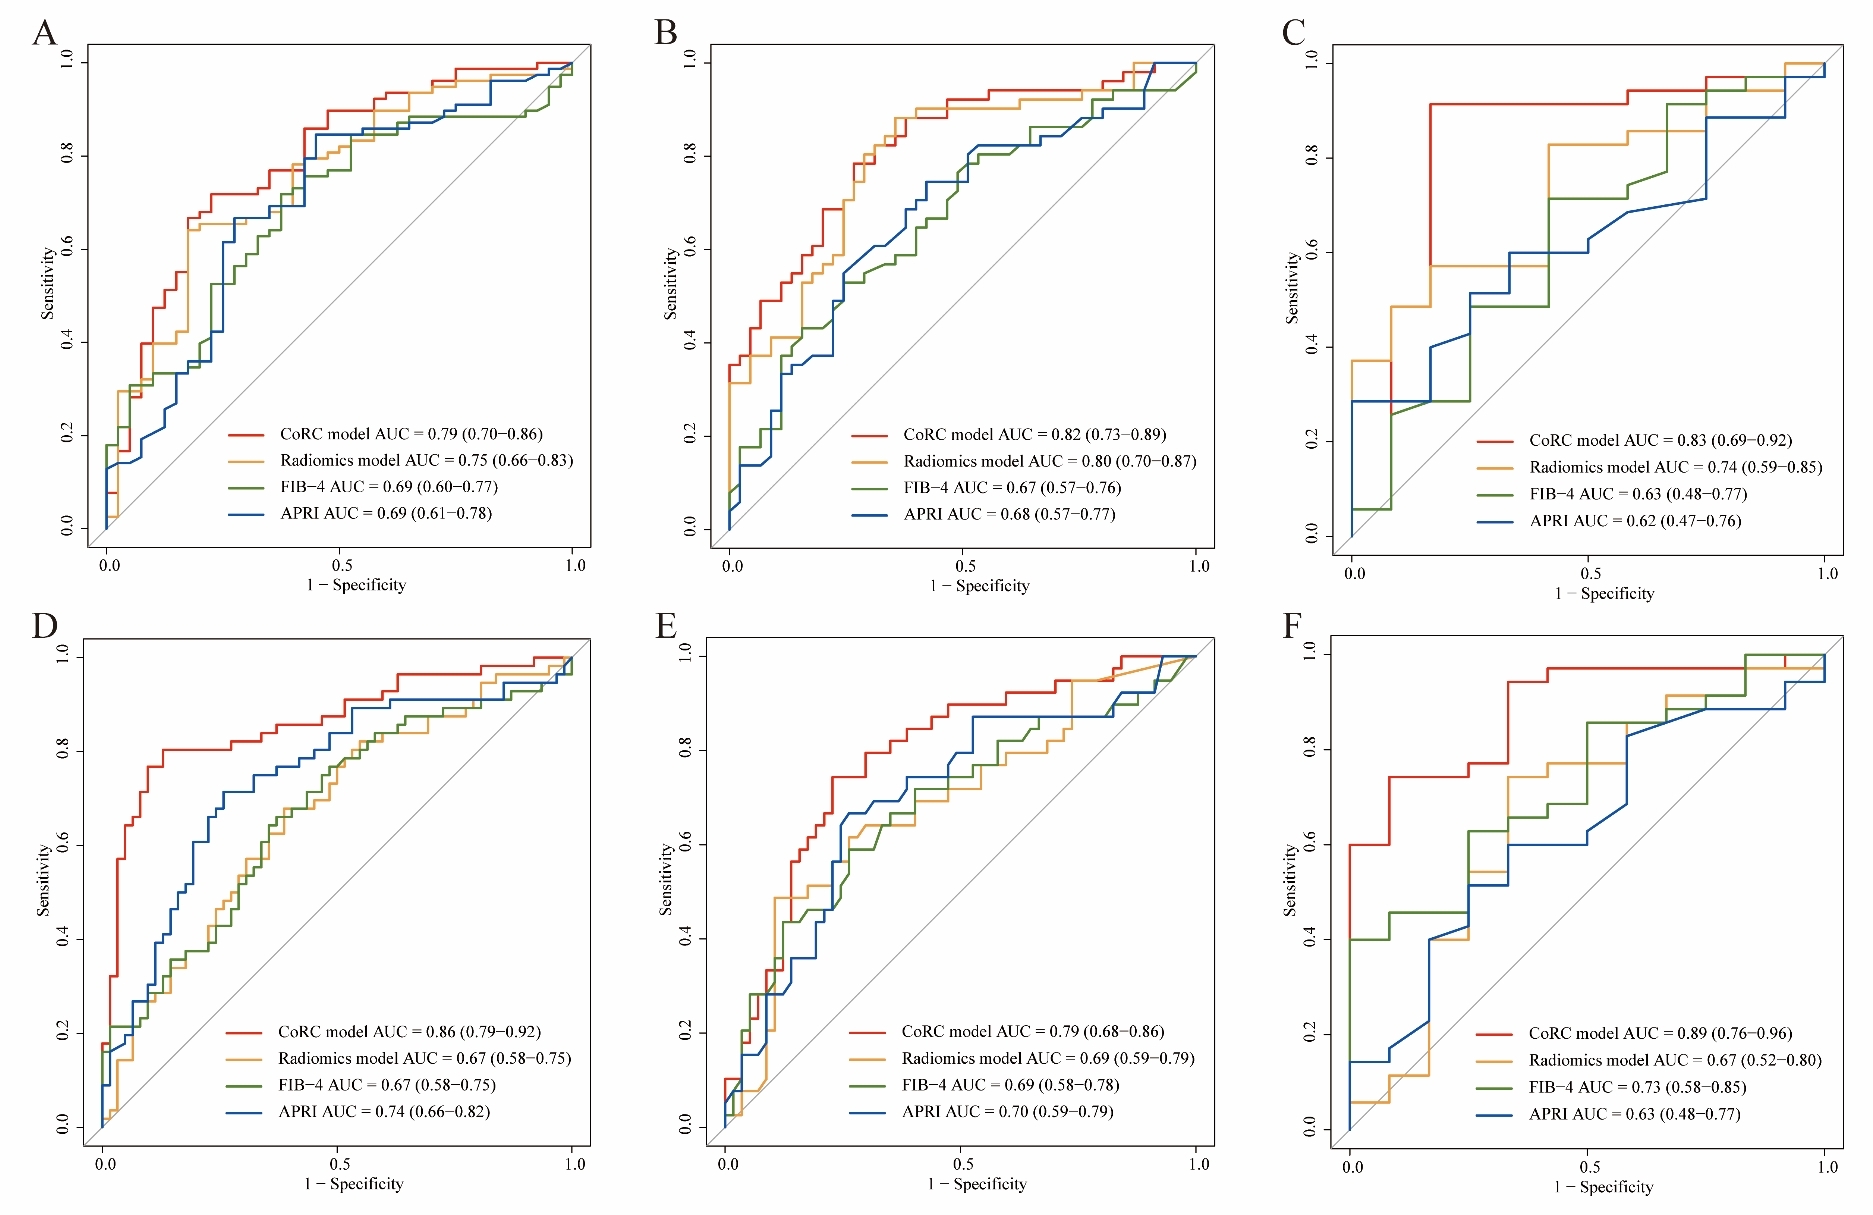
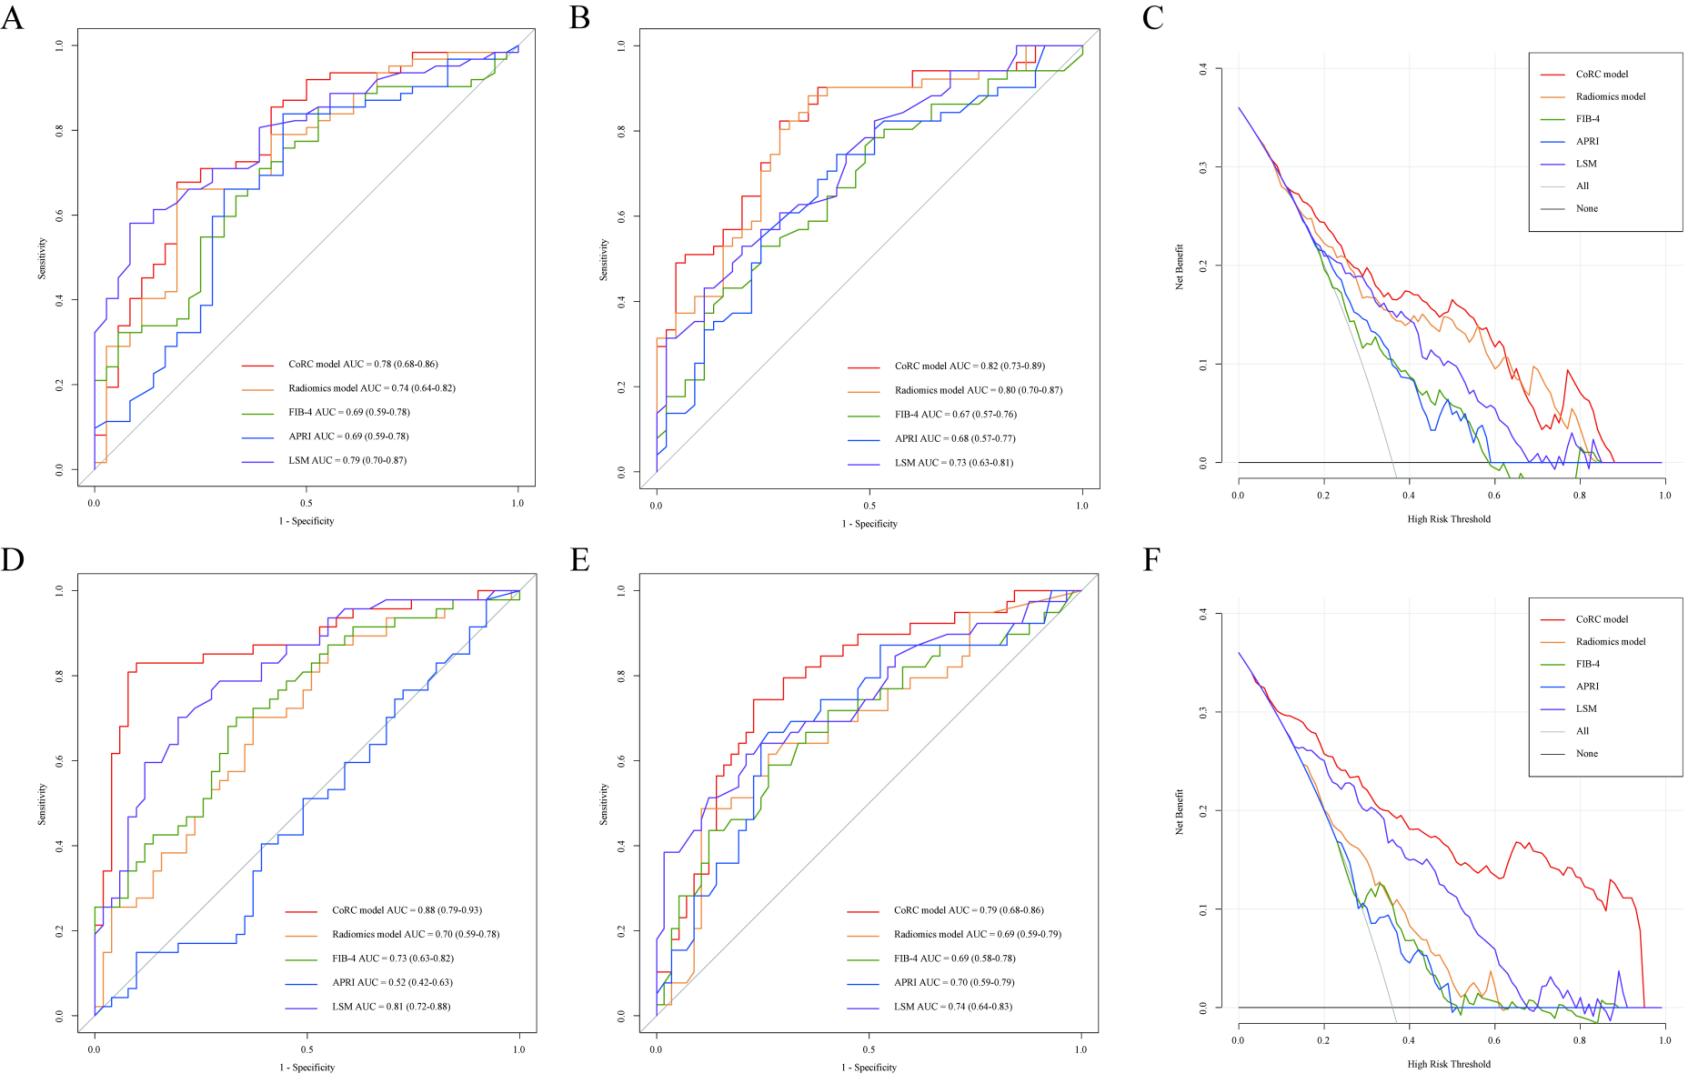
In the internal, temporal, and external test cohorts, CoRC model 1 yielded AUCs of 0.79 (95% CI: 0.70, 0.86), 0.82 (95% CI: 0.73, 0.89), and 0.83 (95% CI: 0.69, 0.92) for ≥ F2, meanwhile, CoRC model 2 showed AUCs of 0.86 (95% CI: 0.79, 0.92), 0.79 (95% CI: 0.68, 0.86), and 0.89 (95% CI: 0.76, 0.96) for ≥ G2. In internal/temporal test LSM subgroups, we compared the performance of CoRC models with TE-LSM (AUC 0.78 vs.0.79, P = 0.86 / 0.82 vs. 0.73, P = 0.14 for ≥ F2, whereas 0.88 vs. 0.81, P = 0.16 / 0.79 vs. 0.74, P = 0.49 for ≥ G2).Discussion
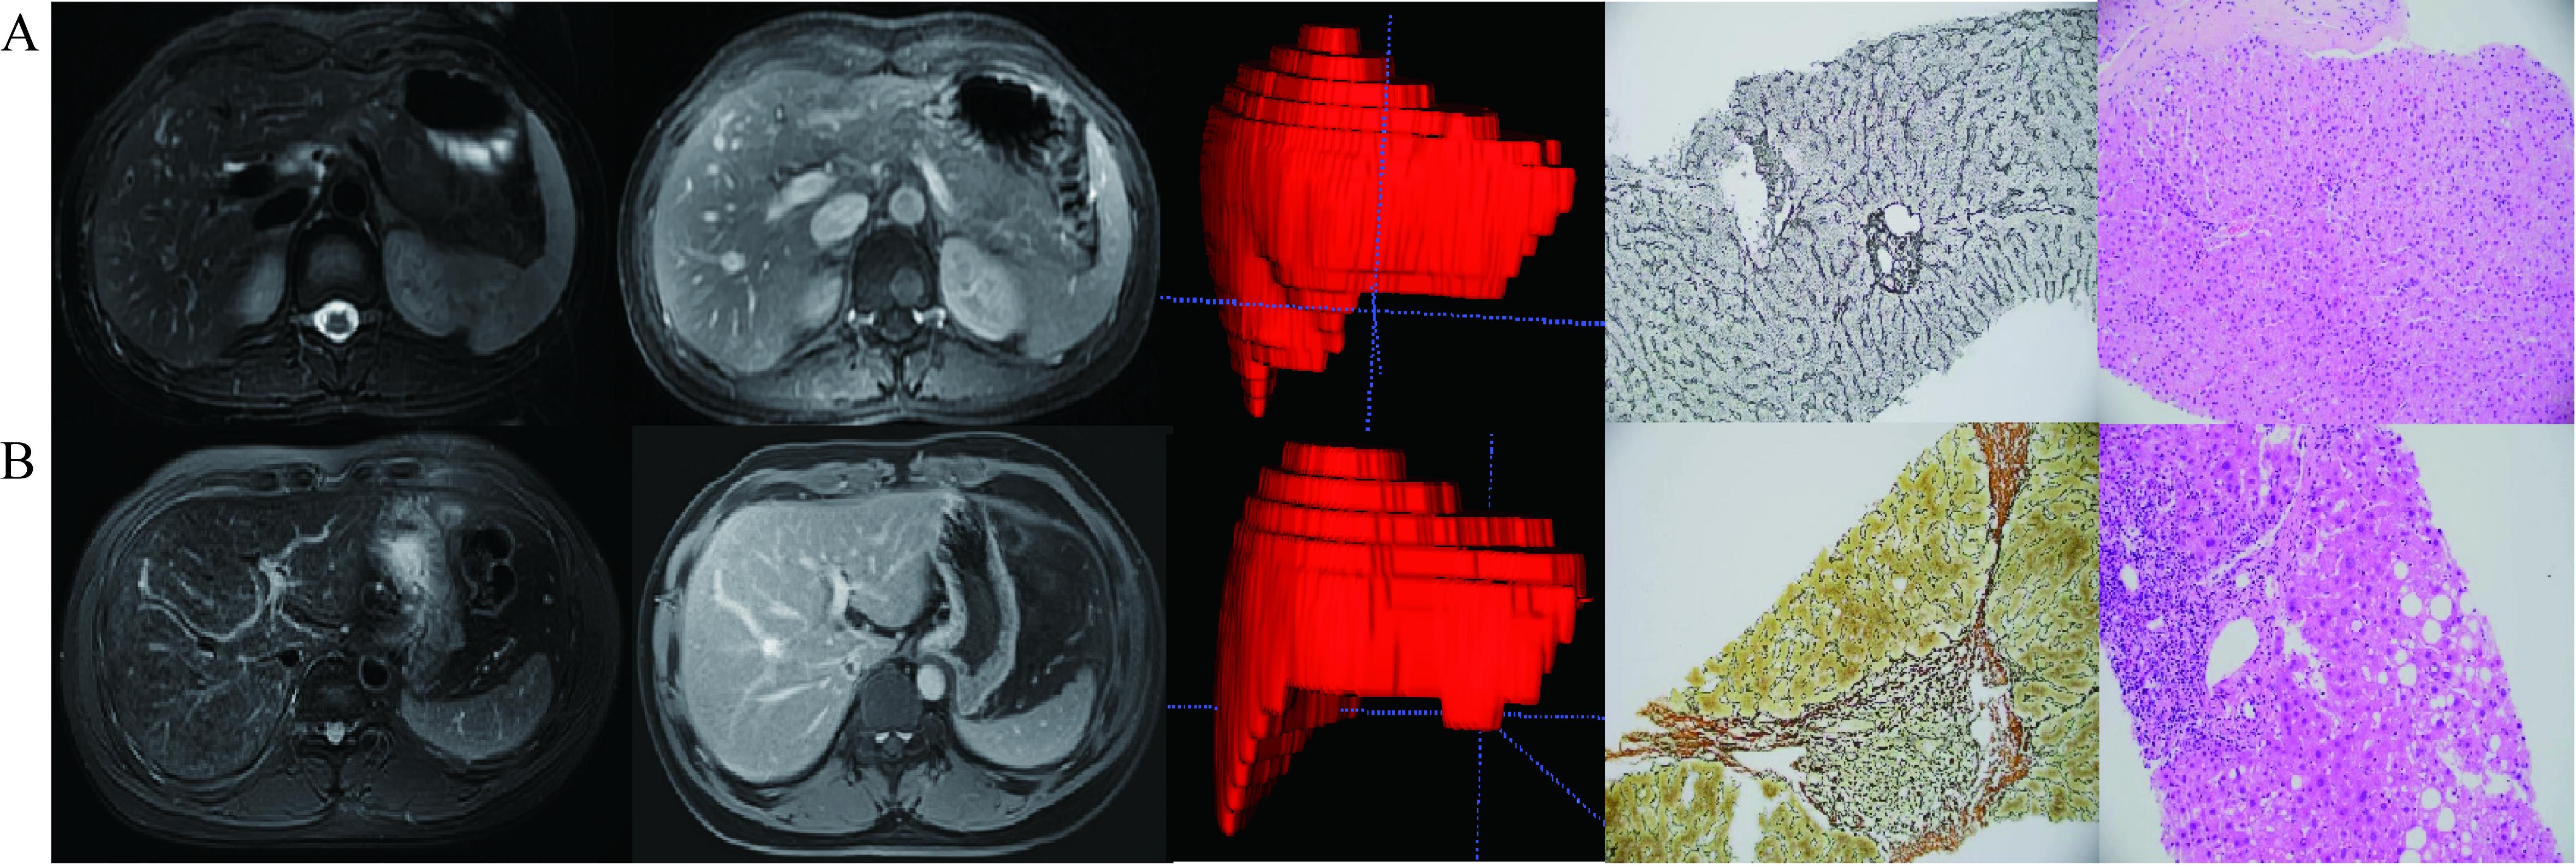
Since elastography may directly reflect total collagen content rather than fibrosis stage, not unexpectedly demonstrating more overlap at lower stages of liver fibrosis. Our CoRC models focused on the early detection of fibrosis and necroinflammation separately. Fibrotic and necroinflammatory tissue demonstrated higher intensity than nonfibrotic tissue on T2-weighted images, and enhancement at a peak on T1 delay images, so we utilized conventional T2FS and T1 delay sequences. One study found that ≥ F2 was diagnosed with an AUC of 0.85 by a deep convolutional neural network using hepatobiliary phase (HBP) images16. Another combined clinico-biochemical deep learning model from T2FS or T1 delay images exhibited an AUC of 0.94 for predicting ≥ G2. Although these methods yielded promising results, none were validated in separate test datasets, leaving the generalizability of their results unproven. AUCs of the cited studies above are comparable to ours, though a future head-to-head comparison is needed. Moreover, HBP image acquisition is time-consuming and inaccessible in some institutions. One previous study explored that MEFIB index, a combination of MRE ≥3.3 kPa (AUC 0.87, 0.79) and FIB-4 ≥1.6 (AUC 0.72, 0.73) provided a robust AUC of 0.84, 0.90 for patients with ≥F2 in two geographically and ethnically distinct cohorts. Actually, in our study, FIB-4 and APRI yielded highest AUCs of 0.69 in test cohorts, also less than the AUC results of the FIB-4 (0.73) and APRI (0.76) for ≥F2 from another meta-analysis. In contrast, we considered there might be a more comprehensive multivariate logistic model in combination with clinically relevant biomarkers that could further improve accuracy.Our study had several limitations. First, the retrospective study may have introduced selection biases. Considerable deviations in the calibration curves, especially in external dataset, can be observed and may be explained by the small samples and class imbalance. Although there were differences in some patient characteristics among the training, independent temporal, and external test cohorts, those differences may help avoid over-optimistic model performance while reflecting various population prevalence in real-world clinical settings. Second, the histological assessment may vary according to etiologies and general population prevalence. In our study, the Chinese population consisted of patients with hepatitis B virus infection, suggesting the need to validate further our model in patients with other etiologies such as alcoholic (or nonalcoholic) fatty liver disease. Finally, we just compare other than combine the performance of the CoRC model with FIB-4, APRI, and TE-LSM, and did not include other superior US elastography or MRE data which should be further investigated in future work. However, the feasibility of MRE / SWE is limited by higher cost, and more technical know-how (cost intense hardware and software add-ons), which hinders the commonplace use. Our CoRC models were based on conventional scanning protocol without additional equipment. Finally, necroinflammation, as vital confounding factor, increases LSM, and is also important in the pathogenesis of NAFLD/NASH or viral hepatitis other than fibrosis. Our CoRC model 2 was also explored for diagnosing >= G2. Emerging 3D MRE may provide higher technical precision than 2D MRE and assess multiple tissue mechanical properties that may be sensitive to pathologic changes other than fibrosis (i.e., inflammation). Residual confounding may be another limitation due to unobserved confounders.
Conclusion
CoRC models exhibited promising diagnostic performances for clinically significant liver fibrosis and necroinflammation, which could be a potential alternative when TE-LSM is unavailable.Acknowledgements
We would like to acknowledge all participants of this project for providing samples and experts of local hospitals for collecting and analyzing data. Also, we wish to thank Dr. Shenghong Ju for sharing data to support this study.References
1. Koyama Y, Brenner DA Liver inflammation and fibrosis. J Clin Invest 2017; 127(1):55-64.
2. Faria SC, Ganesan K, Mwangi I, et al. MR imaging of liver fibrosis: current state of the art. Radiographics 2009; 29(6):1615-1635.
3. Harris R, Harman DJ, Card TR, et al. Prevalence of clinically significant liver disease within the general population, as defined by non-invasive markers of liver fibrosis: a systematic review. The Lancet Gastroenterol& Hepatol 2017; 2(4):288-297.
4. Jung J, Loomba RR, Imajo K, et al. MRE combined with FIB-4 (MEFIB) index in detection of candidates for pharmacological treatment of NASH-related fibrosis. Gut 2021; 70(10):1946-1953.
5. Younossi ZM, Loomba R, Anstee QM, et al. Diagnostic modalities for nonalcoholic fatty liver disease, nonalcoholic steatohepatitis, and associated fibrosis. Hepatology 2018; 68(1):349-360.
6. Patel K, Sebastiani G. Limitations of non-invasive tests for assessment of liver fibrosis. JHEP Rep 2020; 2(2):100067.
7. Cardoso AC, Figueiredo-Mendes C, Villela-Nogueira CA, et al. Staging Fibrosis in Chronic. Viral Hepatitis. Viruses 2022; 14(4).
8. Vilar-Gomez E, Chalasani N. Non-invasive assessment of non-alcoholic fatty liver disease: Clinical prediction rules and blood-based biomarkers. J Hepatol 2018; 68(2):305-315.
9. Bravo AA, Sheth SG, Chopra S. Liver biopsy. N Engl J Med 2001; 344(7):495-500.
10. Ding R, Zhou X, Huang D, et al. Nomogram for predicting advanced liver fibrosis and cirrhosis in patients with chronic liver disease. BMC Gastroenterol 2021; 21(1):190.
11. Park HJ, Park B, Lee SS. Radiomics and Deep Learning: Hepatic Applications. Korean J Radiol 2020; 21(4):387-401.
12. Wei J, Jiang H, Gu D, et al. Radiomics in liver diseases: Current progress and future opportunities. Liver Int 2020; 40(9):2050-2063.
13. Lambin P, Leijenaar RTH, Deist TM, et al. Radiomics: the bridge between medical imaging and personalized medicine. Nat Rev Clin Oncol 2017; 14(12):749-762.
14. Gillies RJ, Kinahan PE, Hricak H. Radiomics: Images Are More than Pictures, They Are Data. Radiology 2016; 278(2):563-577.
15. Park HJ, Lee SS, Park B, et al. Radiomics Analysis of Gadoxetic Acid-enhanced MRI for Staging Liver Fibrosis. Radiology 2019; 290(2):380-387.
16. Yasaka K, Akai H, Kunimatsu A, et al. Liver Fibrosis: Deep Convolutional Neural Network for Staging by Using Gadoxetic Acid-enhanced Hepatobiliary Phase MR Images. Radiology 2018; 287(1):146-155.
17. Zhang X, Gao X, Liu BJ, et al. Effective staging of fibrosis by the selected texture features of liver: Which one is better, CT or MR imaging?. Comput Med Imaging Graph 2015; 46(2):227-236.
18. Zhang S, Chen Z, Wei J, et al. A model based on clinico-biochemical characteristics and deep learning features from MR images for assessing necroinflammatory activity in chronic hepatitis. B J Viral Hepat 2021; 28(11):1656-1659.
19. Song J, Yu X, Song W, et al. MRI-Based Radiomics Models Developed With Features of the Whole Liver and Right Liver Lobe: Assessment of Hepatic Inflammatory Activity in Chronic Hepatic Disease. J Magn Reson Imaging 2020; 52(6):1668-1678.
20. Hectors SJ, Kennedy P, Huang KH, et al. Fully automated prediction of liver fibrosis using deep learning analysis of gadoxetic acid-enhanced MRI. Eur Radiol 2021; 31(6):3805-3814.
21. Wang K, Mamidipalli A, Retson T, et al. Automated CT and MRI Liver Segmentation and Biometry Using a Generalized Convolutional Neural Network. Radiol Artif Intell 2019; 1(2).
22. Kim WR, Berg T, Asselah T, et al. Evaluation of APRI and FIB-4 scoring systems for non-invasive assessment of hepatic fibrosis in chronic hepatitis B patients. J Hepatol 2016; 64(4):773-780.
23. Cui J, Heba E, Hernandez C, et al. Magnetic resonance elastography is superior to acoustic radiation force impulse for the Diagnosis of fibrosis in patients with biopsy-proven nonalcoholic fatty liver disease: A prospective study. Hepatology 2016; 63(2):453-461.
24. Zhang YN, Fowler KJ, Ozturk A, et al. Liver Fibrosis Imaging: A clinical review of Ultrasound and Magnetic Resonance Elastography J Magn Reson Imaging 2020; 51(1): 25–42.
25. Xiao G, Zhu S, Xiao X, et al. Comparison of laboratory tests, ultrasound, or magnetic resonance elastography to detect fibrosis in patients with nonalcoholic fatty liver disease: A meta-analysis. Hepatology 2017; 66(5):1486-1501.
26. Batts KP, Ludwig J. Chronic hepatitis. An update on terminology and reporting. Am J Surg Pathol 1995; 19(12):1409-1417.
27. Ludwig J. The nomenclature of chronic active hepatitis: an obituary. Gastroenterology 1993; 105(1):274-278.
28. Greenwald NF, Miller G, Moen E, et al. Whole-cell segmentation of tissue images with human-level performance using large-scale data annotation and deep learning. Nat Biotechnol 2022; 40(4):555-565.
29. Zwanenburg A, Vallières M, Abdalah MA, et al. The Image Biomarker Standardization Initiative: Standardized Quantitative Radiomics for High-Throughput Image-based Phenotyping. Radiology 2020; 295(2):328-338.
30. Kumar V, Gu Y, Basu S, et al. Radiomics: the process and the challenges. Magn Reson Imaging 2012; 30(9):1234-1248.
31. Song Y, Zhang J, Zhang Y-d, et al. FeAture Explorer (FAE): A tool for developing and comparing radiomics models. PLoS ONE 2020; 15(8): e0237587.
32. Pencina MJ, D'Agostino RB Sr, Demler OV. Novel metrics for evaluating improvement in discrimination: net reclassification and integrated discrimination improvement for normal variables and nested models. Stat Med 2012; 31(2):101-113.
33. DeLong ER, DeLong DM, Clarke-Pearson DL. Comparing the areas under two or more correlated receiver operating characteristic curves: a nonparametric approach. Biometrics 1988; 44(3):837-845.
34. Austin PC, Harrell FE Jr, van Klaveren D. Graphical calibration curves and the integrated calibration index (ICI) for survival models. Stat Med 2020; 39(21):2714-2742.35. Fitzgerald M, Saville BR, Lewis RJ. Decision curve analysis. JAMA 2015; 313(4):409-410.
Figures