4431
Eddy-current characterization and pre-emphasis on a compact inside-out nonlinear gradient1Radiology and Biomedical Imaging, Yale School of Medicine, New Haven, CT, United States, 2Radiology, Stanford University, Stanford, CA, United States, 3Siemens Healthcare, Erlangen, Germany
Synopsis
Keywords: Hybrid & Novel Systems Technology, Prostate, Eddy-current, GIRF
Diffusion-weighted imaging requires strong sensitizing gradients, resulting in eddy currents that create image distortions and hinder the reliability of measured diffusion parameters. In this study, we characterize and and compensate for eddy currents on a compact inside-out nonlinear gradient using a 2D phase encoded FLASH sequence. Time series of the effective waveform was calculated from PCA of the field maps, which was then used to calculate a gradient impulse response function (GIRF). The GIRF was validated by comparing the output waveform of a simple vs pre-emphasized trapezoid. Results showed clear improvement of the pre-emphasized waveform.Purpose
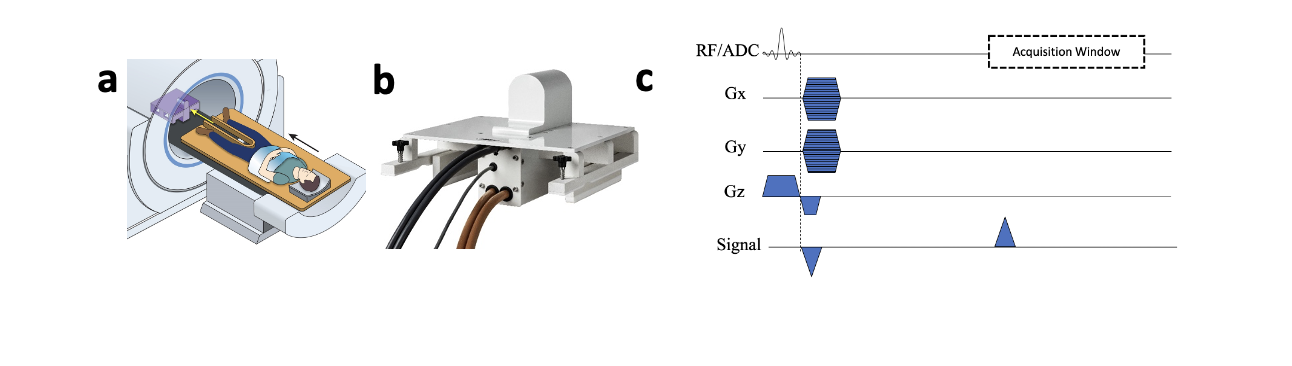
Diffusion weighted imaging (DWI) has shown promise in non-invasive/in-vivo prostate cancer surveillance and characterization, as it provides a grade-sensitive metric in prostate imaging [1]. However, clinical reliability and sensitivity have been limited by low image quality and distortions. A major cause of low image quality in DWI is the limited amplitude available on conventional gradients, which makes prolonged echo times necessary for sufficient diffusion weighting. This consequently affects the accurate measurement of principal diffusion parameters such as apparent diffusion coefficient and anisotropy.Nonlinear gradients can deliver strong diffusion weighting in short diffusion time over targeted regions of interest, which can improve SNR and sensitivity [2]. To apply this concept to prostate DWI, a recently proposed nonlinear gradient was built that delivers ~500mT/m over a prostate ROI using a standard amplifier. The geometry of this device is essentially the inverse of standard gradient coils; it is a solid cylinder placed at isocenter with the subject surrounding it. (Fig 1a)
Given the very strong fields and the need for EPI acquisition, management of eddy currents generated by this gradient are critical. This abstract reports on the applicability of previously published eddy current measurement and correction methods to this system despite the unusual geometries of the hardware and field. In addition, we tested the feasibility of performing GIRF characterization using a 2D phase encoded pulse sequence that requires no special hardware.
Methods
All experiments were performed on a Siemens Prisma 3T scanner using a compact inside-out nonlinear gradient (Figure 1a, 1b). For eddy current characterization at low temporal resolution, 500 FLASH images were acquired following a long gradient pulse. Sequence parameters for this acquisition were TR = 10 ms, TE = 5 ms, FOV = 40 cm. After correction with an acquisition using no gradient, frequency maps were calculated as $$$f(x,y)=\frac{\phi (x,y)}{TE}/2\pi $$$. After masking to the relevant pixels, each image was fit to a polynomial, extracting the zero-order component as the frequency offset. PCA was then applied to the residual of the field maps to identify the spatial components and their evolution over time.For eddy current characterization with higher temporal resolution, this work used a 2D phase encoded acquisition like that shown in Figure 1c. Sequence parameters were TE=25, TR=35ms, FOV=45cm, 128x128 phase encode steps, and 8us dwell time. This sequence acquires a complex image for each dwell-time in the acquisition window. After correction with a no-gradient acquisition, each image is converted to a frequency map by $$$f(x,y,t)=\frac{\phi (x,y,t+1)-\phi (x,y,t)}{Dwell}/2\pi $$$. The frequency maps derived for each dwell time during a triangular gradient pulse are displayed as a movie in Figure 2. As before, the zero-order component of each field map was removed and PCA was applied to identify temporal evolution of different spatial components.
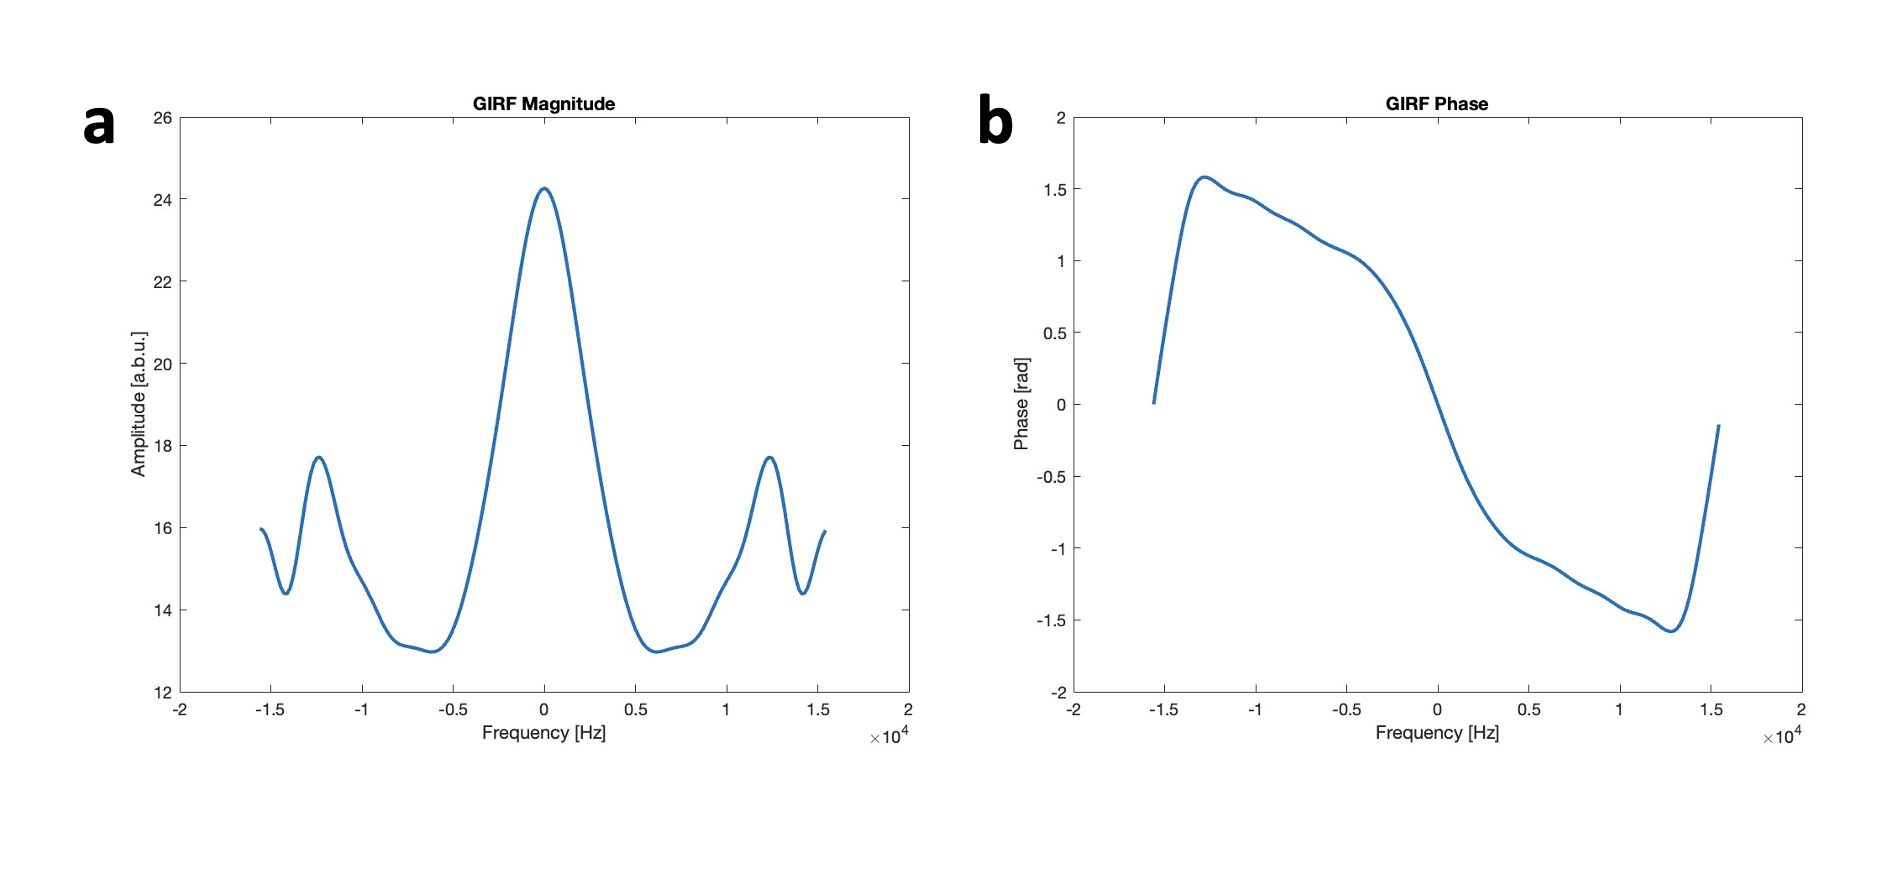
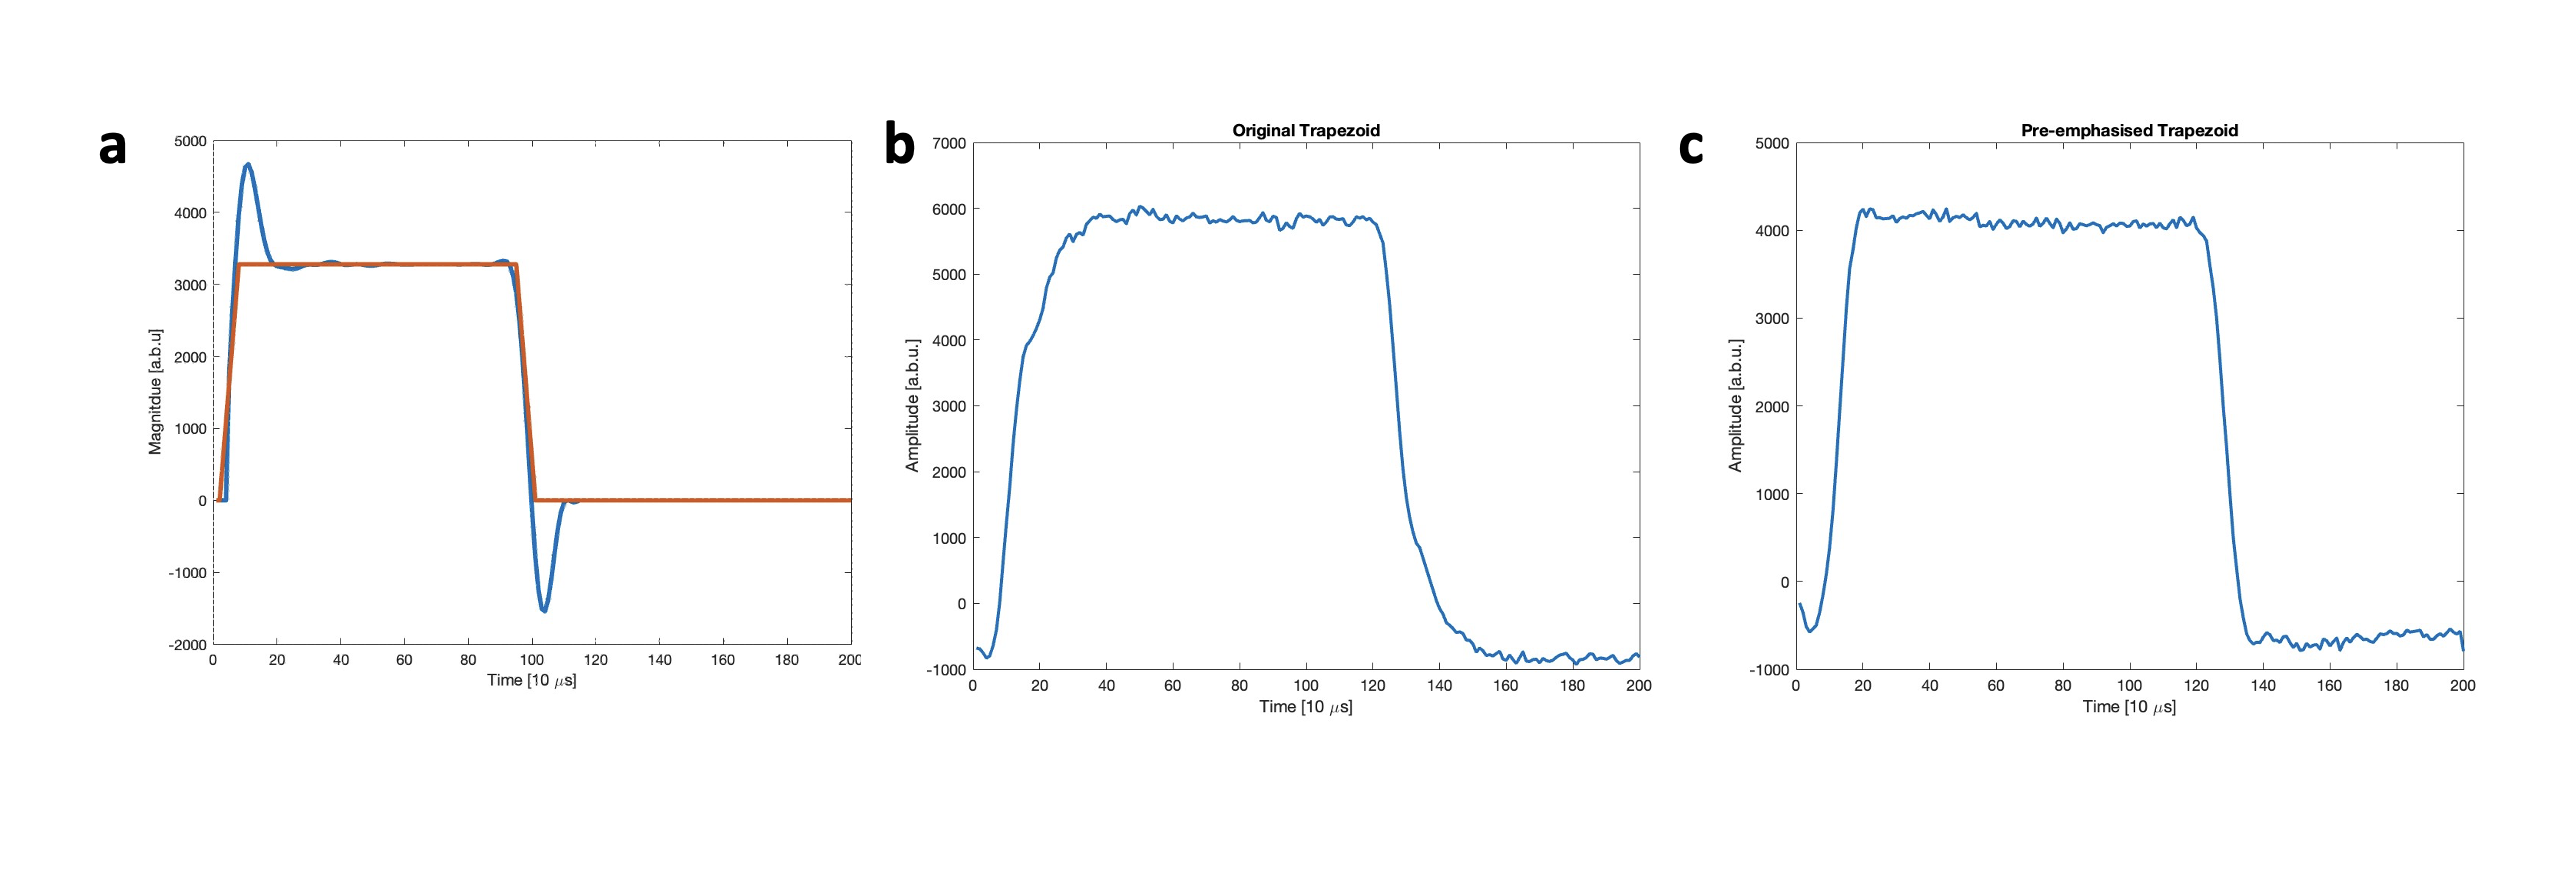
For GIRF characterization [3-4], a triangular waveform with a high slew rate was used to characterize the system function using the 2D phase encoded sequence. The GIRF was then smoothed with a rising-cosine filter with a window frequency of 16 kHz [5]. This GIRF was applied to a trapezoid to calculate appropriate pre-emphasis, and similar experiments were used to characterize the output from trapezoids without vs with the prescribed pre-emphasis.
Results and Discussion
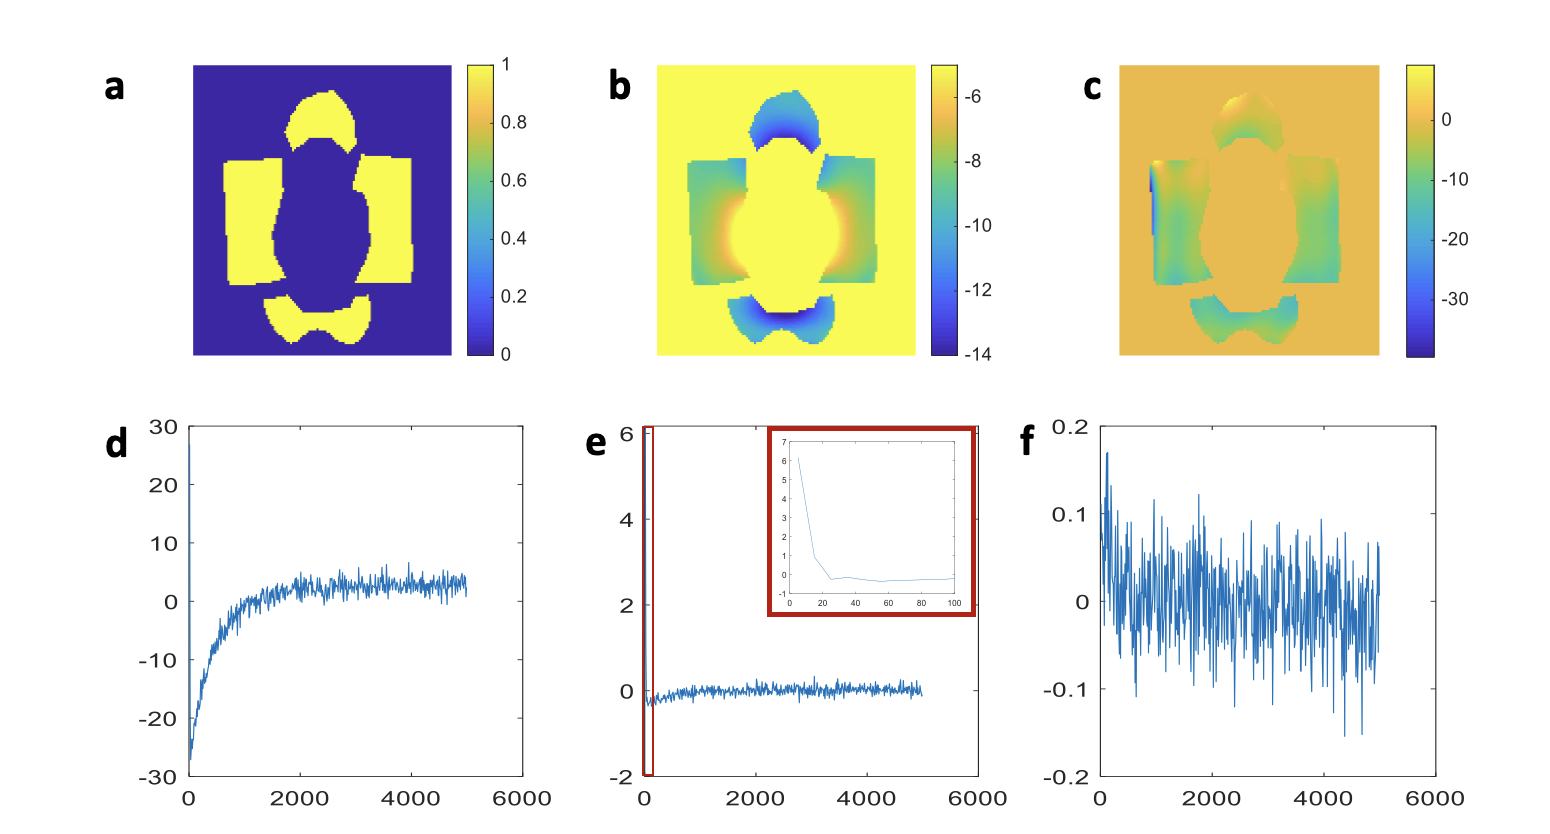
The eddy-current study at low temporal resolution identified a slowly decaying flat component that corresponds to a global Larmor shift (Figure 3a and 3d) and a rapidly decaying component that matched the steady state field shape and could be targeted by pre-emphasis (Figure 3b and 3e). Subsequent spatial components appeared to reflect only noise, as seen in the observed time course (Figure 3c and 3f).Similar spatial-temporal decomposition was observed in the experiments with high temporal resolution. Because data indicated that the first spatial component from PCA was the time course of the gradient itself, the scores for this component were used for gradient impulse response function (GIRF) and pre-emphasis calculation. The magnitude and phase of the GIRF for this system are shown in Figure 4. The pre-emphasized trapezoid prescribed by this GIRF is then shown in Figure 5a, overlayed with the target trapezoid. Panels 5b and 5c show the measured output waveform for the unmodified and pre-emphasized trapezoid, respectively. As can be seen, the pre-emphasized trapezoid creates a much cleaner waveform, with sharper ramps on both sides, validating the accuracy of the measured GIRF.
Conclusion
Eddy currents arising from diffusion weighting gradients can produce artifacts, hindering the image quality and DWI parameters measured. We have demonstrated that a 2D phase encoded measurement can be used to measure the GIRF of an “inside-out” nonlinear gradient coil. The resulting GIRF can be used to correct arbitrary waveform shapes to reduce and compensate for eddy currents. Future studies will demonstrate the use of these pre-emphasized waveforms in diffusion weighted SE-EPI using our compact inside-out nonlinear gradient hardware.Acknowledgements
No acknowledgement found.References
[1] Tamada, T., Sone, T., Jo, Y., Yamamoto, A., & Ito, K. (2014). Diffusion‐weighted MRI and its role in prostate cancer. NMR in Biomedicine, 27(1), 25-38.
[2] Hoque Bhuiyan, E., Dewdney, A., Weinreb, J., & Galiana, G. (2021). Feasibility of diffusion weighting with a local inside‐out nonlinear gradient coil for prostate MRI. Medical Physics, 48(10), 5804-5818.
[3] Addy, N. O., Wu, H. H., & Nishimura, D. G. (2012). Simple method for MR gradient system characterization and k‐space trajectory estimation. Magnetic resonance in medicine, 68(1), 120-129.
[4] Jehenson, P., Westphal, M., & Schuff, N. (1990). Analytical method for the compensation of eddy-current effects induced by pulsed magnetic field gradients in NMR systems. Journal of Magnetic Resonance (1969), 90(2), 264-278.
[5] Vannesjo, S.J., Haeberlin, M., Kasper, L., Pavan, M., Wilm, B.J., Barmet, C., Pruessmann, K.P., 2013. Gradient system characterization by impulse response measurements with a dynamic field camera. Magn Reson Med 69, 583–593. https://doi.org/10.1002/mrm.24263
Figures