4414
Slice-specific B1 shimming can improve the repeatability of multi-shot, diffusion-weighted imaging at 7T1Imaging Centre of Excellence, University of Glasgow, Glasgow, Scotland, 2Siemens Healthcare Ltd., Glasgow, United Kingdom, 3Siemens Healthcare Ltd., London, United Kingdom, 4Siemens Healthcare GmbH, Erlangen, Germany, 5NHS Greater Clyde and Glasgow, Glasgow, Scotland
Synopsis
Keywords: Parallel Transmit & Multiband, Diffusion/other diffusion imaging techniques, high-field, 7T, DWI, repeatability
Parallel transmission (pTx) can significantly improve readout-segment EPI (rsEPI) diffusion-weighted imaging (DWI) at 7T when compared to the non-pTx sequence. However, no study has been done to assess the repeatability of pTx-DWI. Thus, we conducted a test-retest study to evaluate the impact pTx pulses have on the repeatability of ADC measures in a rsEPI[DP1] DWI sequence at 7T. Overall, pTx-DWI had higher SNR and can potentially improve the repeatability for intra- and inter-session ADC measures even when different B1-shim coefficients are used for different sessions. This suggests that pTx has an important role in quantittaive imaging studies at 7T.Introduction
Diffusion-weighted imaging (DWI) has an intrinsic low signal-to-noise ratio (SNR) which can be improved by scanning at higher field strengths. However, the increased RF transmit inhomogeneity and shortened T2 and T2* make DWI challenging at 7T. Parallel transmission (pTx) is a critical development to mitigate RF nonuniformity, while multi-shot sequences allow shorter echo times to accommodate the reduced T2 values. Previous work has shown the benefits of a pTx-enabled readout-segmented 2D EPI (rsEPI) DWI sequence [1] but no study has been done to assess the repeatability of the pTx sequence against its non-pTx circularly polarised (CP) counterpart. Thus, we conducted a test-retest study to evaluate the impact pTx pulses have on the repeatability of ADC measures in a rsEPI DWI sequence [2].Methods
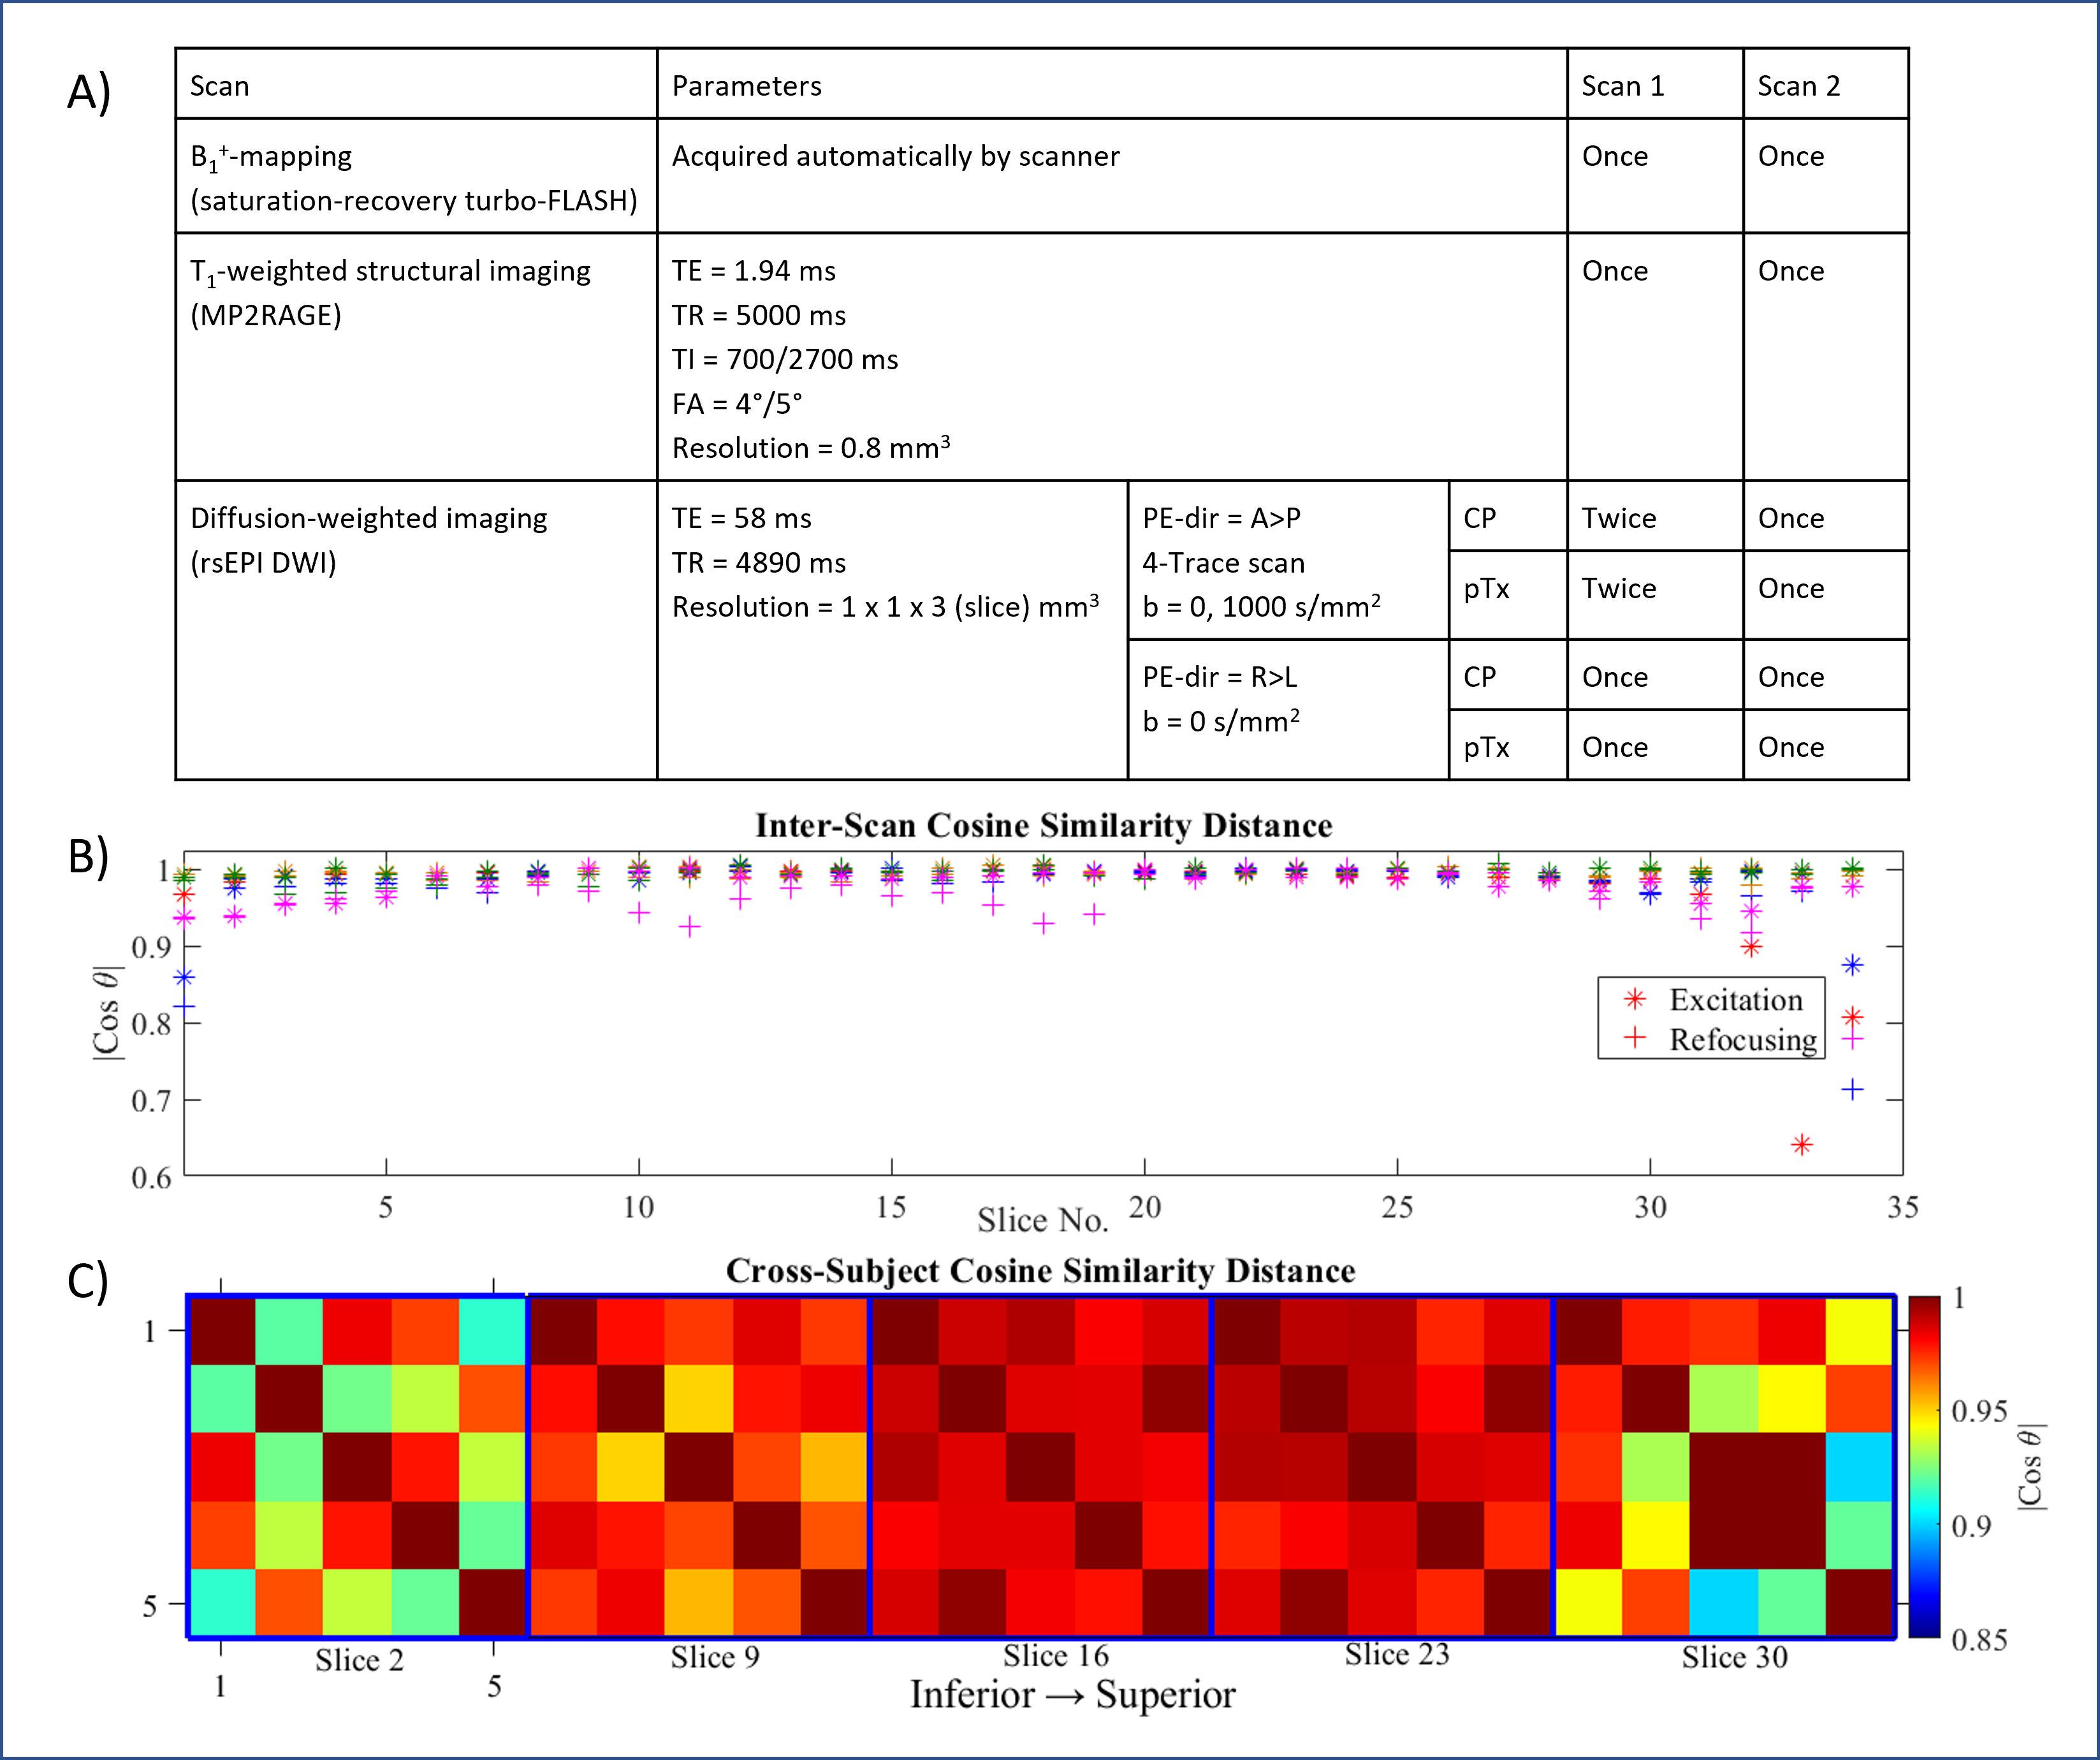
Data acquisition: Five healthy volunteers were scanned twice on the same day in a MAGNETOM Terra 7T Scanner (Siemens Healthineers, Germany) using a self-built 8Tx32Rx head coil [3]. Each session consisted of a localiser, per-channel B1+-mapping, T1-weighted (T1w) structural imaging and DW imaging. We acquired two runs of each sequence (CP-DWI, pTx-DWI) in the first session and one run of each in the second session. Details of the acquisition parameters are in Figure 1A . Subjects were taken out of the scanner between sessions and given a five-minute break. The order of the DW image acquisitions was randomised and pTx pulses were redesigned for the second session based on a new set of B1+ maps.Pulse design: Slice-specific B1+ shimming was performed for each scan by solving a magnitude least-squares optimisation using the interior-point algorithm in MATLAB’s fmincon with constraints on local SAR and the standard deviation of the flip angle (25% of the target) [4].
Data analysis: Images were analysed in FSL. After distortion correction (‘topup’) [5], DW images were registered to the MNI152 standard space via the T1w structural image using FLIRT [6]. Regions of interest (ROIs) from the Harvard-Oxford cortical and subcortical atlas were then mapped into the native image space using the inverse transformation matrix. Some ROIs were summed together to give larger combined ROIs. SNR was calculated by dividing image intensity with noise. Image noise was estimated by taking the average standard deviation of pixel intensity in air from four square ROIs (20x20 voxels) located at the corners of each slice. The measured signal/noise ratio was then multiplied by the 0.66 Rayleigh distribution correction factor to obtain the SNR [7].
Mean ADC values in these combined ROIs were compared for intra-session, and inter-session runs. Changes in ADC values were denoted in two ways: ΔADC = difference in ADC, and ẟADC= abs(ΔADC) / mean ADC x 100%. For each combined ROI, the number of voxels with negative ADC values (i.e. invalid ADC values) was also calculated and expressed as a percentage of the total number of voxels in that ROI. Statistical testing was done with paired Student’s t-tests without excluding any anomalies.
Results and Discussions
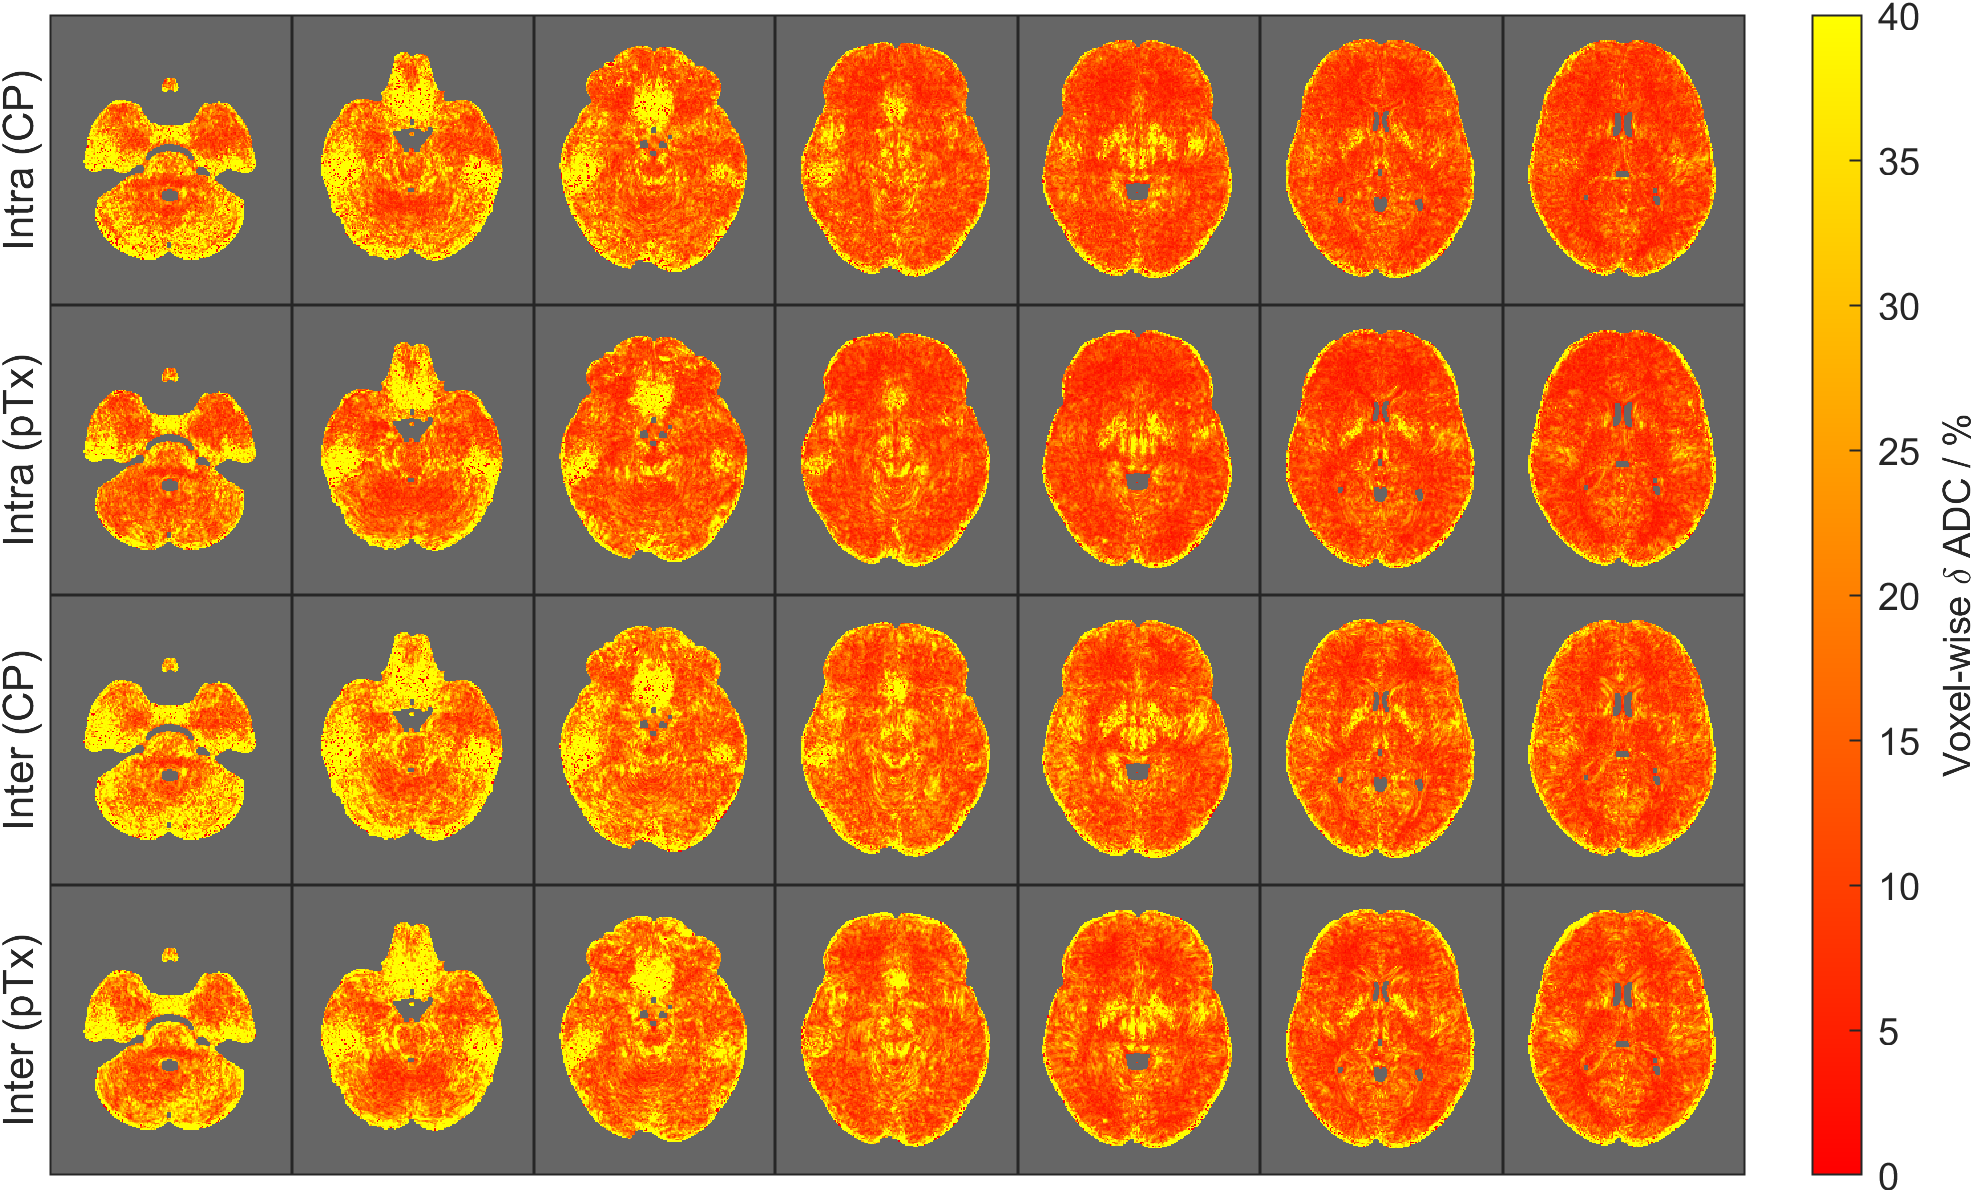
Figure 1B compares the cross-subject and same-subject inter-session slice shims and shows the magnitude cosine similarity distance between slice-specific shim vectors. The variations in same-subject inter-session slice shims are mainly seen in the superior slices. Between volunteers, the central slices are the most similar, while inferior and superior-most slices showed the most considerable variations (Figure 1C).Figure 2 shows the voxel-wise ẟADC values averaged across all volunteers in the MNI space. Overall, both CP and pTx acquisitions showed larger ẟADC for inferior slices where B0 and B1+-inhomogeneities are more severe. The figure also shows larger ẟADC values for inter-session comparisons compared to their intra-session counterpart.
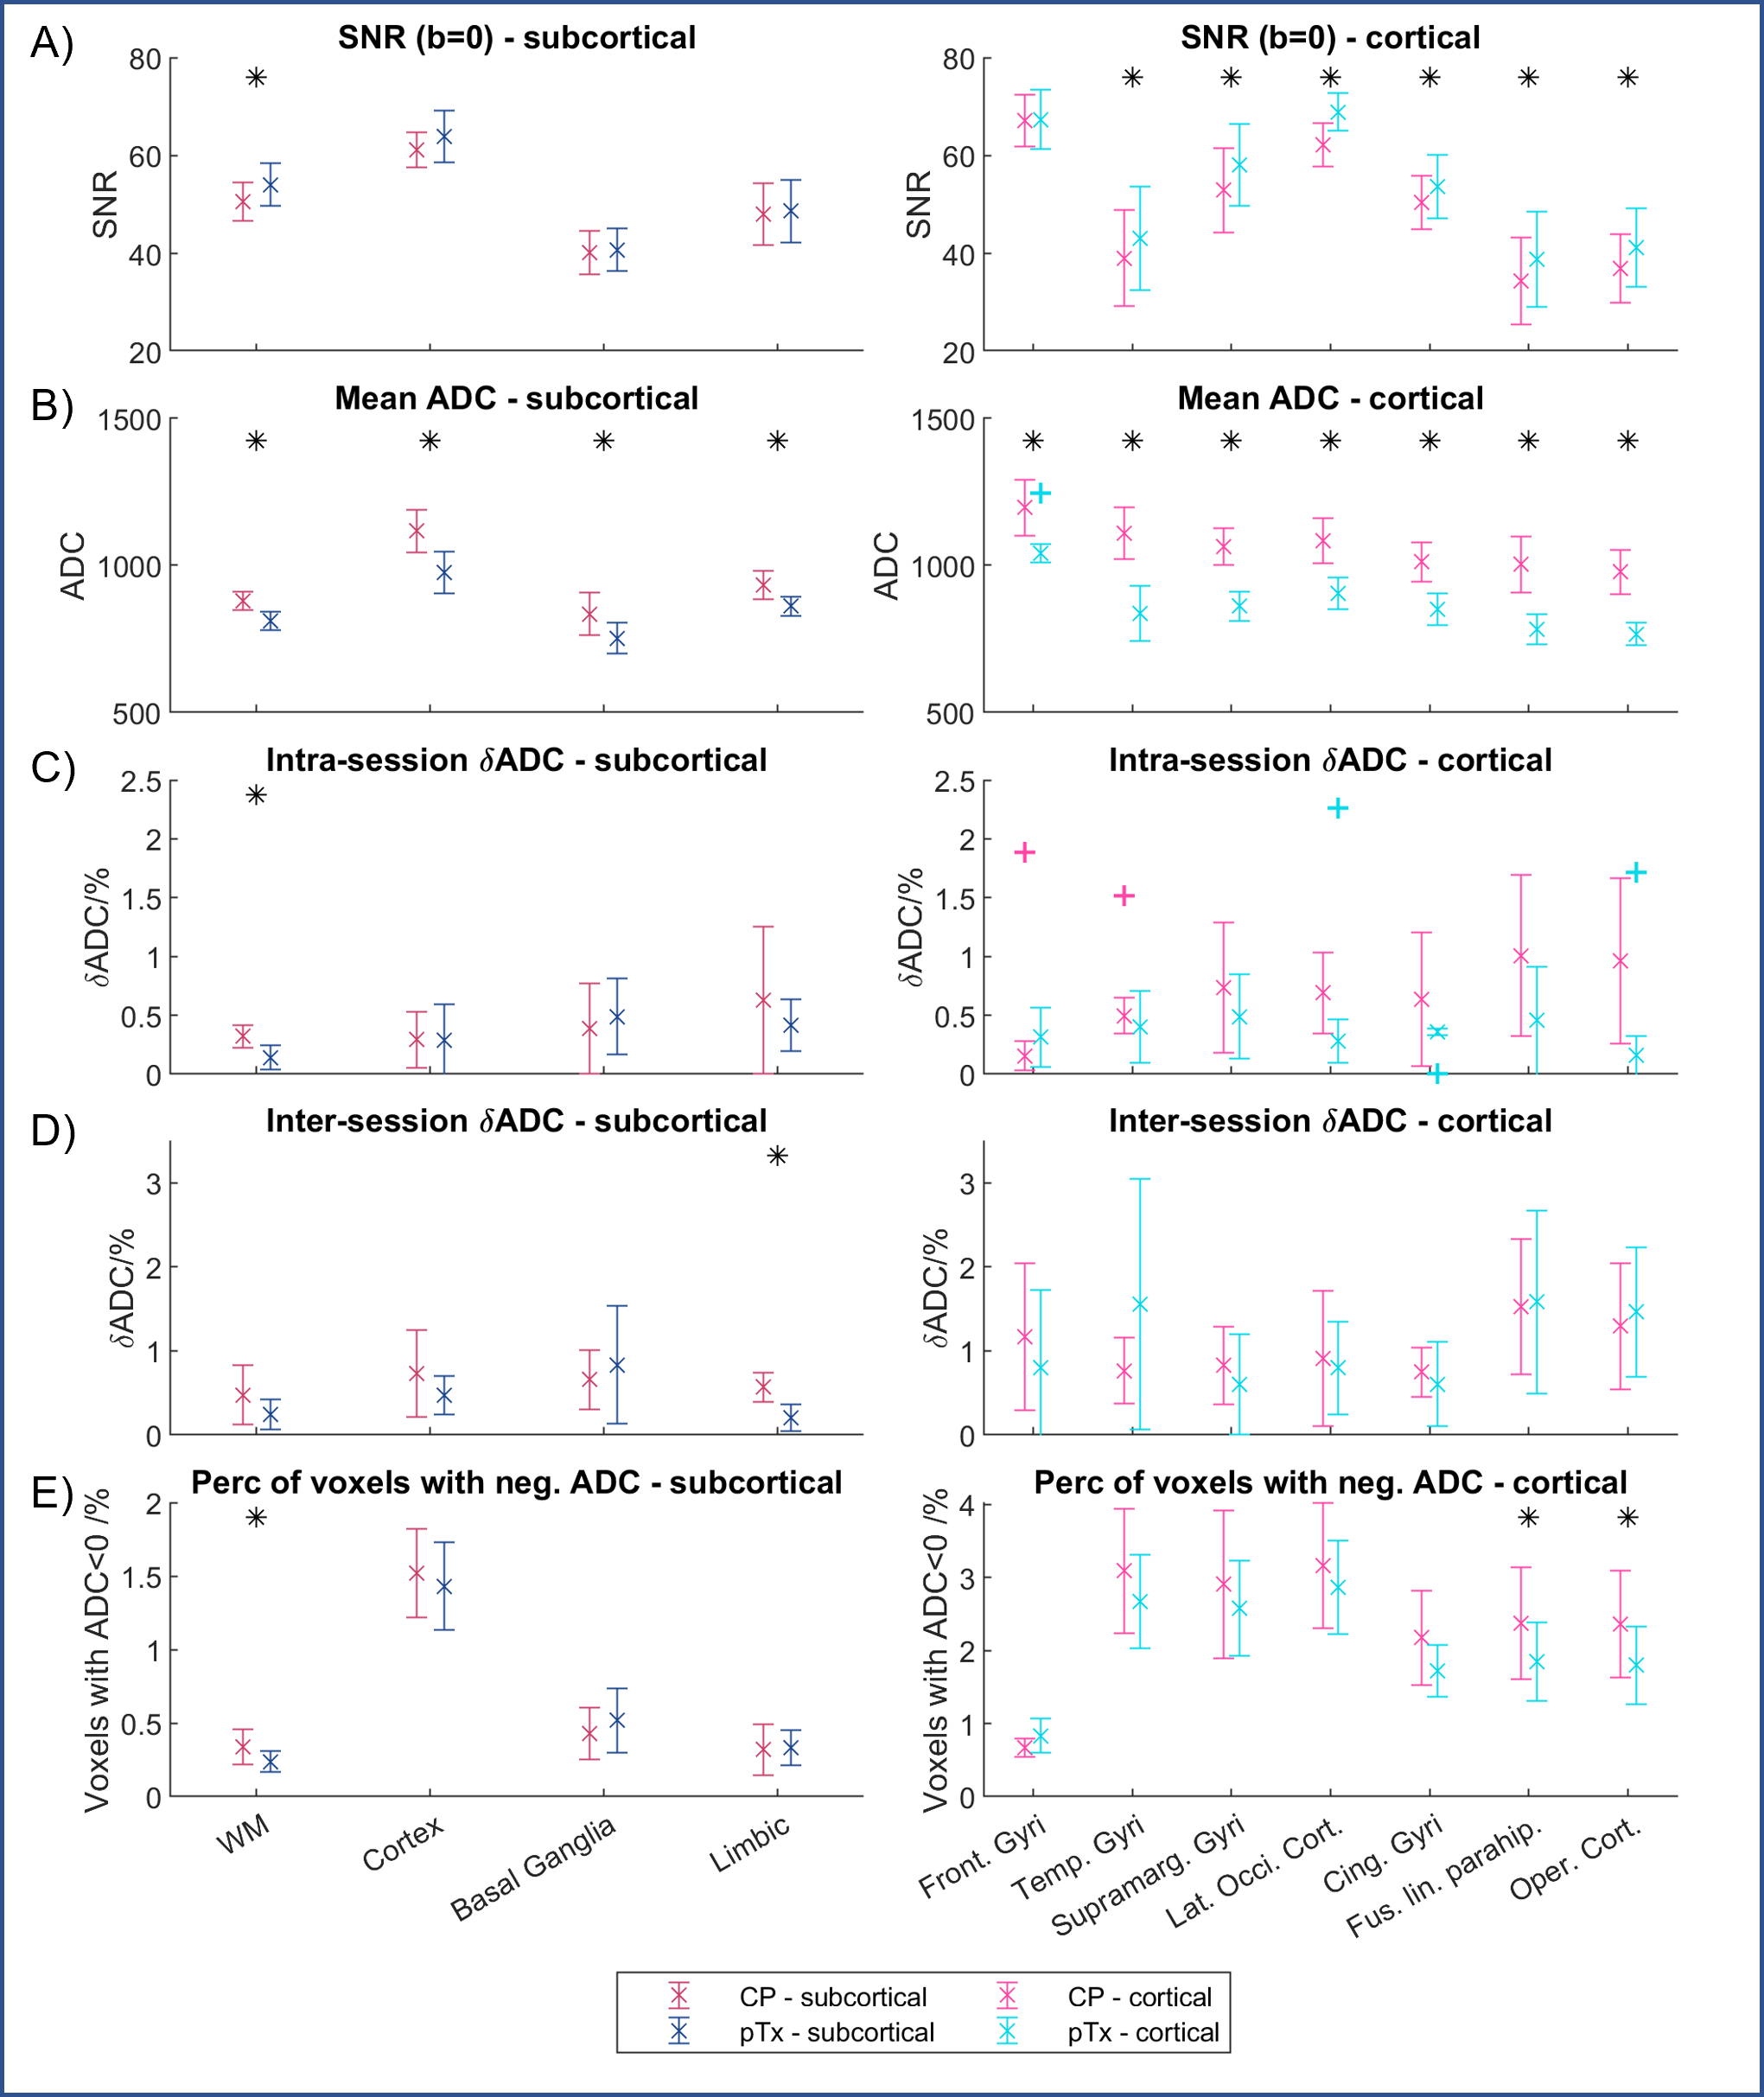
Comparing between pulses, the pTx sequence has smaller intra-session and inter-session ẟADC values, although the differences in ẟADC were only significant in two ROIs (Figure 3C, D). It is important to note that for the pTx sequence, different B1-shim coefficients were used for the two scan sessions, and might account for differences in excitation pattern, and thus ẟADC value.
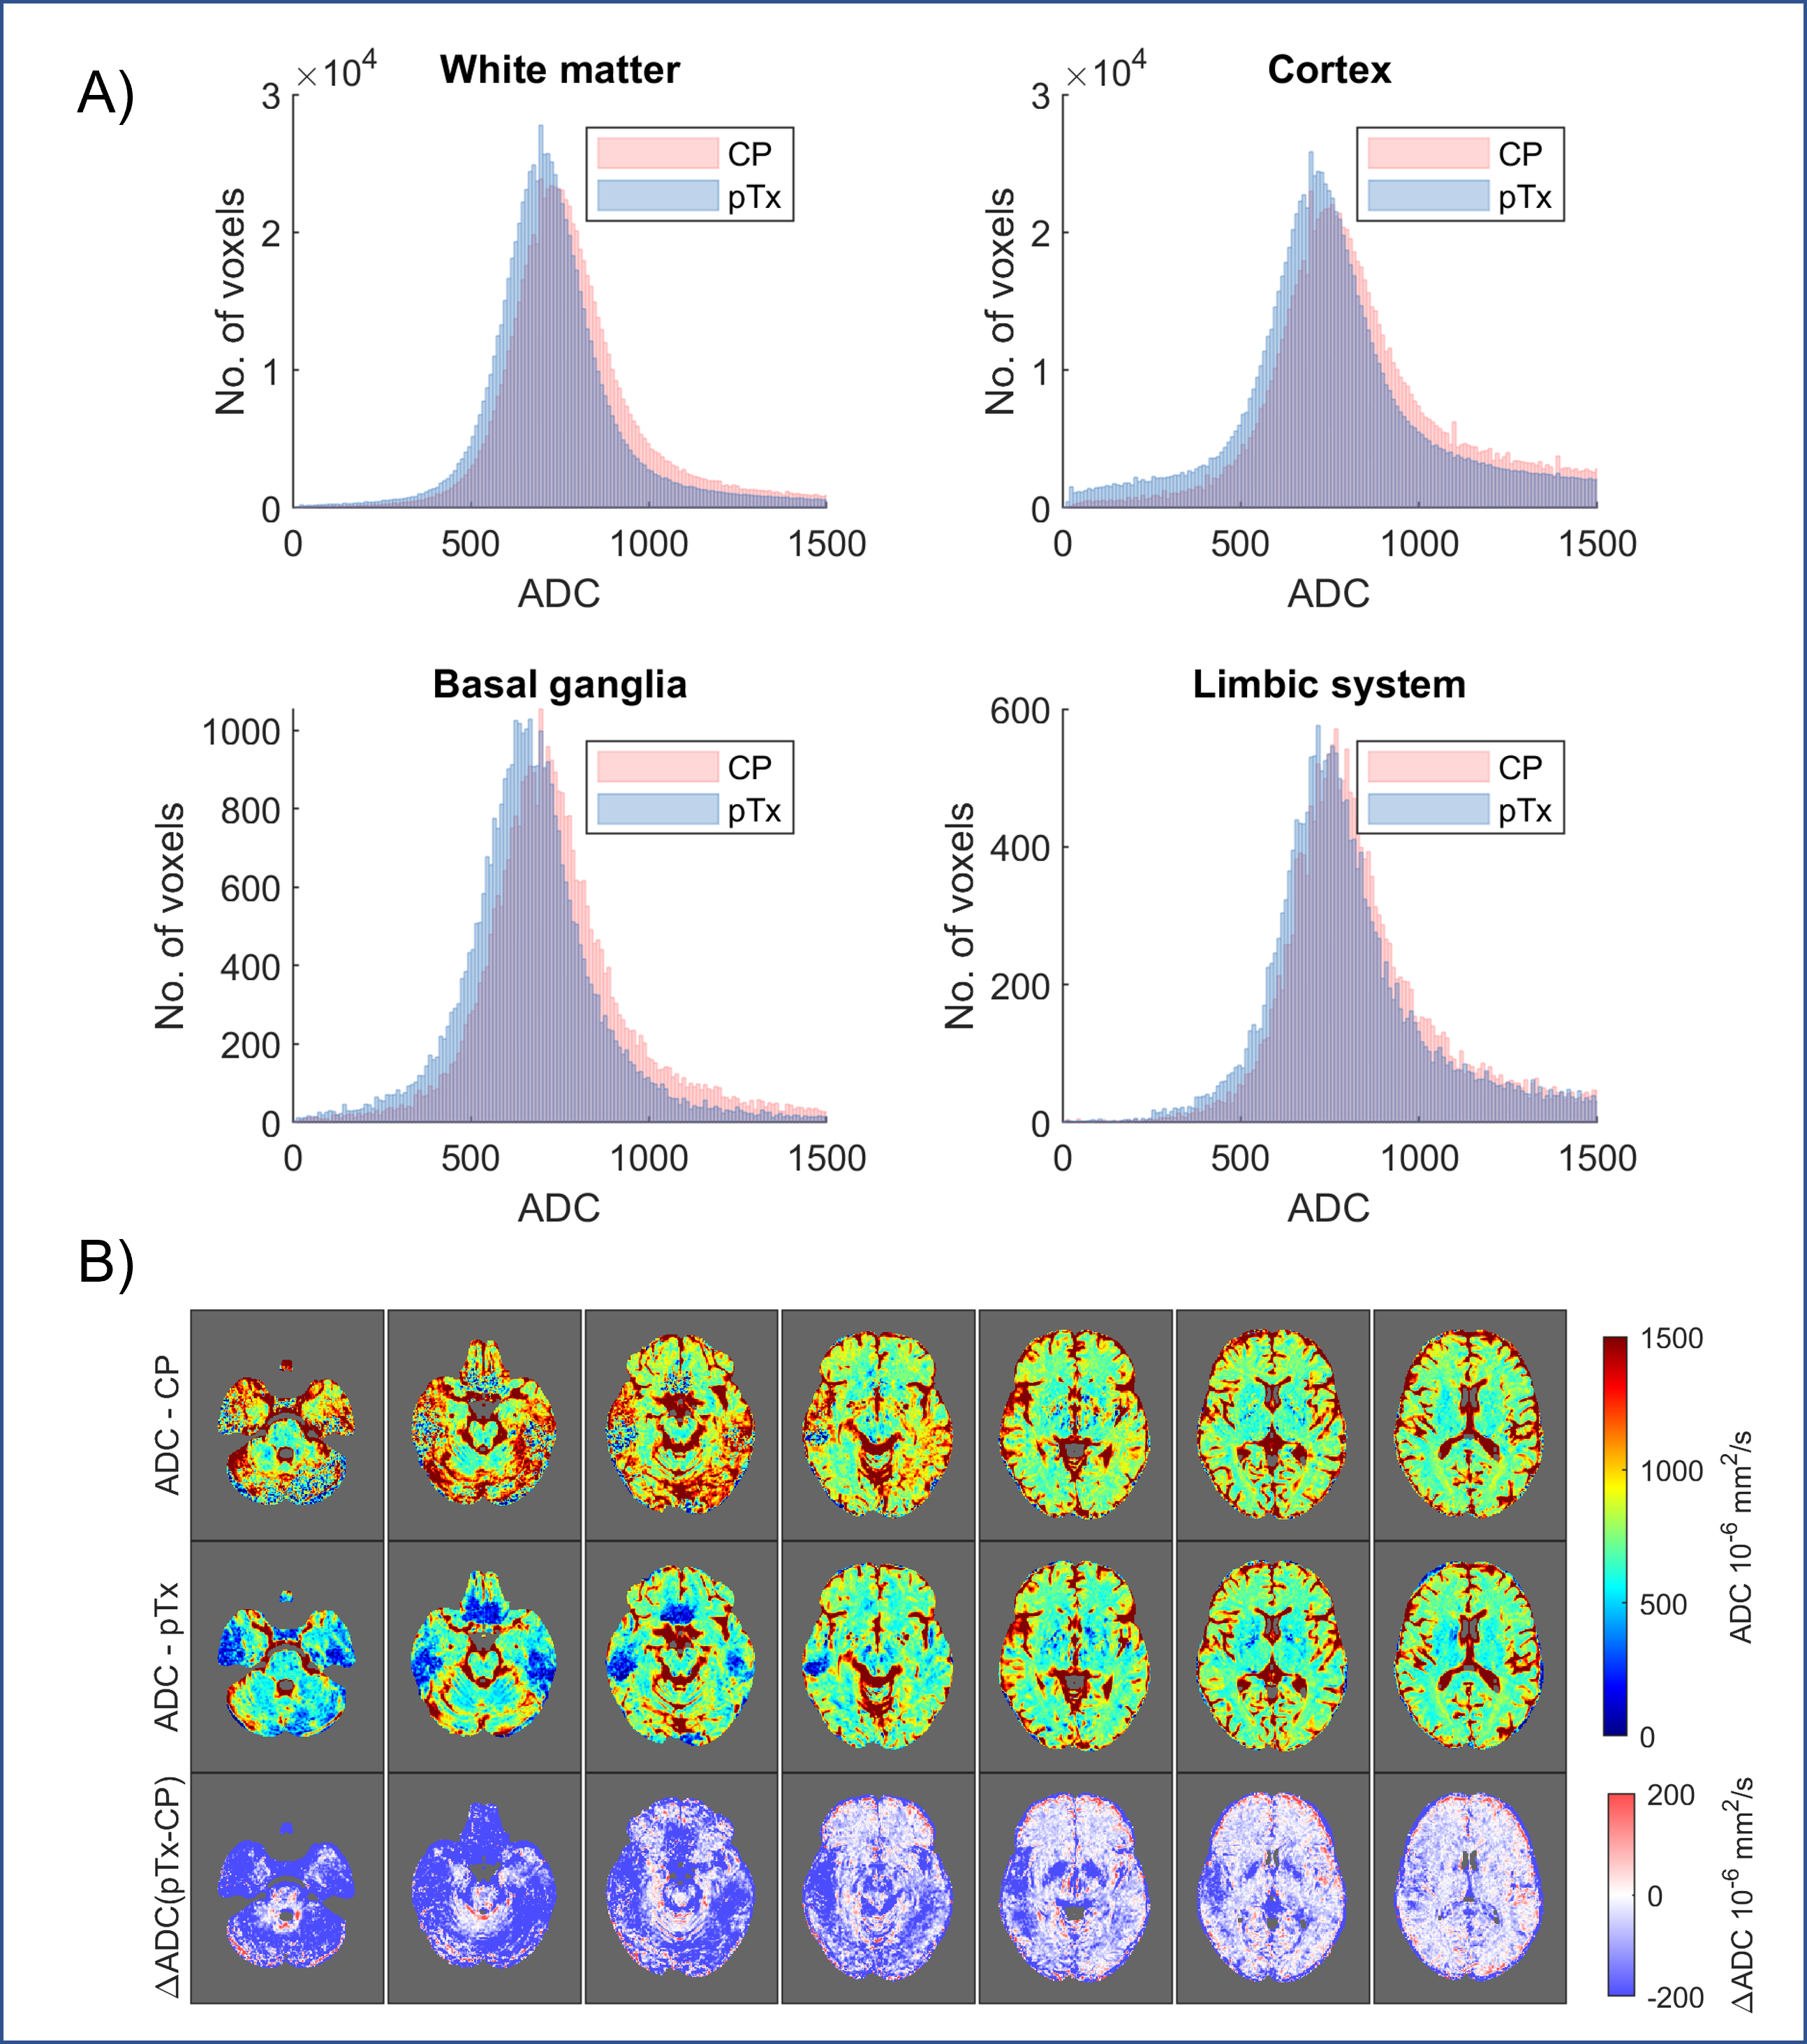
Figure 4A shows the histogram of ADC in all voxels for all volunteers. The full-width-half-maximum values (based on 300 bins from 0-3000) were, on average 7% smaller for pTx-DWI compared to CP-DWI (white matter (CP/pTx) = 261/241 mm2/s; cortex (CP/pTx) = 311/281 mm2/s; basal ganglia (CP/pTx) = 291/261 mm2/s; and limbic system (CP/pTx) = 271/271 mm2/s).
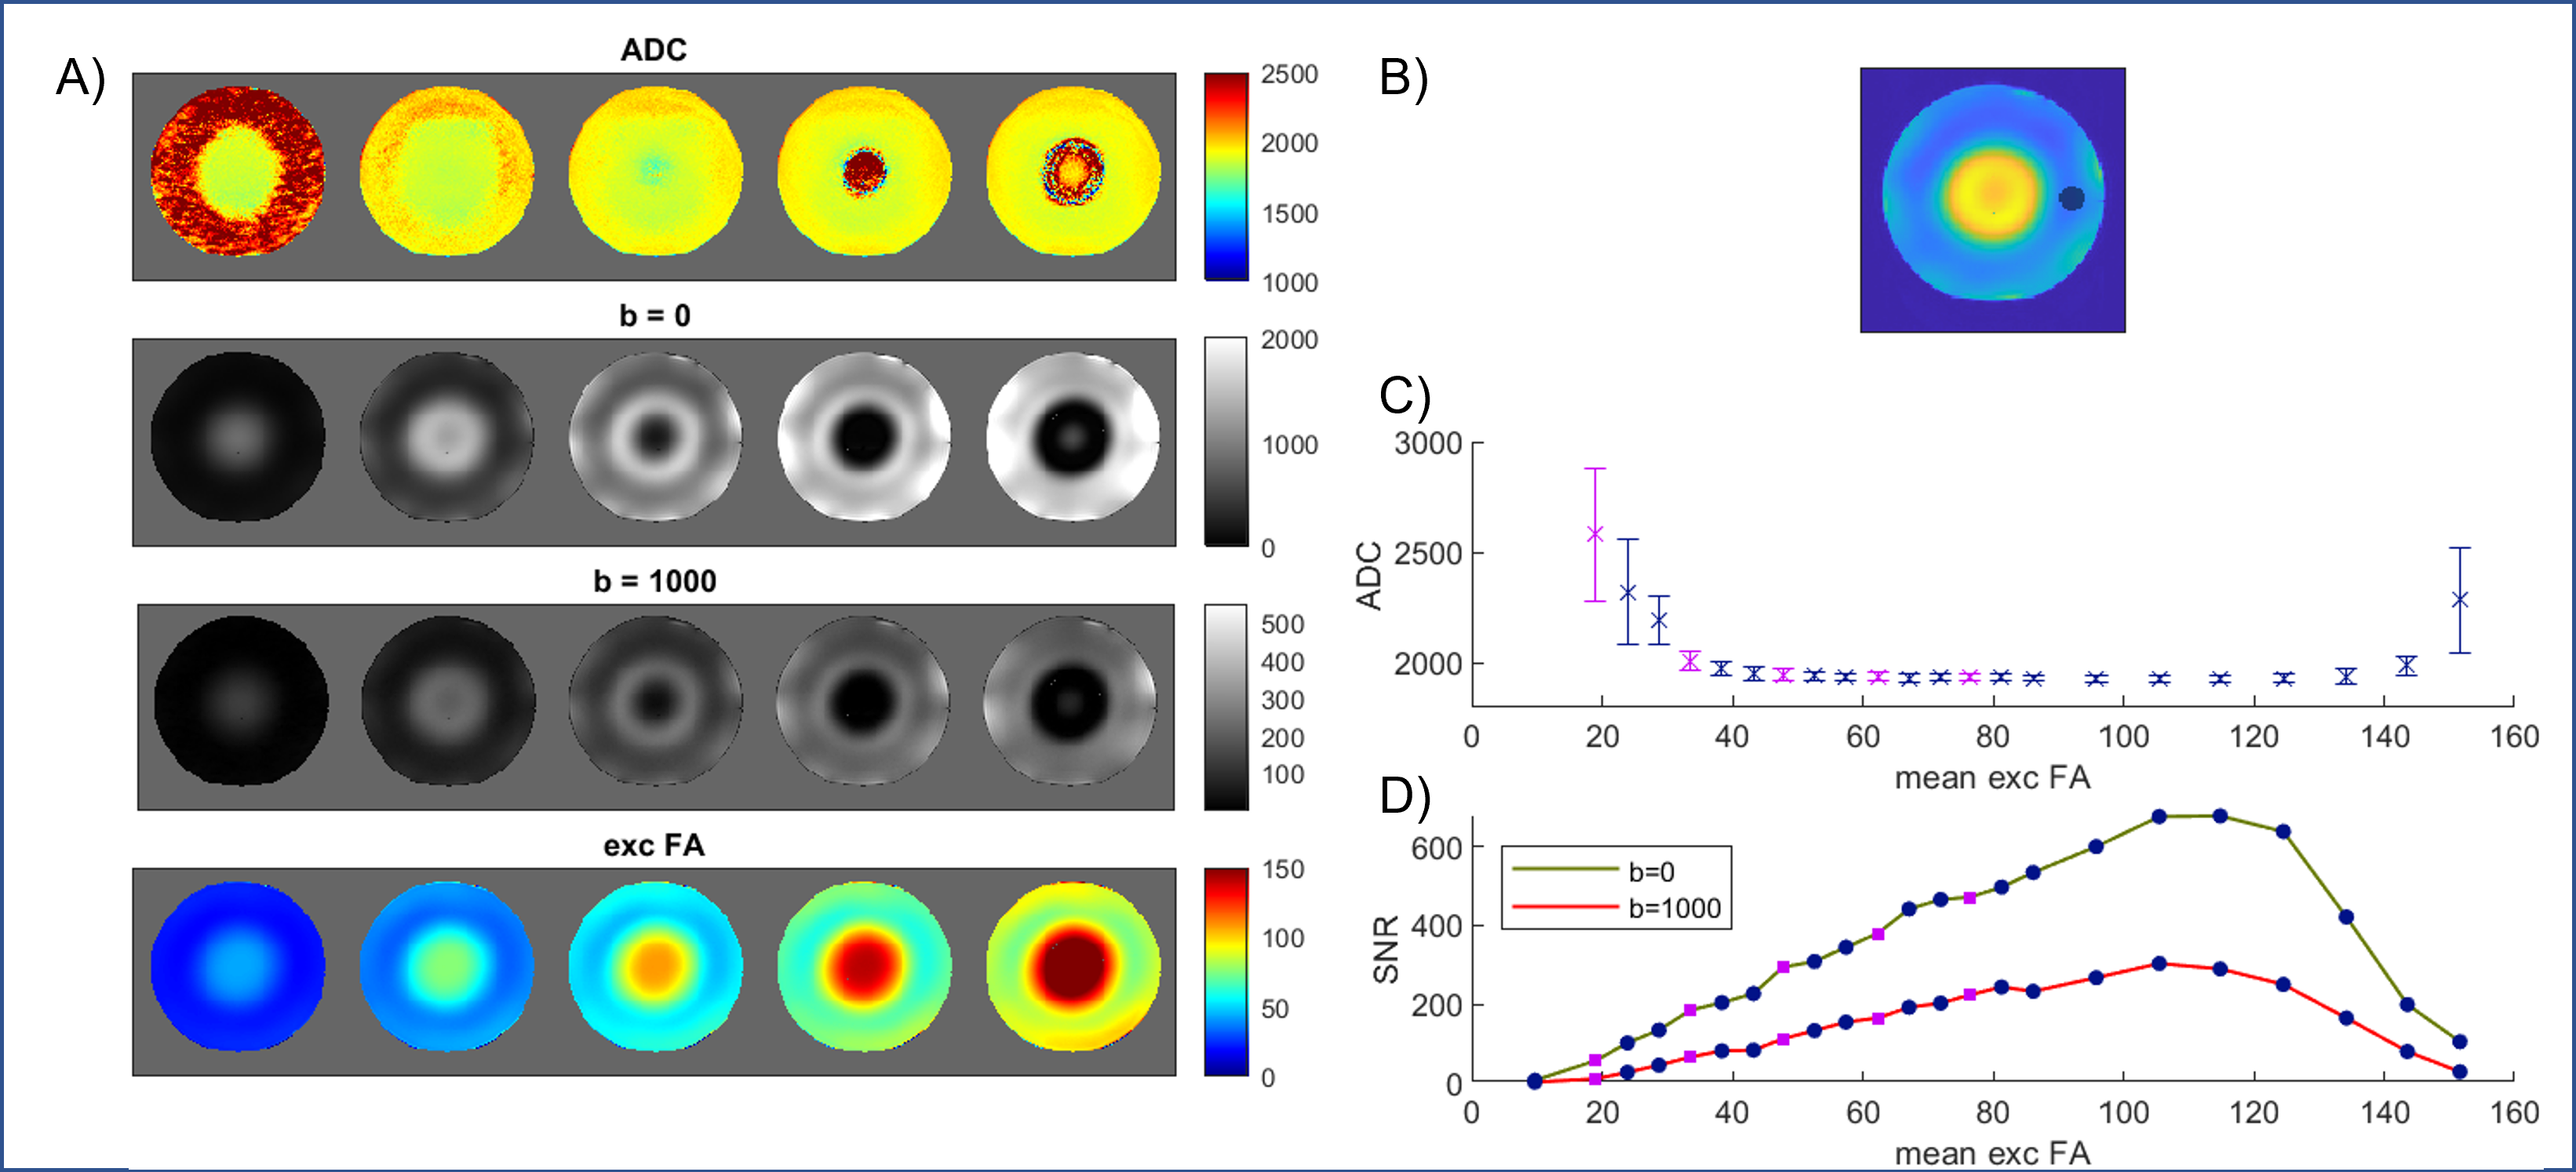
The histogram also indicated pTx-DWI reported lower mean ADC values across the brain than CP-DWI. ROI analysis showed that this change is statistically significant in all cortical and subcortical ROIs (Figure 3B). Upon closer examination, we found that this is driven primarily by differences in ADC values in the inferior slices (Figure 4B). Initial phantom experiments have suggested a relationship between ADC and B1+ (Figure 5), but further simulations and experiments are needed to understand this trend [8].
Conclusion
We have shown that pTx can improve the repeatability for intra-session and inter-session ADC measures in a rsEPI DWI sequence even when different B1-shim coefficients are used for different scan sessions. To our knowledge, this is also the first study to suggest that repeatability performance can be enhanced by using pTx and the results would play an essential role in the push to integrate pTx into clinical research.Acknowledgements
* BD and SNW contributed equally to this work.
We would also like to thank the clinical support staff and radiographers from the Imaging Centre of Excellence, University of Glasgow.
References
[1] Ding, B., Williams, S. N., Dragonu, I., Liebig, P. & Porter, D. A. Parallel transmission for 7T multi-shot diffusion-weighted imaging. ISMRM 2022 Workshop on Ultra-High Field MR (2022).
[2] Porter, D. A. & Heidemann, R. M. High resolution diffusion-weighted imaging using readout-segmented echo-planar imaging, parallel imaging and a two-dimensional navigator-based reacquisition. Magn Reson Med 62, 468–475 (2009).
[3] Williams, S. N. et al. A nested eight-channel transmit array with open-face concept for human brain imaging at 7 tesla. Frontiers in Physics 9, (2021).
[4] Williams, S. N., Dragonu, I., Ding, B., Liebig, P. & Porter, D. A. Simultaneous Multislice pTx for Readout-Segmented Diffusion Imaging at 7 T. in Proc. 30th Annu. Meet. ISMRM, London, UK (2022).
[5] Andersson, J. L. R., Skare, S. & Ashburner, J. How to correct susceptibility distortions in spin-echo echo-planar images: Application to diffusion tensor imaging. Neuroimage 20, 870–888 (2003).
[6] Jenkinson, M. & Smith, S. A global optimisation method for robust affine registration of brain images. Med. Image Anal. 5, 143–156 (2001).
[7] National Electrical Manufacturers Association. Determination of Signal-to-Noise Ratio (SNR) in Diagnostic Magnetic Resonance Imaging. (2021).
[8] Jochimsen, T. H., Schäfer, A., Bammer, R. & Moseley, M. E. Efficient simulation of magnetic resonance imaging with Bloch–Torrey equations using intra-voxel magnetisation gradients. Journal of Magnetic Resonance 180, 29–38 (2006).
Figures