4411
Comparing parallel transmit 2-spoke against circularly polarized pulses for 7T whole brain diffusion MRI1Wolfson Brain Imaging Centre, University of Cambridge, Cambridge, United Kingdom, 2Siemens Healthcare Limited, Camberley, United Kingdom, 3Siemens Healthcare GmbH, Erlangen, Germany
Synopsis
Keywords: Parallel Transmit & Multiband, Diffusion Tensor Imaging
Diffusion MRI (dMRI) is inherently limited by SNR. 7T scans increase intrinsic SNR but suffer from regions of signal dropout, especially in temporal lobes and cerebellum. We applied dynamic parallel transmit (pTx) to allow whole-brain 7T dMRI and scanned 7 volunteers comparing pTx 2-spoke and circularly polarized pulses.
PTx 2-spoke scans increased whole-brain mean temporal SNR increased by 22%, produced cleaner fractional anisotropy maps, and reduced fiber estimation uncertainty by 4% (P=0.016) for first fibers and 2% (P<0.001) for second fibers. However, less restrictive SAR limits will be needed for clinical translation of our approach due to long scan time.
Introduction
Diffusion MRI (dMRI) is limited by low signal-to-noise ratios (SNR). Previous studies have shown that imaging at 7T makes it feasible to acquire high resolution dMRI images1, and that static parallel transmission (pTx) reduces transmit field inhomogeneities and improves SNR especially in the lower parts of the brain2.In this work, we compare the performance of 2-spoke dynamic pTx pulses against circularly polarized (CP, “TrueForm”) pulses for dMRI across seven subjects, with matching excitation slice profiles of the two pulses.
Methods
AcquisitionSeven volunteers (3 male, 4 female) were scanned in a MAGNETOM Terra 7T Scanner (Siemens) with an 8Tx/32Rx head coil (Nova Medical). Acquisition protocol is summarized in Figure 1a.
Diffusion MRI was performed with our single-shot echo planar imaging sequence (Figure 1b) initially in the default circularly polarized transmit mode with 2 b-values (1000 and 2000 s/mm2) and 12 diffusion directions in each shell. The whole brain is covered in 72 transverse slices with 30% gap, 1.5 mm isotropic voxels, 65 ms TE, 1510 Hz/px bandwidth, 3x GRAPPA and 6/8 partial Fourier in plane acceleration, and 7800 ms TR. The excitation and refocusing flip angles were 80° and 140°. The default 110° CP fat saturation pulse was used throughout. Images with no-diffusion encoding (b=0 s/mm2) were acquired with the same parameters, in two phase encoding directions (AP and PA) to allow distortion corrections. The PA images were acquired with 10 repeats to measure temporal SNR (tSNR).
T1-weighted structural images were acquired with MP2RAGE3 at 0.75mm isotropic resolution in CP mode in sagittal orientation.
Per-subject pTx pulse optimization (detailed below) was faster than the MP2RAGE scan, so it did not prolong the overall acquisition protocol. PTx-dMRI scans were then acquired as described above but using the per-subject 2-spoke pulses and a longer 25s TR. For the final 2 subjects, 10 repeats of PA images were also acquired with 1-spoke (RF shim) pulses for tSNR comparison.
Pulse Design
The spoke pulses for the pTx acquisitions were calculated offline in MATLAB (Mathworks, USA). B0 and B1+ field maps were acquired with the vendor’s default adjustment sequences. The whole imaging volume was divided into 8 equal sub-volumes, comprising 9 slices each. A pair of excitation and refocusing pulses were designed for each sub-volume.
Each pulse consisted of two spokes. Spoke locations were determined with iterative Fourier transform-based approach. The complex coefficients of both spokes were then jointly optimized using the magnitude least squares (MLS)4 algorithm applying the small tip angle (STA) approximation, and using Tikhonov regularization on the L2 norm of the RF amplitude. MLS pulse design used the ΔB0 and per-channel B1+ maps for all slices in the slab.
To reduce SAR and pulse duration, the pulses were converted to variable-rate selective excitation (VERSE)5 pulses. Bloch simulations show that the CP, pTx and pTx VERSE pulses have the same slice thickness.
Data processing
The dMRI data were processed with FSL. Distortion correction was performed with ‘topup’6, followed by eddy current correction with ‘eddy’7. Tensor fitting was performed with ‘dtifit’, probabilistic fibre estimation with ‘bedpostx’8. Data were registered and projected to the MNI 152 common space via the T1w structural image with ‘flirt’9 for statistical analyses.
Results and discussion
Figure 1c shows the RF and gradient waveforms of a pair of excitation and refocusing pulses. The mean flip angle RMSE reduced by 39% for excitation and 33% for refocusing with 2-spoke VERSE pulses compared to CP.Figure 2(a-c) compares the raw signal intensity, where CP images shows signal dropouts in the inferior parts of the temporal lobes as well as the cerebellum, while pTx 2-spoke pulses produced more signal in these areas and resulted in a uniform intensity profile in the coronal view. Across all subjects, the mean whole-brain intensity increased by 41% with 2-spoke vs CP pulses. The pTx pulses improved temporal SNR (tSNR) over the whole brain (22% increase from CP and 7.6% increase from 1-spoke) (Figure 2 (d-f)).
The dynamic pTx pulses produced less noisy fractional anisotropy maps especially in the inferior parts of the brain as shown in Figure 3.
The mean sum squared error (SSE) of DTI fitting improved (0.663 with 2-spokes pTx vs 0.675 with CP, P= 0.016). A histogram of the voxelwise comparison of the SSE is shown in Figure 4b, where 23% of voxels showed statistically significant decrease. Figure 4c shows small but statistically significant decreases in the whole-brain mean dispersion for both the first (4% decrease, P= 0.016) and the second (2% decrease, P< 0.001) fibers.
In the pTx acquisitions, the TR is severely restricted by SAR, hence taking 3 times as long as the equivalent CP scans. This is due to both the higher pulse energy in pTx (detailed in Table 1) and the conservative 6-minute average power limit of 8 W total and 1 W per channel enforced by the vendor.
Conclusions
We have successfully applied subject-specific 2-spoke dynamic pTx pulses for whole-brain diffusion MRI. Compared to scans with circularly polarized (CP) pulses, whole-brain flip angle RMSE reduced and whole-brain tSNR increased. Diffusion tensor fitting of the pTx data had lower uncertainty. Less restrictive SAR limits will be needed for clinical translation of our approach.Acknowledgements
MZ is supported by the Medical Research Council (grant number MR N013433-1) and the Cambridge Trust. BD was funded by Gates Cambridge Trust. CTR was supported by a Sir Henry Dale Fellowship from the Wellcome Trust and the Royal Society (098436/Z/12/B). CTR acknowledges Siemens for research support.
This research was supported by the NIHR Cambridge Biomedical Research Centre (BRC-1215-20014). The views expressed are those of the author(s) and not necessarily those of the NIHR or the Department of Health and Social Care.
References
1. Wu, W. et al. High-resolution diffusion MRI at 7T using a three-dimensional multi-slab acquisition. Neuroimage 143, 1–14 (2016).
2. Wu, X. et al. High-resolution whole-brain diffusion MRI at 7T using radiofrequency parallel transmission. Magnetic Resonance in Medicine 80, 1857–1870 (2018).
3. Marques, J. P. et al. MP2RAGE, a self bias-field corrected sequence for improved segmentation and T1-mapping at high field. Neuroimage 49, 1271–1281 (2010).
4. Setsompop, K., Wald, L. L., Alagappan, V., Gagoski, B. A. & Adalsteinsson, E. Magnitude Least Squares Optimization for Parallel Radio Frequency Excitation Design Demonstrated at 7 Tesla With Eight Channels. Magnetic resonance in medicine 59, 908 (2008).
5. Conolly, S., Nishimura, D., Macovski, A. & Glover, G. Variable-rate selective excitation. Journal of Magnetic Resonance (1969) 78, 440–458 (1988).
6. Andersson, J. L. R., Skare, S. & Ashburner, J. How to correct susceptibility distortions in spin-echo echo-planar images: application to diffusion tensor imaging. Neuroimage 20, 870–888 (2003).
7. Andersson, J. L. R. & Sotiropoulos, S. N. An integrated approach to correction for off-resonance effects and subject movement in diffusion MR imaging. Neuroimage 125, 1063–1078 (2016).
8. Jbabdi, S., Sotiropoulos, S. N., Savio, A. M., Graña, M. & Behrens, T. E. J. Model-based analysis of multishell diffusion MR data for tractography: how to get over fitting problems. Magn Reson Med 68, 1846–1855 (2012).
9. Jenkinson, M. & Smith, S. A global optimisation method for robust affine registration of brain images. Med Image Anal 5, 143–156 (2001).
Figures
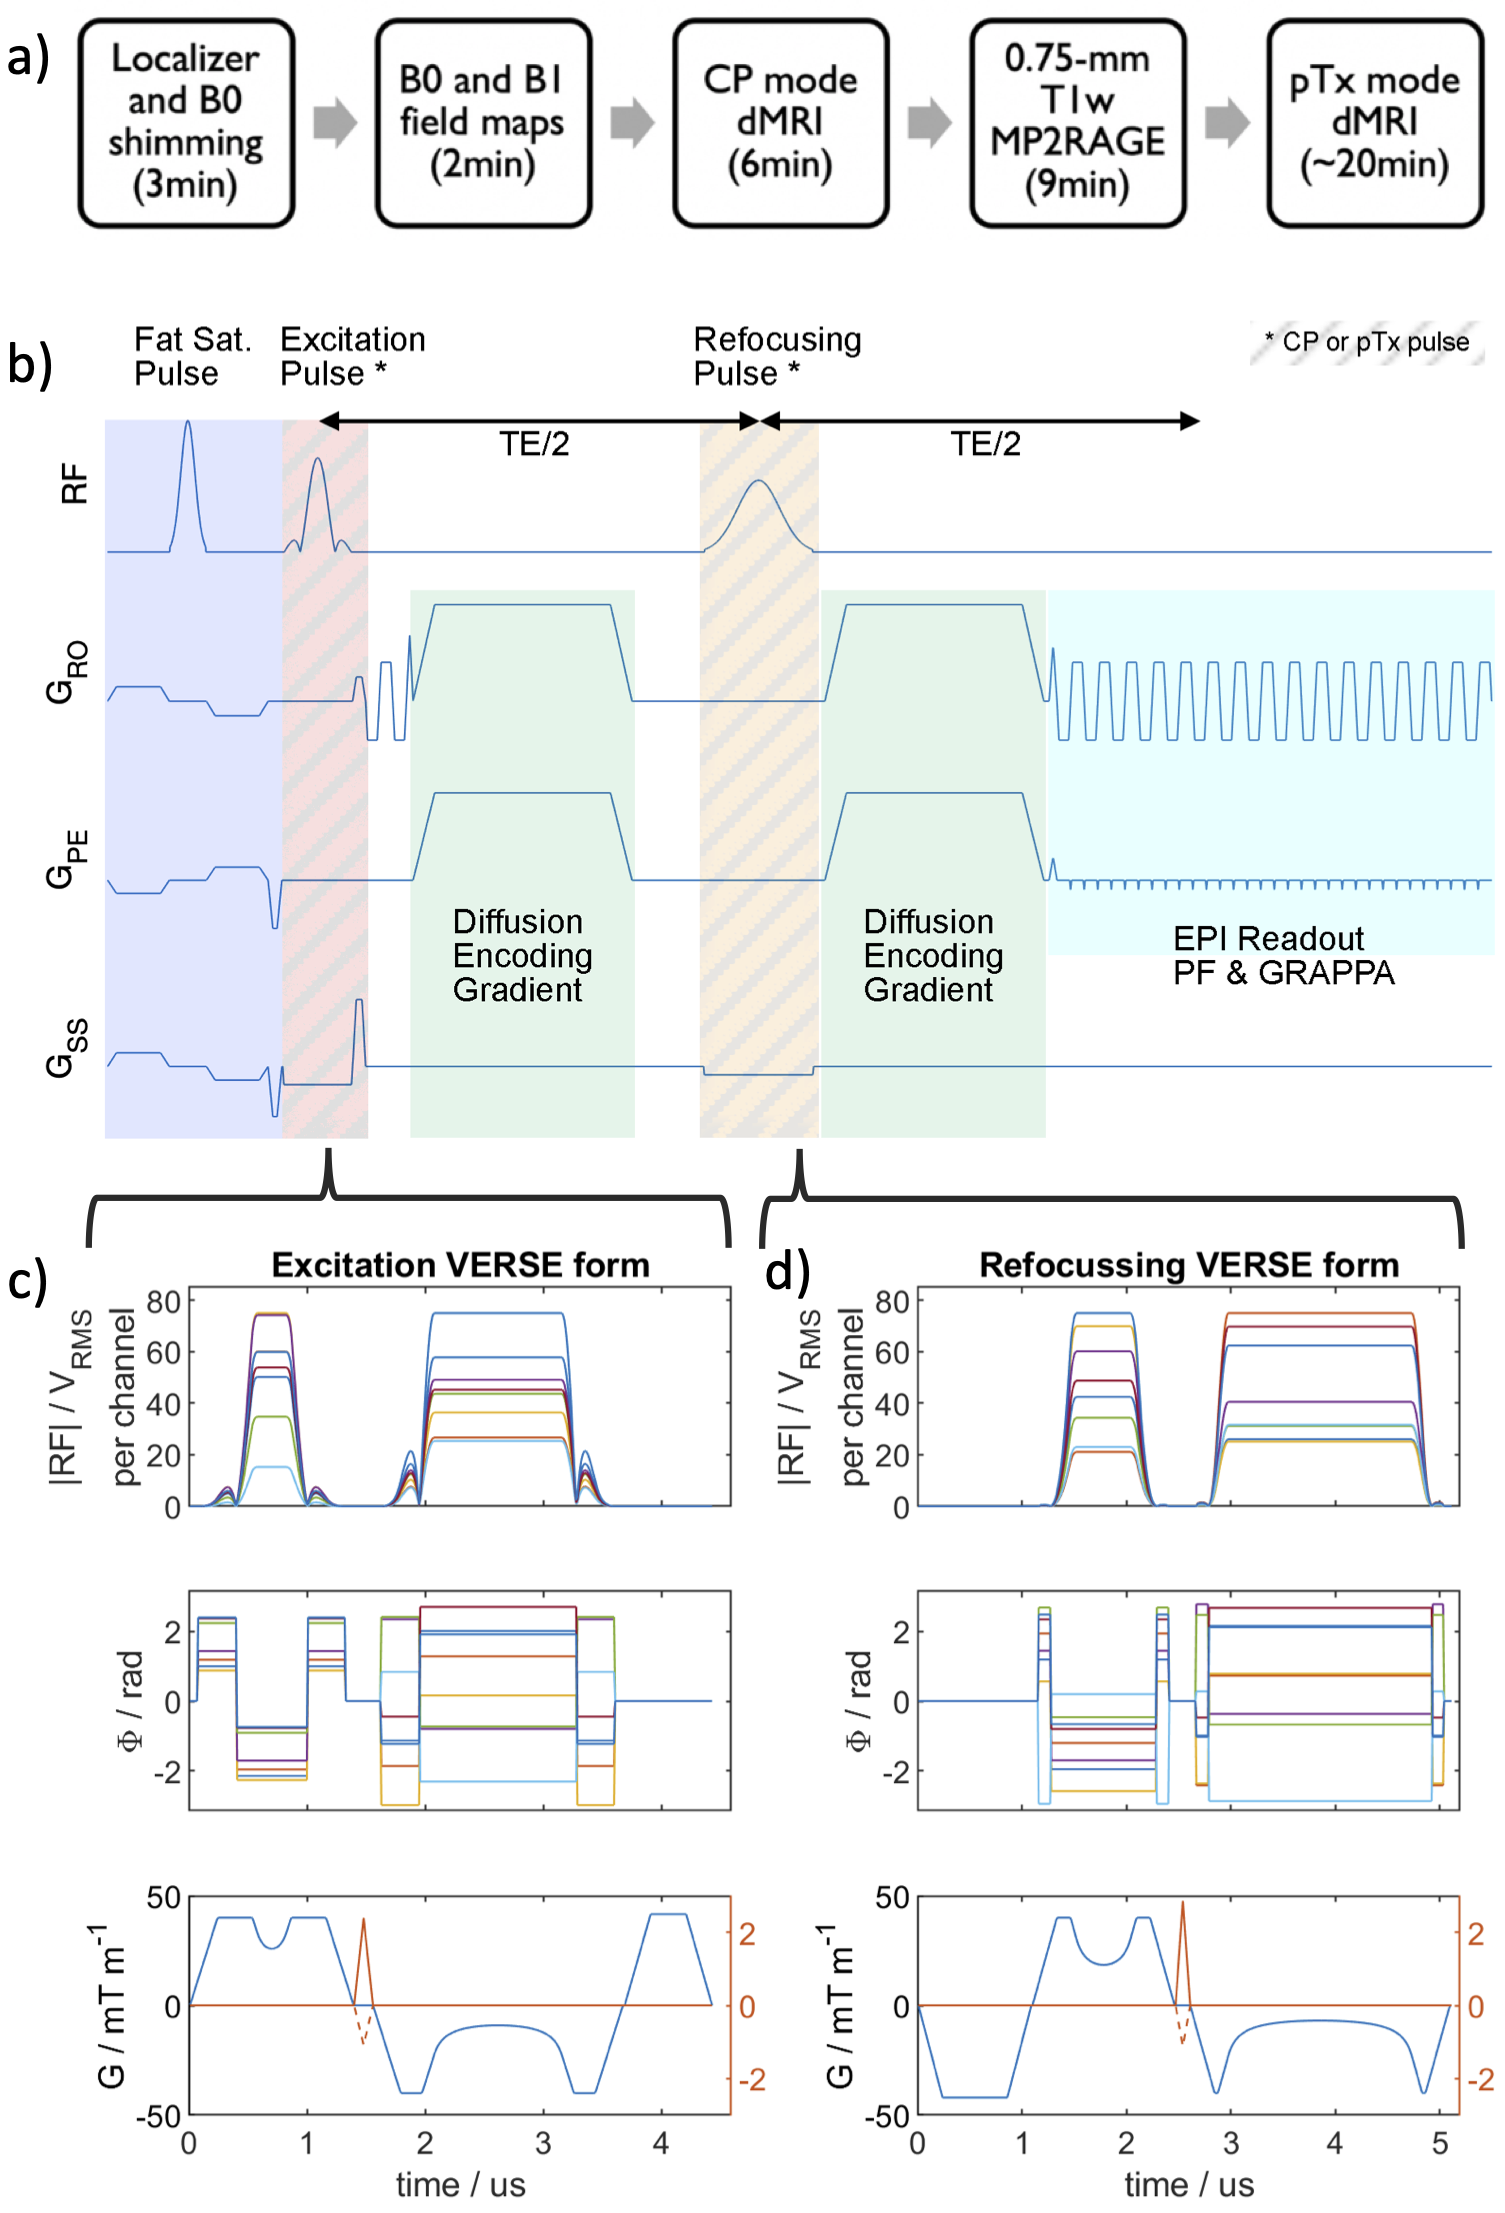
Figure 1 a) The pTx diffusion acquisition protocol. The pulse design was carried out during the CP mode diffusion and MP2RAGE scans and did not add extra time. b) The SS-EPI diffusion sequence diagram. CP or pTx pulses can be used for both excitation and refocusing pulses. The minimum TE is limited by the diffusion gradient and EPI train after the refocusing pulse. c) A typical pair of excitation and refocusing pulses. The pulses are converted to VERSE form to reduce SAR.
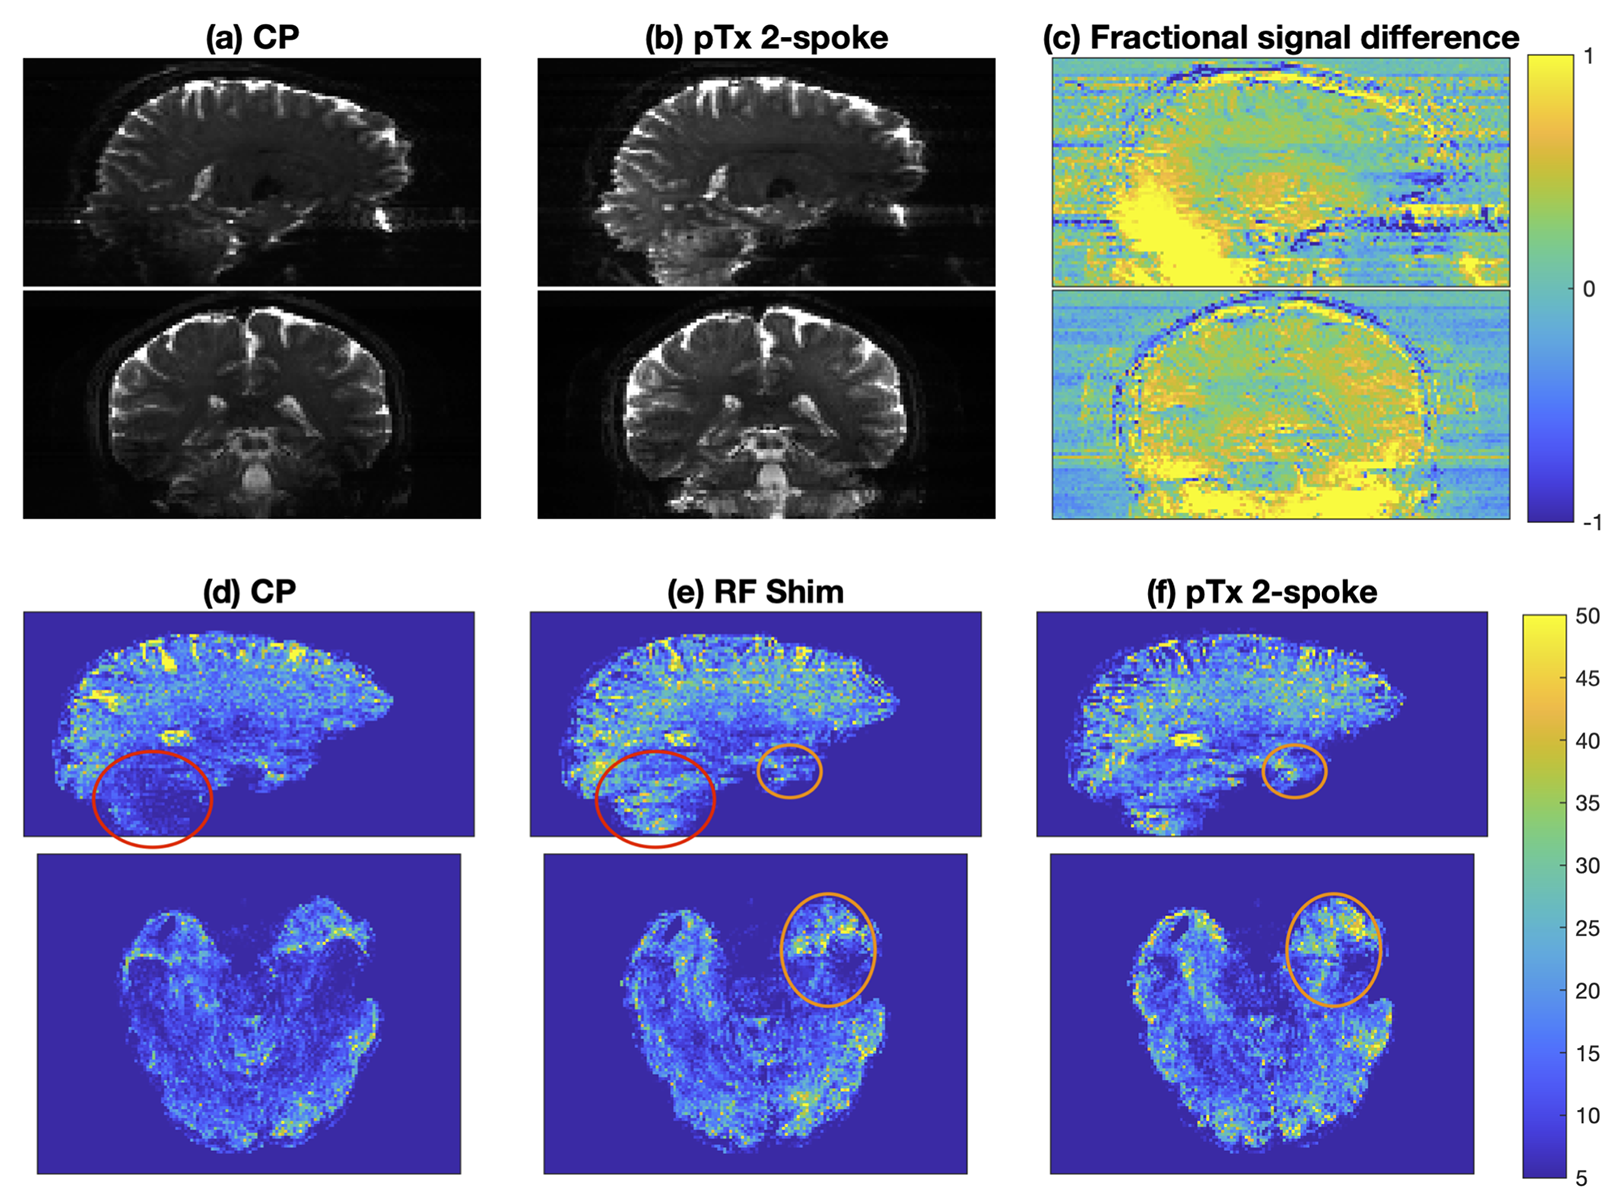
Figure 2 (a-c) The raw b=0 image comparison in one subject between the circularly polarized (CP) mode acquisition and the 2-spoke pTx acquisition. The fractional signal difference is defined as 2(spTx − sCP)/(spTx + sCP), and is plotted over range [-1 1]. (d-f) Comparison of the temporal SNR between the CP, 1-spoke (RF shim) and 2-spoke pTx. The figures are shown for one subject. The red circles highlight the tSNR improvement in the cerebellum area due to the use of pTx pulses; the orange circles highlight the further improvement of the 2-spoke pTx pulses in the inferior temporal lobes.
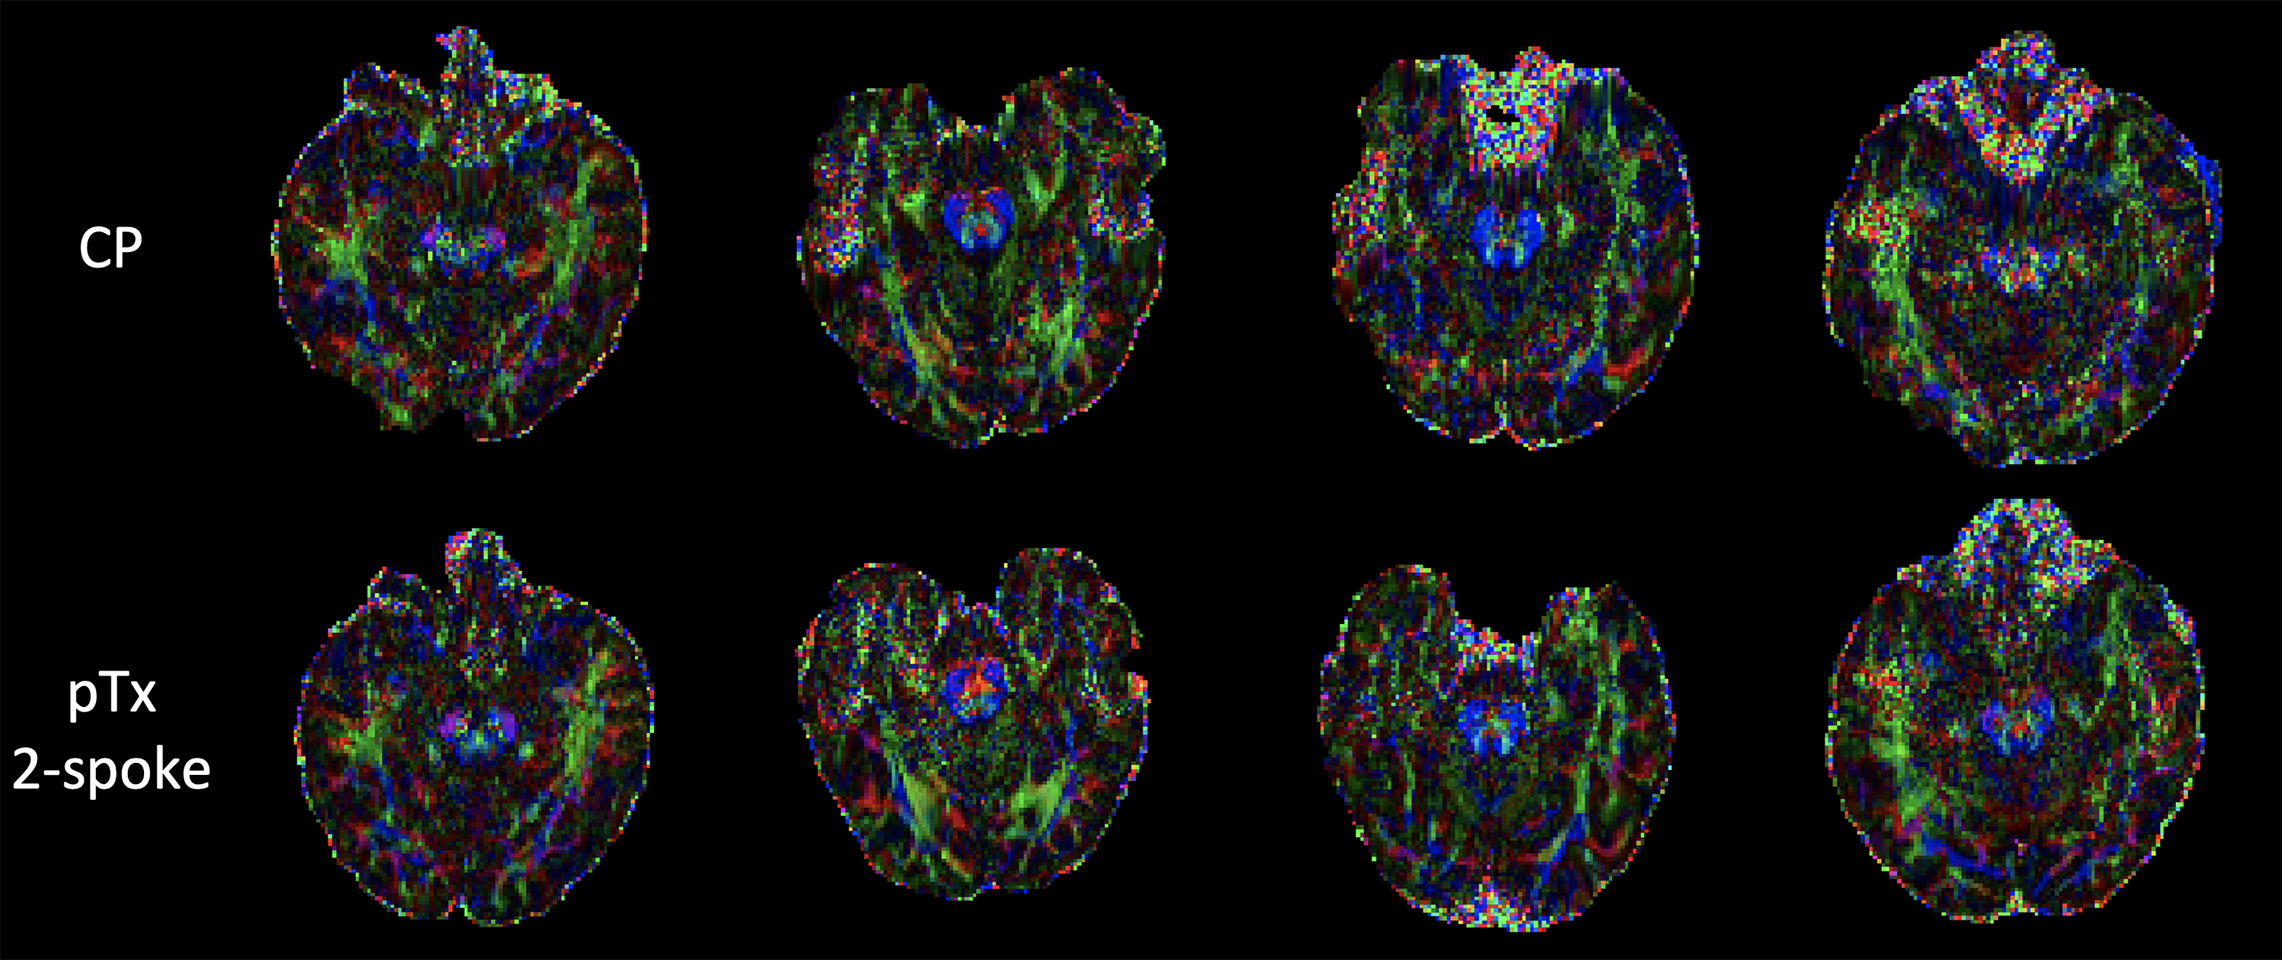
Figure 3 Fractional anisotropy color-coded by the principal diffusion direction (red - left-right; green – anterior-posterior; blue – superior-inferior), for the corresponding slice across temporal lobe and lower occipital lobe in four subjects. The pTx 2-spoke data are less noisy and show better defined fiber orientations.
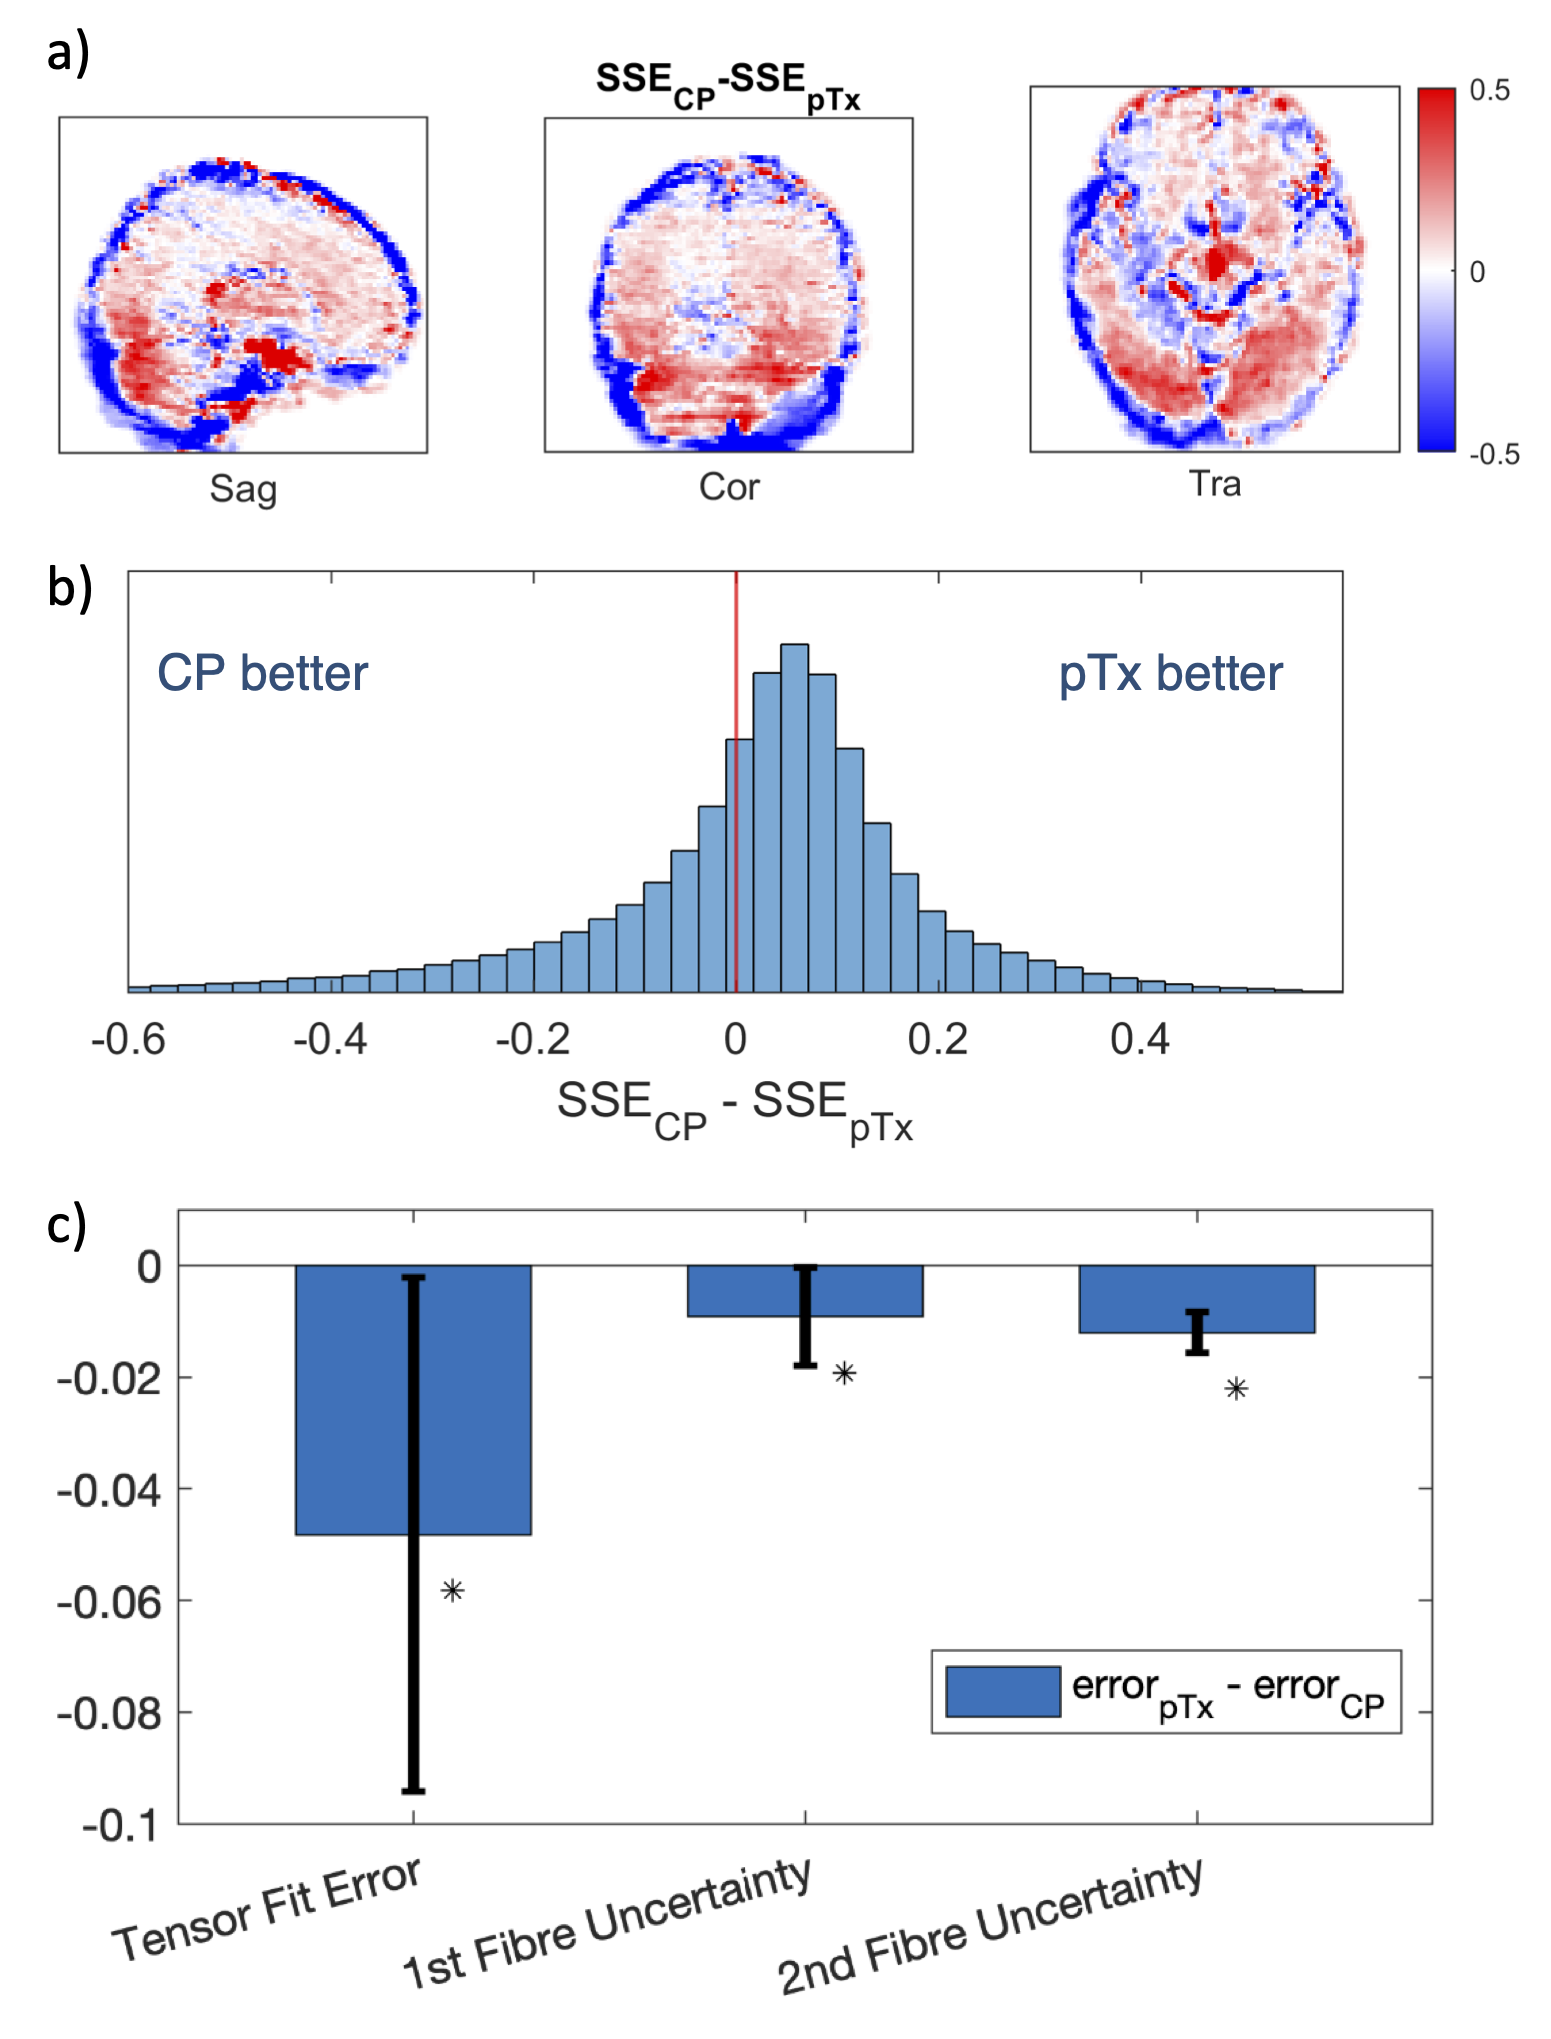
Figure 4 a) The difference in the sum squared error of diffusion tensor fitting between CP and pTx acquisitions averaged across all subjects. Data of all subjects were transformed into MNI space for comparison. MNI coordinates: Sag (x=-10), Cor (y=-40), Tra (z=-10). b) The histogram of the voxelwise diffusion tensor fitting sum squared errors averaged across all subjects. c) Difference in the mean tensor fitting error and the uncertainty in the probabilistic fiber orientation estimation between pTx and CP diffusion data. The * indicates statistical significance.
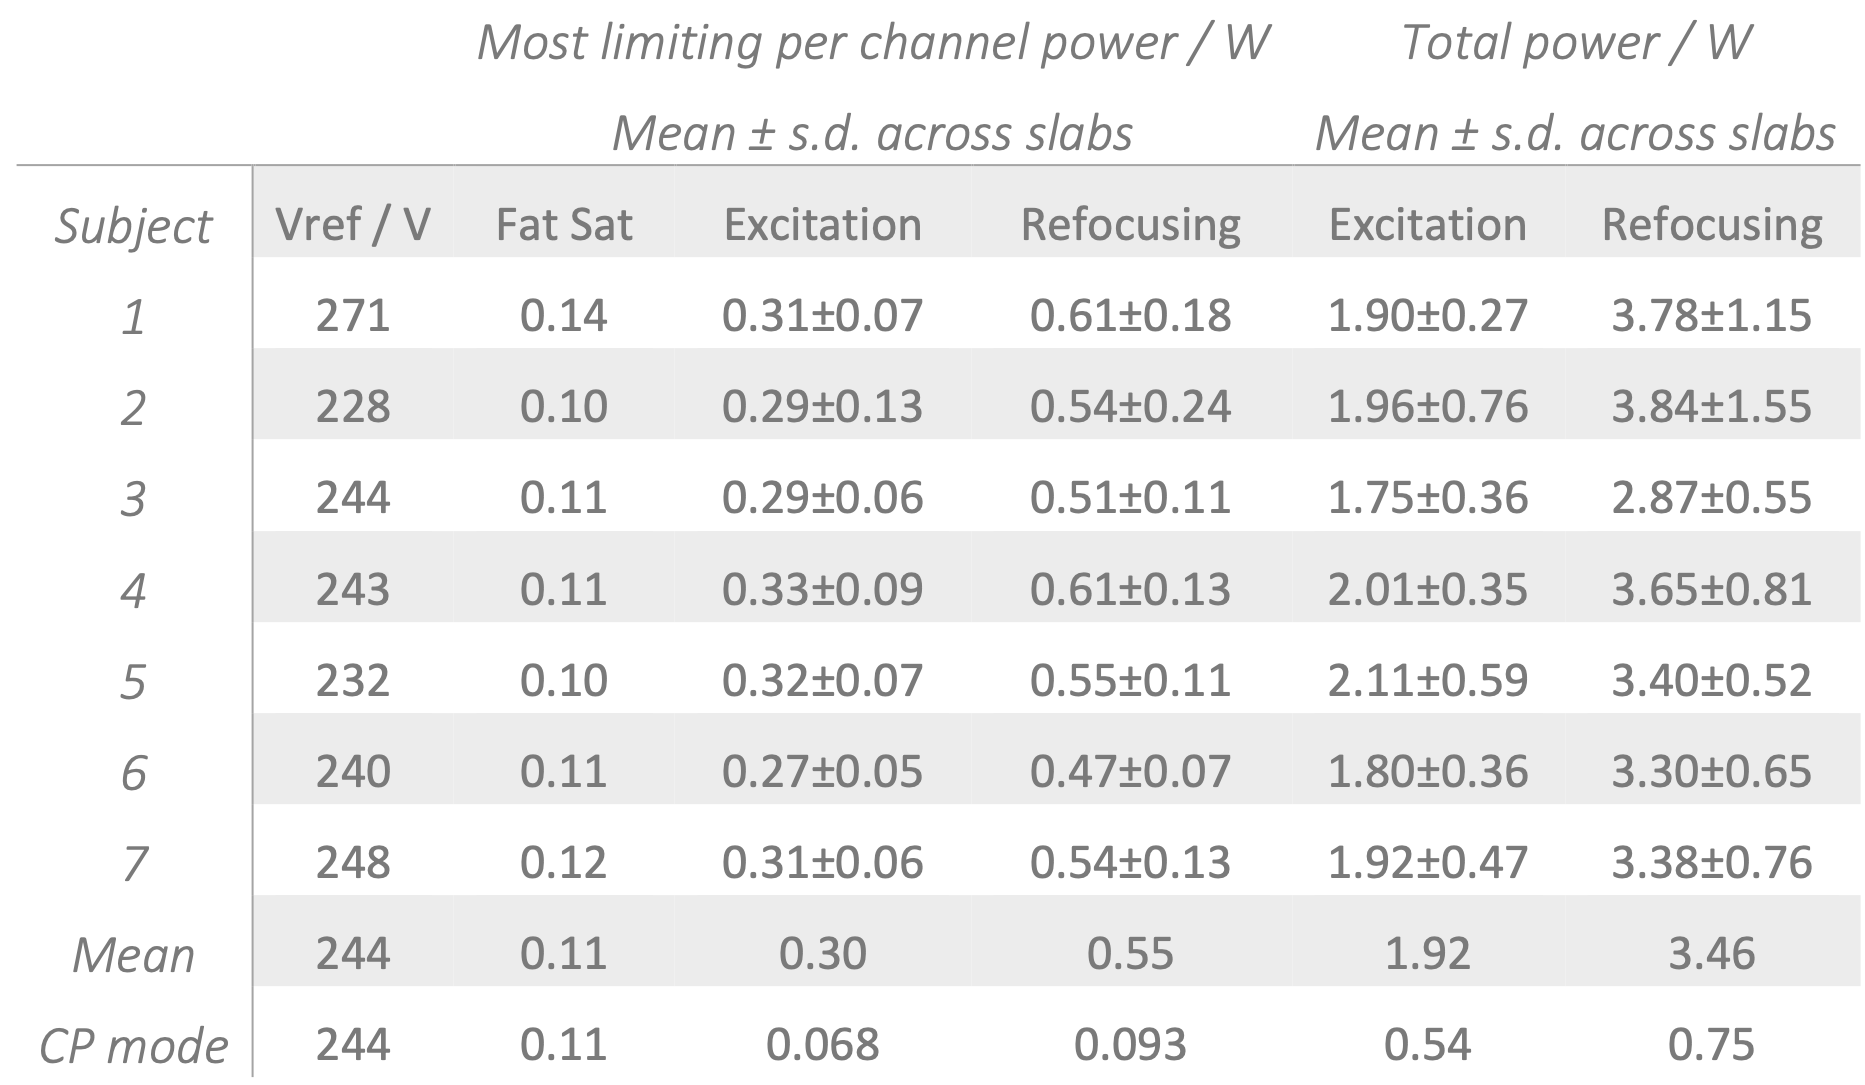
Table 1 The pTx 2-spoke pulse powers in all subjects compared with CP pulses. In pTx mode on 7T Terra systems, the SAR limit for the current ‘diagonal’ VOP model for the Nova 8Tx32Rx coils is 1 W per channel, 8 W total. Powers are calculated for TR=25s, but where the VOP SAR limit is exceeded, the TR was increased accordingly when scanning.