4401
Direct Detection of Peak-like Magnetic Field Fluctuations using Rotary Excitation (REX) based MRI1Department of Internal Medicine I, University Hospital Würzburg, Würzburg, Germany, 2Experimental Physics 5, University of Würzburg, Würzburg, Germany, 3Fraunhofer Institute for Integrated Circuits IIS, Würzburg, Germany, 4Department of Diagnostic and Interventional Neuroradiology, University Hospital Würzburg, Würzburg, Germany, 5Comprehensive Heart Failure Center (CHFC), University Hospital Würzburg, Würzburg, Germany
Synopsis
Keywords: Bioeffects & Magnetic Fields, Pulse Sequence Design, spin-lock
With spin-locking, the resonance of the spin system can be shifted adjustably to the low frequency range for detection of biomagnetic field oscillations. In this study, we demonstrate that spin-locking is also sensitive to peak-like magnetic field fluctuations with broader spectral width. Simulations and measurements demonstrate that, in addition to the application of imaging neural oscillations, the spatially resolved detection of biomagnetic peaks is possible. Initial results show a high agreement between simulations and experiments and mark a first step towards spin-lock based diagnostics of biomagnetic activity, e.g. imaging of the cardiac conduction system.Introduction
MRI is a highly versatile imaging modality allowing spatially resolved extraction of functional information from the human body. The most popular example regarding functional MRI is BOLD (blood-oxygenation-level-dependent) imaging, which indirectly traces neuronal activity [1]. A method for direct detection of neural fields was first proposed in [2] and later piloted in [3] for imaging alpha oscillations in the brain. Here, the detection principle relies on a resonant interaction of ultra-weak magnetic field oscillations with the effective magnetization in the spin-lock (SL) state. In case the oscillation frequency matches the spin-lock frequency, Rotary Excitation (REX) occurs where biomagnetic oscillations are absorbed like pseudo RF pulses leading to a measurable deflection of magnetization [4]. In previous work [2-4], this concept was used solely for the detection of sinusoidal oscillations with a single frequency component. In this study, we demonstrate that spin-locking is also suited for the detection of magnetic fluctuations with a broad frequency spectrum. This novel generalizing approach could pave the way for dedicated MRI methods aimed at direct imaging of more general waveforms, including peak-like biomagnetic fields similar to the QRS complex occurring, e.g., in the cardiac conduction system.Methods
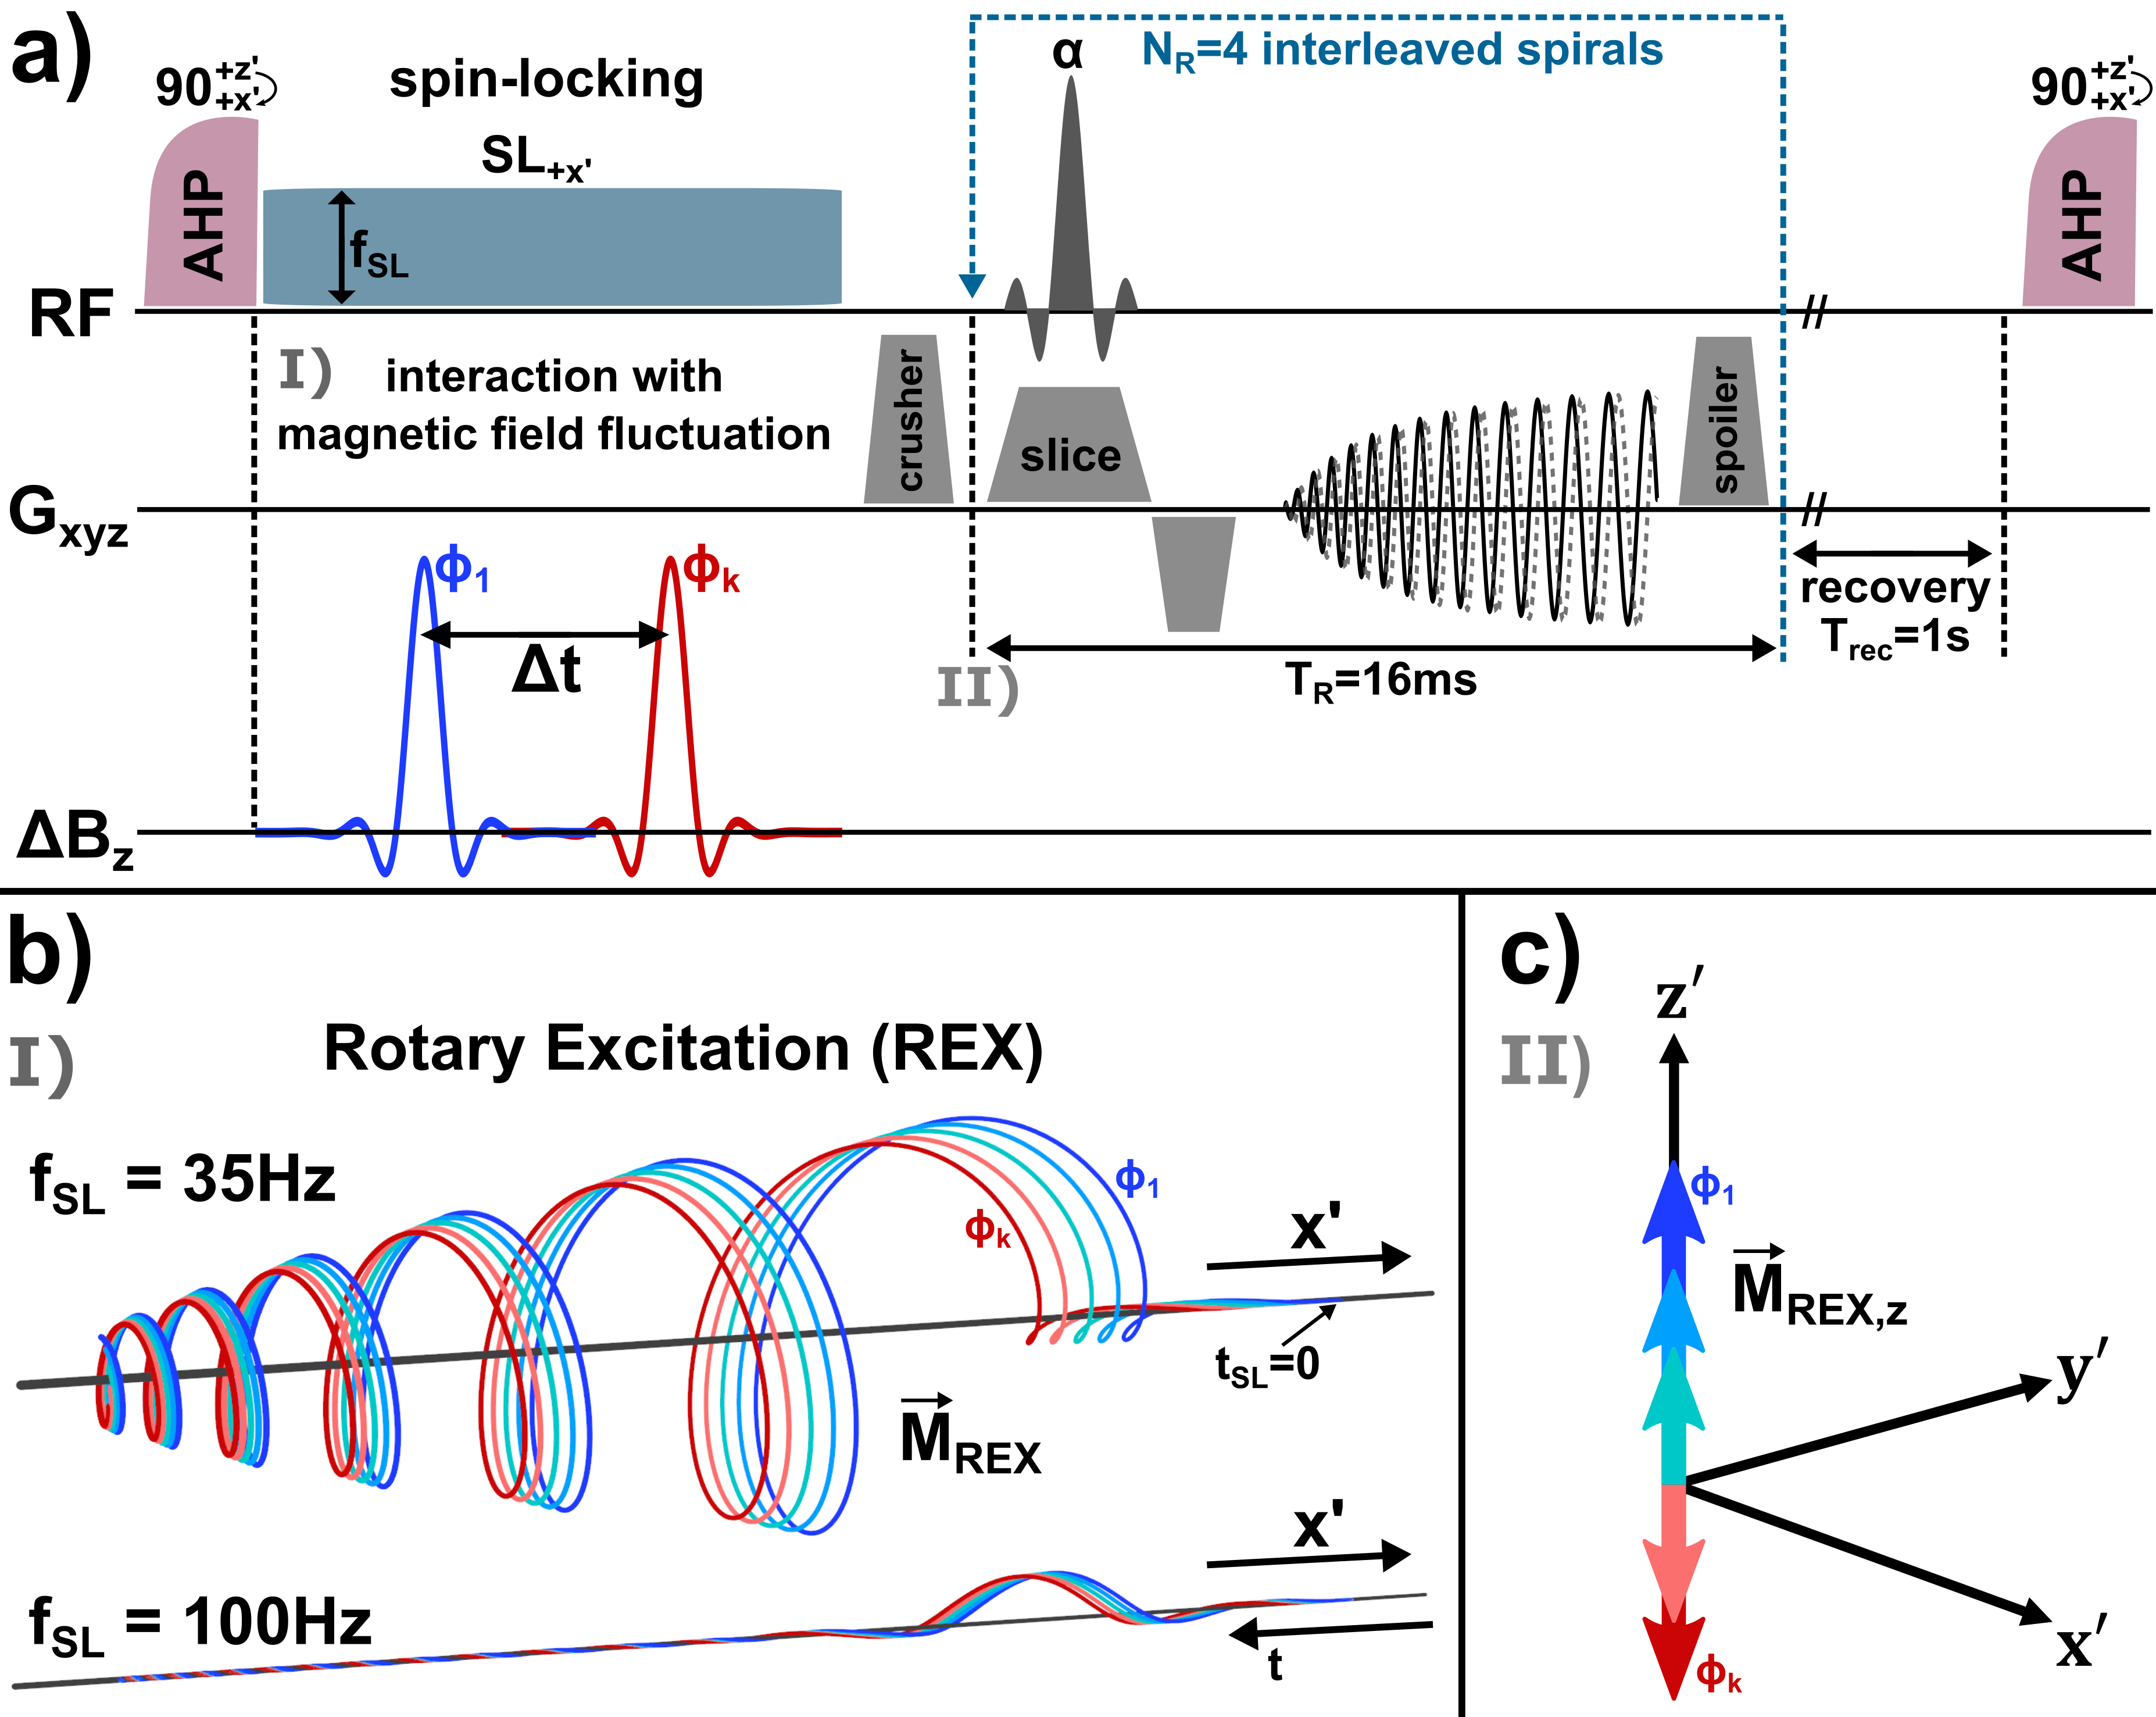
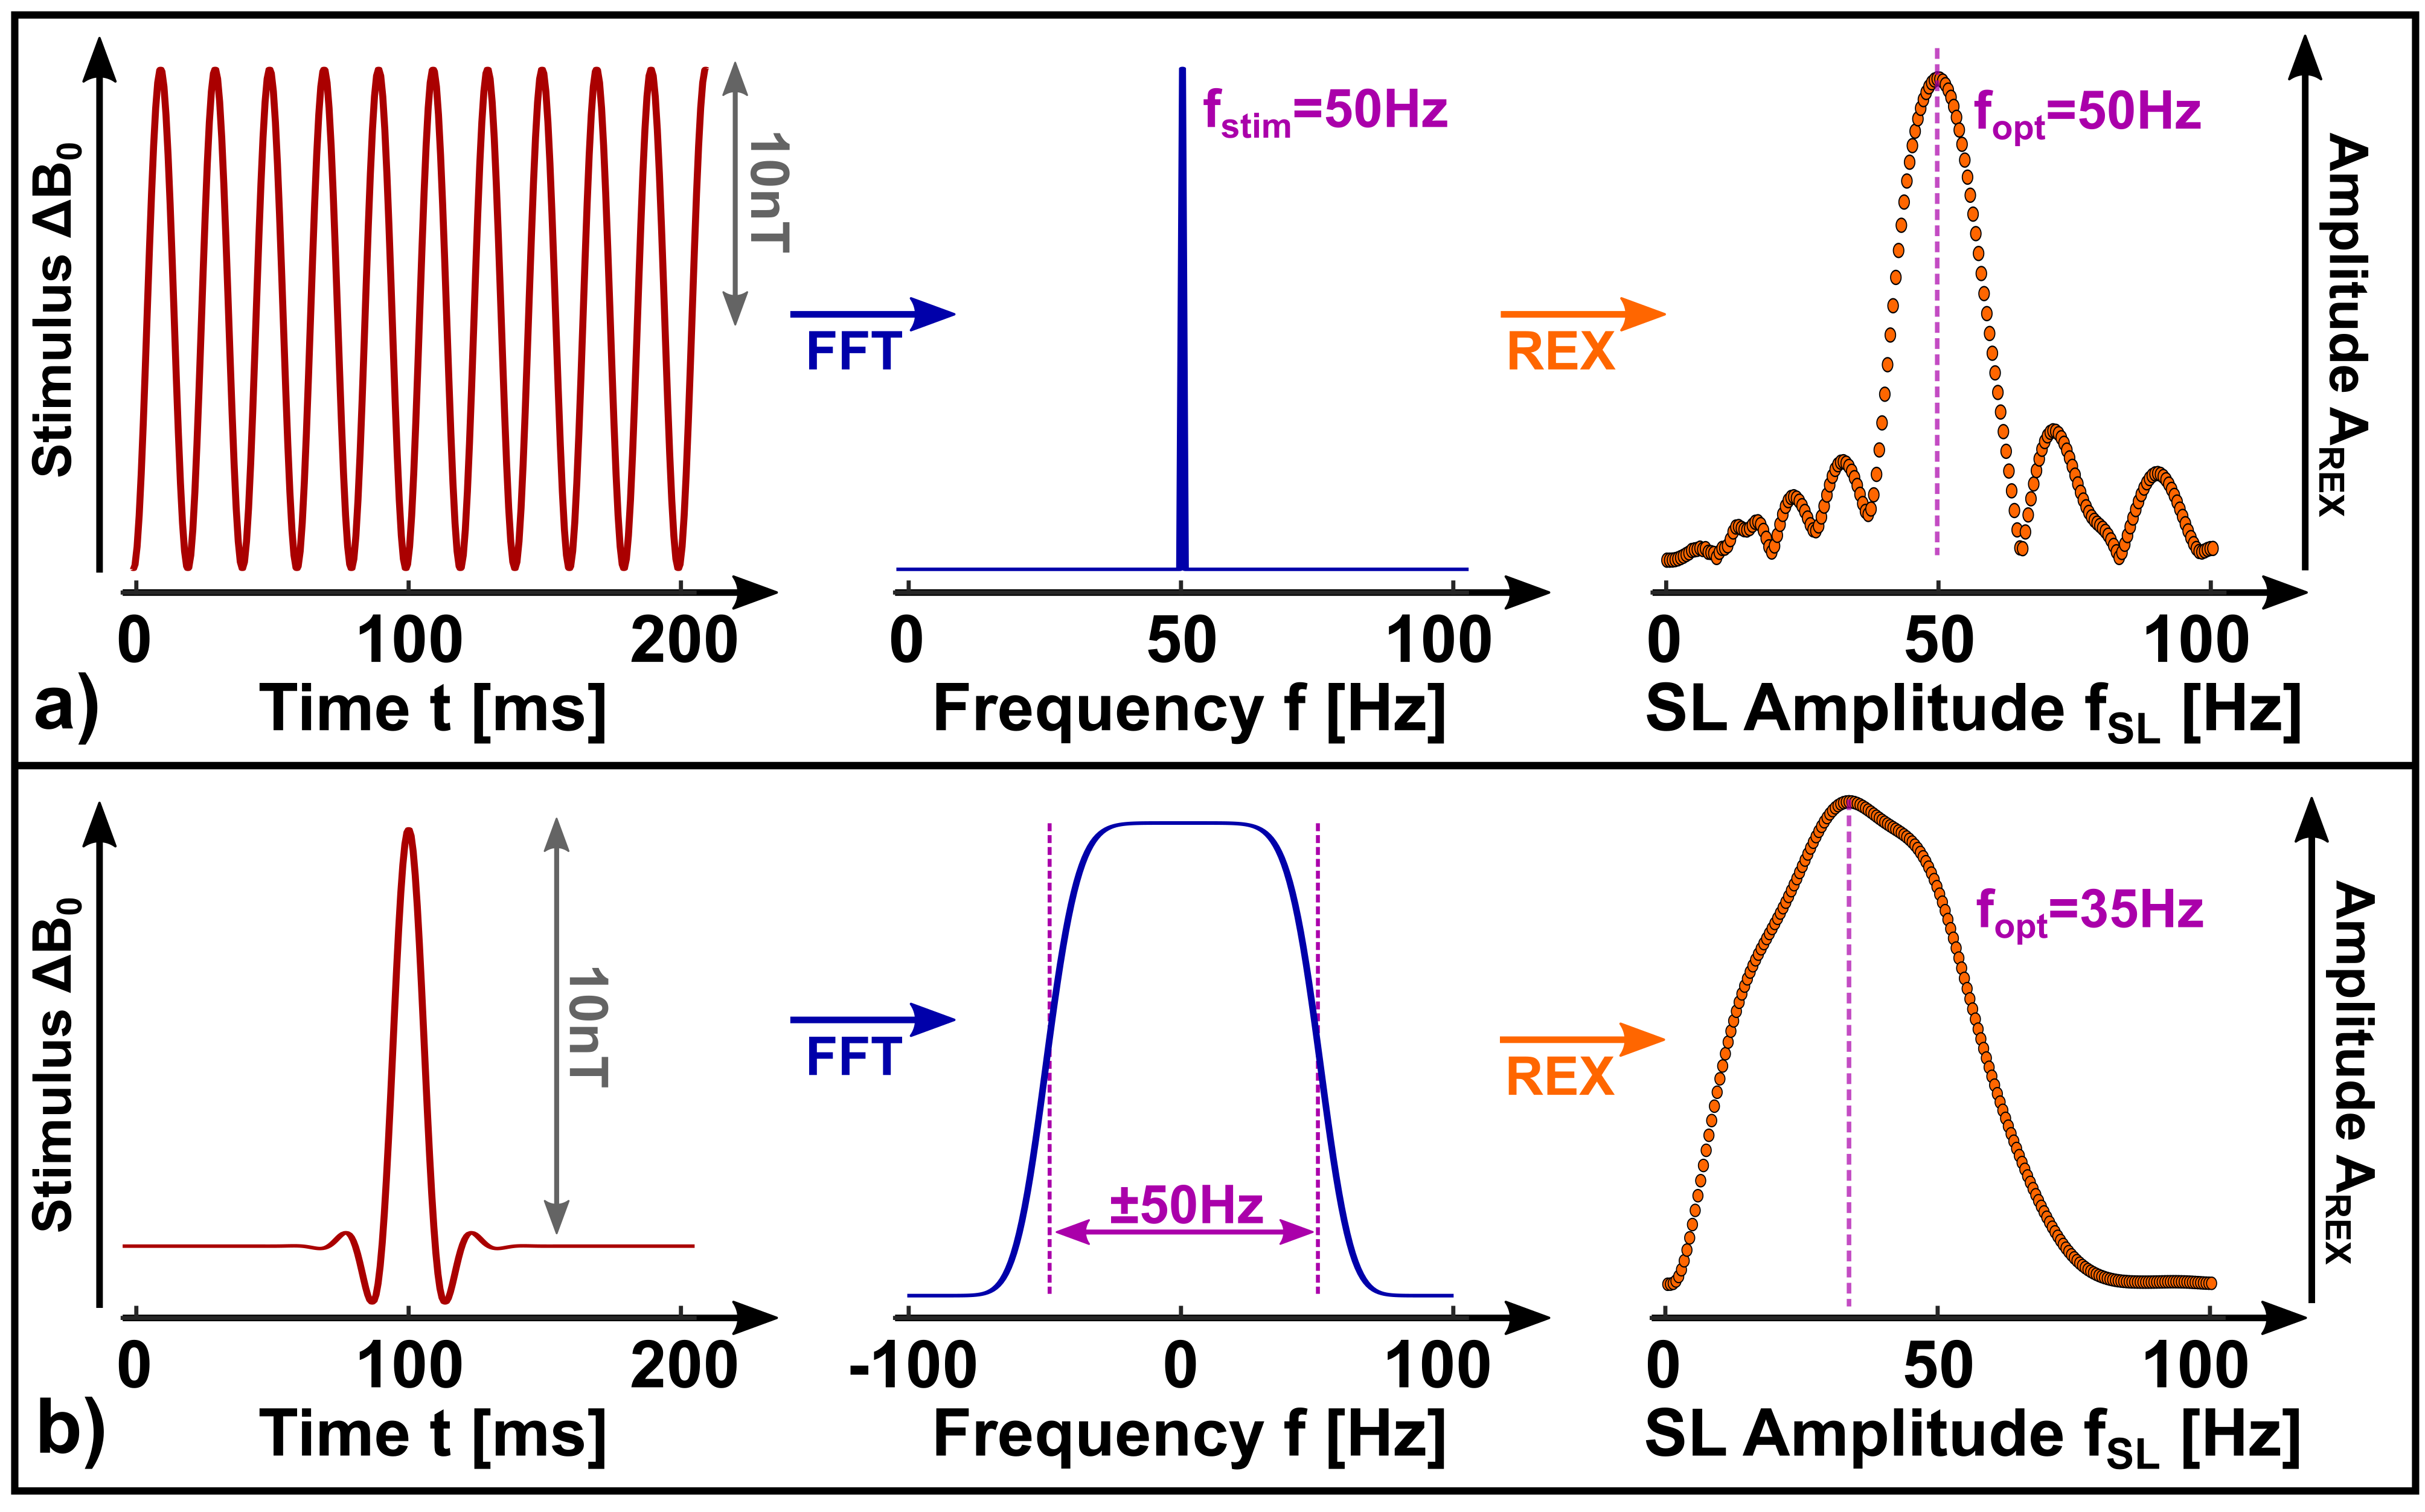
The new concept for REX-based detection of biomagnetic fluctuations is summarized in the sequence diagram in Fig. 1. The detection is performed by analyzing the signal variation of spin-locked magnetization in several experiments, whereby the temporal position of the magnetic peaks with respect to the SL pulse varies. In accordance with the detection of magnetic oscillations, the standard deviation of the signal is used as the detection measure and is referred to as AREX. In this work, truncated sinc-shapes were assumed for the magnetic fluctuations, which were roughly modeled to the properties of a QRS complex of cardiac conduction (QS interval <100ms). This model provides an approximately rectangular frequency distribution with ±50Hz. In the first step, the REX effect for this scenario was investigated based on Bloch simulations (Matlab R2018b, The MathWorks, Massachusetts, USA). Here, the focus was to explore whether REX resonance occurs similar to the absorption of a sinusoidal oscillation. For this, the simulation was repeated for different SL frequencies in the range fSL=0…100Hz. Subsequently, the new detection concept was validated in phantom experiments (Agarose gel). The magnetic QRS peaks were generated utilizing the built-in gradient system of the MRI scanner [4]. The resonance behavior was experimentally validated by varying the SL amplitude fSL=0…100Hz for a fixed peak amplitude of 50nT. Finally, the peak amplitudes were varied in the range 1…100nT for a fixed fSL in the resonance condition. All phantom experiments were performed on a clinical 3.0T scanner (MAGNETOM Skyra, Siemens, Erlangen, Germany) using a 20-channel head coil. The REX-sequence was implemented within the open-source Pulseq framework [5].Results
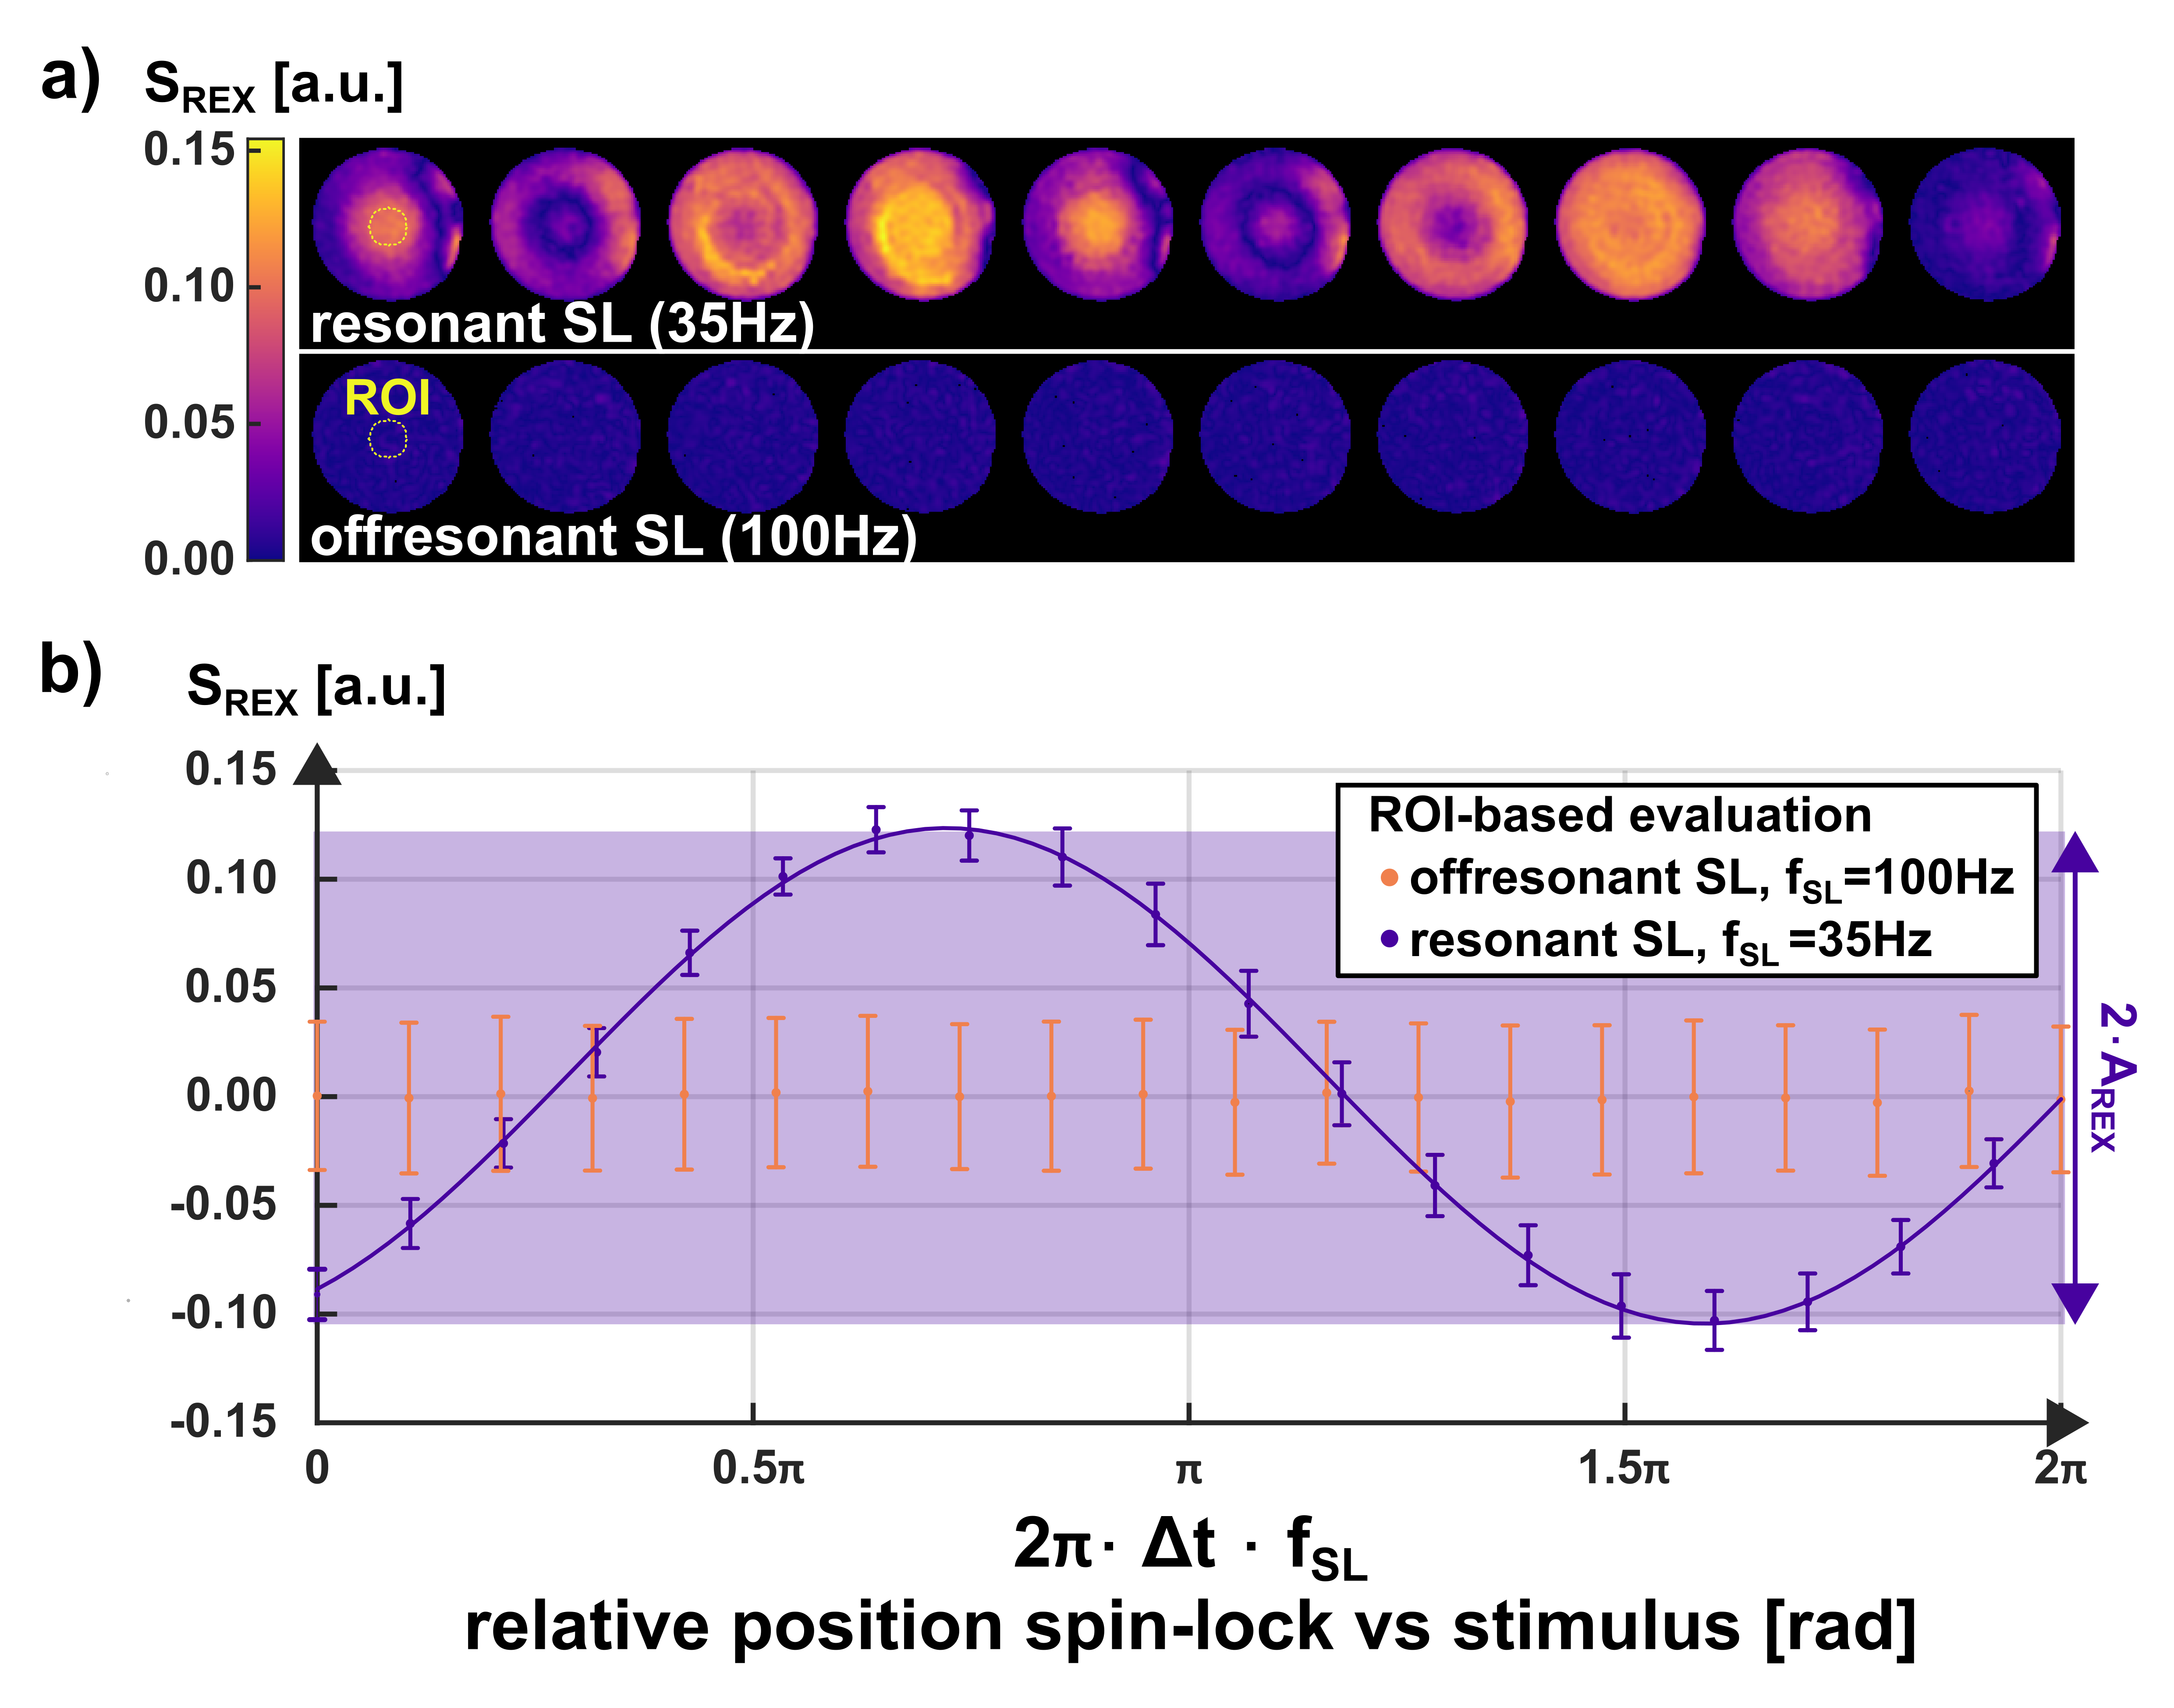
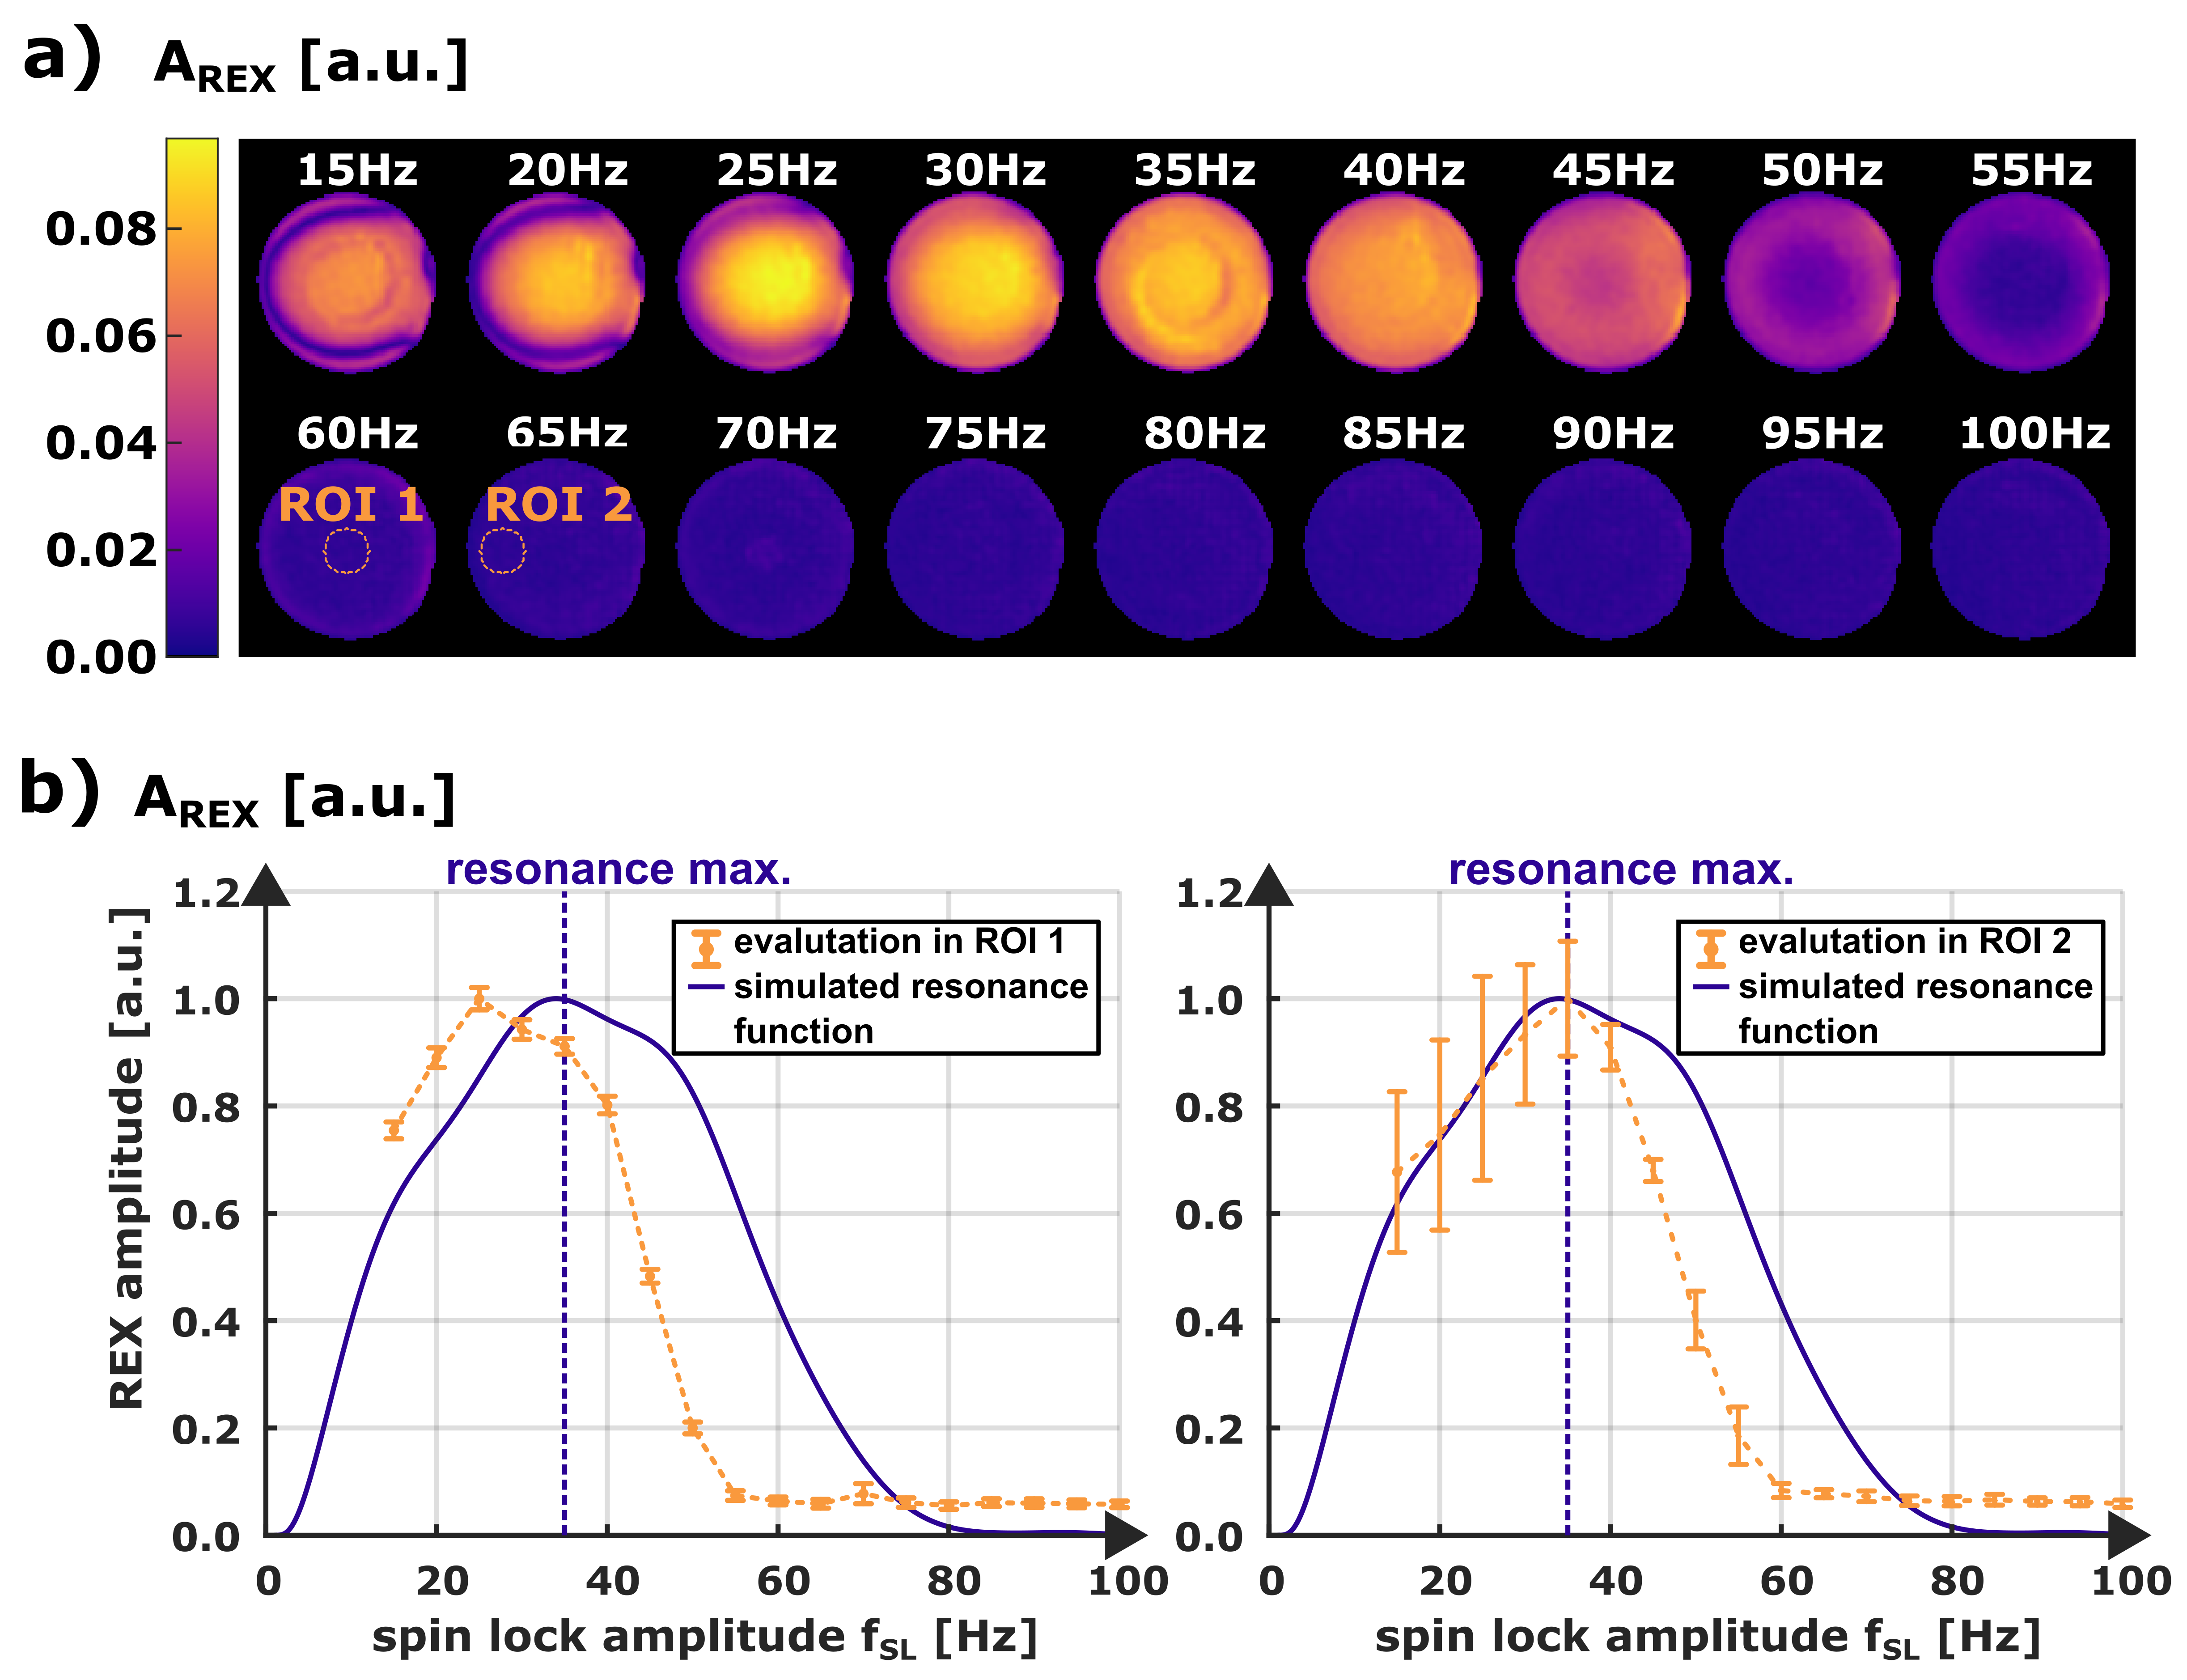
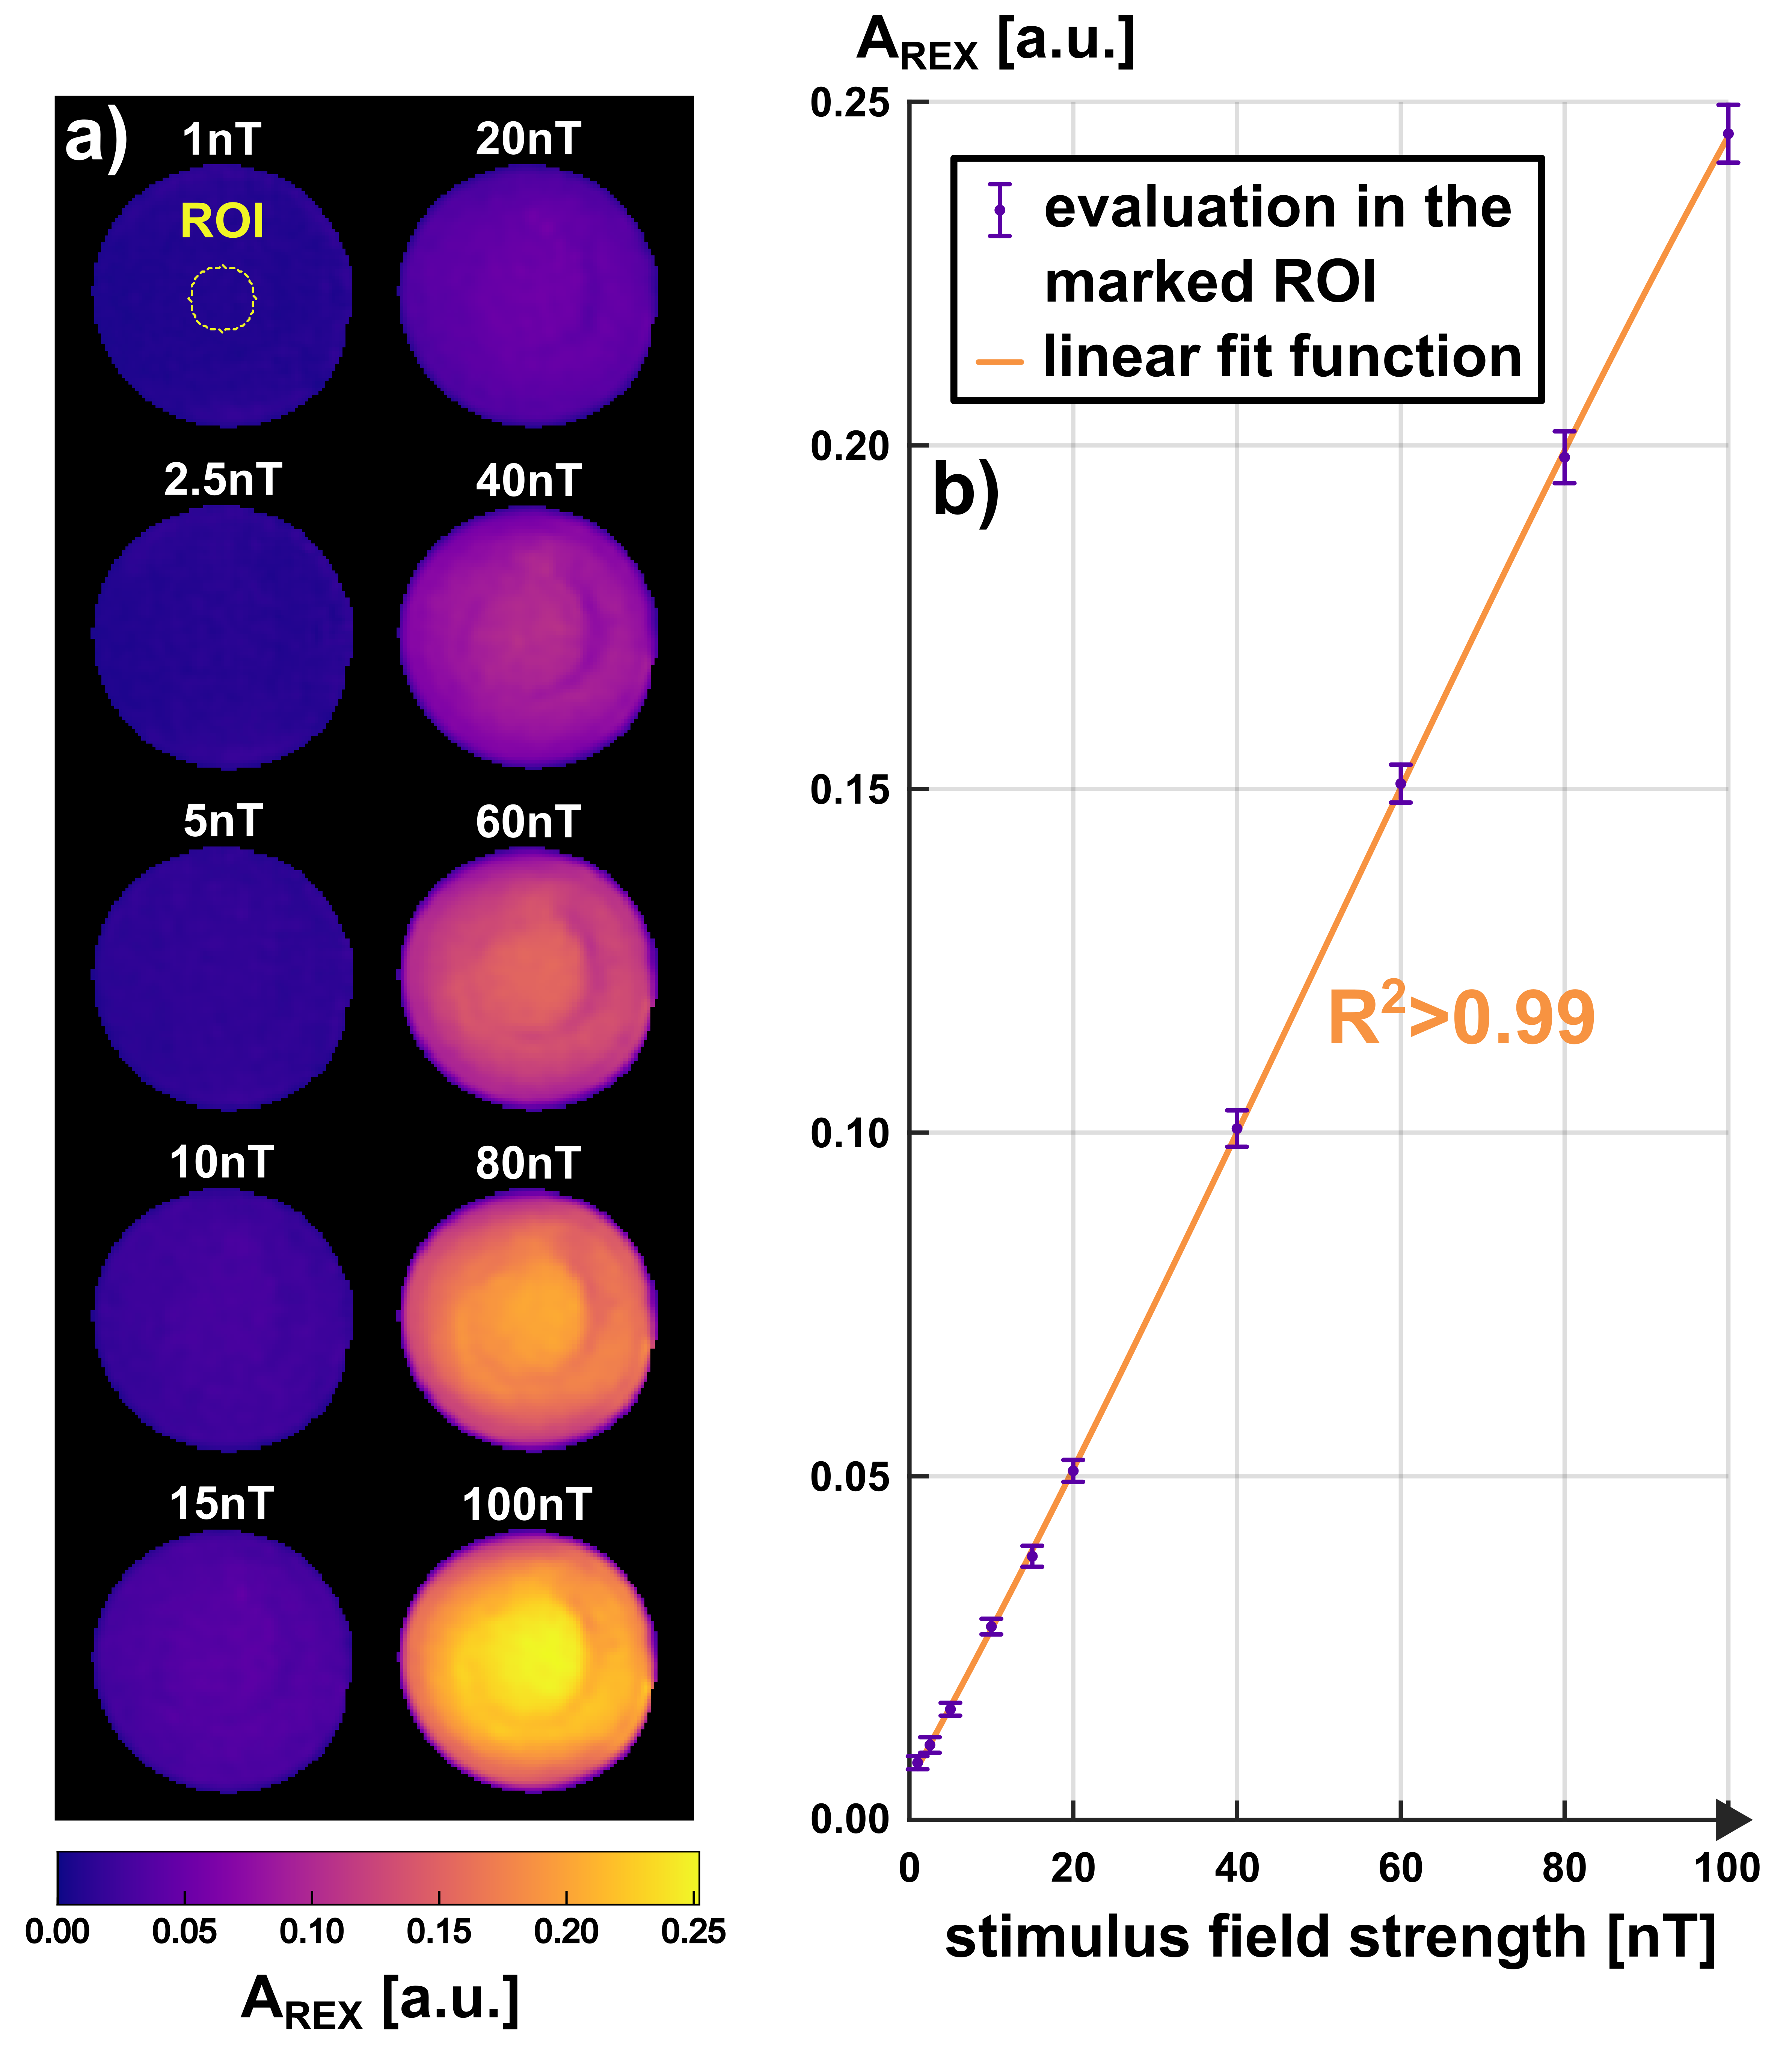
According to the simulation results in Fig. 1 and Fig. 2, REX detection can be generalized for magnetic fluctuations with broad frequency distributions. Due to the excitation by the magnetic variation, the spin-locked magnetization is tilted from the SL axis. This effect is strongest at fSL≈35Hz for the ±50Hz distribution, hence the simulation predicts a well-defined yet broad resonance case. This phenomenon can also be observed in the experimental results in Fig. 3. In the predicted resonant case (35Hz), a significant variation of the REX contrast can be detected, while in the off-resonant case (100Hz), approximately no variation of the REX signal is observed. The measurement of the resonance characteristic in Fig. 4 shows a high agreement with the simulation and is only slightly shifted, which is attributable to B0 and B1+ deviations [4]. If the peak amplitude is varied while maintaining the resonance condition, the detected REX amplitude increases linearly with the corresponding field strength (Fig. 5). The R2 within a circular ROI exceeds 0.99. The smallest field strength detected was 1nT.Discussion
Spatially resolved detection of magnetic peak-like variations with amplitudes in the nT-range by Rotary Excitation in the spin-lock state was demonstrated in a simulation and phantom study. As a common feature with the detection of oscillations, the signal variation is used for detection. A difference for peak detection is that the variation results from a temporal shift of the peak center with respect to the spin-lock pulse. In this work, a simple model of a magnetic variation that roughly mimics the shape of a cardiac QRS complex was studied. For this scenario, high agreement between the resonance characteristic with the results of the simulation and a linear correlation of detected AREX with the field strength could be proven. In future studies, the influence of the peak-like pulse shape, in particular its spectral bandwidth, on REX detection needs to be investigated. The next step for a meaningful application would be an accurate modeling of cardiac QRS fields, their simulation and subsequent experimental detection in the lower nT-range.Conclusion
We presented a new concept for the detection of biomagnetic fluctuations by means of SL-based MRI. The results of our study demonstrate the feasibility of the concept and establish SL-based methods as a promising approach for the development of new diagnostic tools in interventional MRI, e.g. for cardiology.Acknowledgements
This work was supported by the Federal Ministry for Education and Research of the Federal Republic of Germany (BMBF 01EO1504, MY.13).References
[1] Ogawa S, et al. Brain magnetic resonance imaging with contrast dependent on blood oxygenation. Proc Natl Acad Sci USA. 1990 Dec;87(24):9868-72. doi: 10.1073/pnas.87.24.9868.
[2] Witzel T, et al. Stimulus-induced Rotary Saturation (SIRS): a potential method for the detection of neuronal currents with MRI. Neuroimage. 2008 Oct 1;42(4):1357-65. doi: 10.1016/j.neuroimage.2008.05.010.
[3] Truong TK, et al. Toward direct MRI of neuro-electro-magnetic oscillations in the human brain. Magn Reson Med. 2019 Jun;81(6):3462-3475. doi: 10.1002/mrm.27654.
[4] Gram M, et al. Towards robust in vivo quantification of oscillating biomagnetic fields using Rotary Excitation based MRI. 2022. Sci Rep 12, 15375 doi: 10.1038/s41598-022-19275-5.
[5] Layton KJ, et al. Pulseq: A rapid and hardware-independent pulse sequence prototyping framework. Magn Reson Med. 2017 Apr;77(4):1544-1552. doi: 10.1002/mrm.26235.
Figures