4391
Initial experiences assessing the impact of different materials for needle-based interventional devices using advanced DWI and MR thermometry
James H Holmes1,2,3, Collin J Buelo4,5, Ruiqi Geng4,5, Matthew R Tarasek6, Desmond TB Yeo6, Christopher L Brace5,7, Diego Hernando5,7,8, Aaron Faacks5, Jia Xu1, Francisco Donato Jr.1, and Shane A Wells5,9
1Radiology, University of Iowa, Iowa City, IA, United States, 2Biomedical Engineering, University of Iowa, Iowa City, IA, United States, 3Holden Cancer Center, University of Iowa, Iowa City, IA, United States, 4Medical Physics, University of Wisconsin-Madison, Madison, WI, United States, 5Radiology, University of Wisconsin-Madison, Madison, WI, United States, 6GE Research, Niskayuna, NY, United States, 7Biomedical Engineering, University of Wisconsin-Madison, Madison, WI, United States, 8Electrical and Computer Engineering, University of Wisconsin-Madison, Madison, WI, United States, 9Urology, University of Wisconsin-Madison, Madison, WI, United States
1Radiology, University of Iowa, Iowa City, IA, United States, 2Biomedical Engineering, University of Iowa, Iowa City, IA, United States, 3Holden Cancer Center, University of Iowa, Iowa City, IA, United States, 4Medical Physics, University of Wisconsin-Madison, Madison, WI, United States, 5Radiology, University of Wisconsin-Madison, Madison, WI, United States, 6GE Research, Niskayuna, NY, United States, 7Biomedical Engineering, University of Wisconsin-Madison, Madison, WI, United States, 8Electrical and Computer Engineering, University of Wisconsin-Madison, Madison, WI, United States, 9Urology, University of Wisconsin-Madison, Madison, WI, United States
Synopsis
Keywords: Interventional Devices, MR-Guided Interventions
In this work we report initial results evaluating the imaging artifacts associated with different candidate materials for use in needle-based interventions. The impact of each material was assessed using MRT and DWI ADC as well as compared with local Bo field maps.Purpose
MR provides a variety of soft tissue contrast mechanisms allowing the ability to monitor temperature and tissue changes in real-time during ablation procedures that could provide immediate feedback for clinicians to assess ablation margins, making it a promising modality for guided interventions. Advanced quantitative methods such as MR thermometry (MRT) and diffusion weighted imaging (DWI) provide invaluable intra- and post-procedure soft tissue information including assessment of changes associated with ablation margins directly following procedures (1-3). However, percutaneous interventional devices including ablation applicators and biopsy needles present significant challenges in the MRI environment including magnetic susceptibility related artifacts that may limit the utility of these imaging methods within proximity to the interventional device. Conventional devices are typically made of stainless steel (SS), which has a high magnetic susceptibility that distorts the static magnetic field and introduces image artifacts. Degradation of accuracies in apparent diffusion coefficient (ADC) estimates from advanced motion robust DWI methods with multi-shot reconstruction, as well as in MRT proximal to high susceptibility devices are also typically observed. In this work, we present first results evaluating the performance of DWI and MRT adjacent to four different coaxial device materials.Methods
Six separate 10 cm cubic molds were constructed using 1L of degassed 1.4% agar/0.025% gadobenate dimeglumine solution that was solidified around five different coaxial needle-like devices secured at a 60o angle and a control (no device). Device gauge (ga) and materials were: 15-ga SS (reference standard), 10-gauge copper (Cu10), 13-ga copper (Cu13), 14-ga alumina and 14-ga zirconia (Fig. 1). MRI was performed at 3T (Premier, GE Healthcare, Waukesha, WI) (Fig. 2). Static magnetic field B0 maps were acquired using a 3D MAVRIC-SL acquisition (acquired resolution = 0.9x0.9x5mm) [4]. DWI was performed using 2D multi-shot EPI with MODI diffusion gradients [5] (b=50 and 500s/mm2 acquired resolution = 2.5x2.5x5mm, BW=+/-250kHz, TR/TE = 4s/65.9ms). 2D SPGR proton resonance frequency shift (PRFS)-based MRT was acquired with each phantom placed between bottles of vegetable oil (acquired resolution = 2x2x2mm, BW=+/-62.5kHz, TR/TE = 2.1/120ms, flip angle = 10o). Profiles of the B0 field, ADC and MRT were measured to intersect with the needle-like devices, along the physical x-direction and perpendicular to the main magnetic field.Results
The largest deviations in the B0 field maps were due to the SS device at -3.28kHz (Fig. 3). The Cu10, Cu13, alumina, and zirconia devices cause much less off-resonance (455Hz, 135Hz, -120Hz and 43Hz respectively). The MRT-derived temperature changes in the absence of applied heat show a localized region of temperature artifact adjacent to the SS device measuring 2.1cm in diameter while no artifacts were visible around Cu13, alumina, or zirconia devices (Fig. 4). Vegetable oil does not display a PRFS shift and thus serves as a null temperature change reference (not shown). Profiles of the ADC maps measured across the phantoms show localized bias near the SS device (Fig. 5) that is reduced for the other devices with a peak measured deviation in ADC*10-6 mm2/s of 3,236 for SS, 409 for Cu10, 109 for Cu13, and 344 for alumina with no deviation observed for zirconia. It should be noted that the DWI artifact pattern is not angularly symmetric.Conclusions
The ability to use MRI to monitor local changes adjacent to microwave applicators in real-time could improve percutaneous ablation. However, percutaneous interventional devices manufactured with SS, such as ablation applicators and biopsy needles, can produce significant B0 field inhomogeneity at 3T, which result in severe imaging artifacts. Alternative materials including copper, zirconia, and alumina induce much smaller local perturbations to the B0 field, which result in reduced imaging artifacts in ADC and MRT maps. Future work will include further MR sequence optimization to minimize sensitivity to local distortions to the static magnetic field.Acknowledgements
NIH-NCI: 1R01CA266879. The University of Wisconsin-Madison receives research support from GE Healthcare.References
[1] Okuma et al. Br. J. Radiol. 2009;82:989–994. [2] Giles et al. European Radiology Experimental (2018) 2:10 [3] Vogl et al. Eur Radiol. 2022; 32:3288–3296. [4] Koch et al. MRM. 2011;65:71-82. [5] Zhang et al. MRM. 2019;82:302-311.Figures
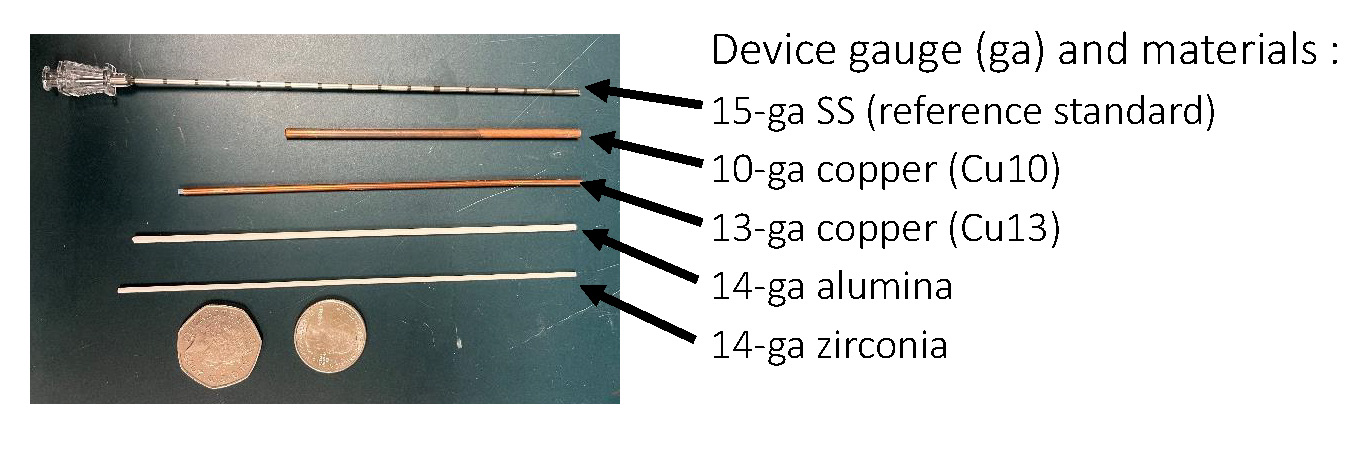
Fig. 1. Photo of needle-like devices with
US quarter and British 50 pence coins for reference.

Fig. 2. Configuration of phantoms and RF
coil on scanner table before being moved into the scanner for imaging a). Phantom
placed between bottles of oil during MRT.
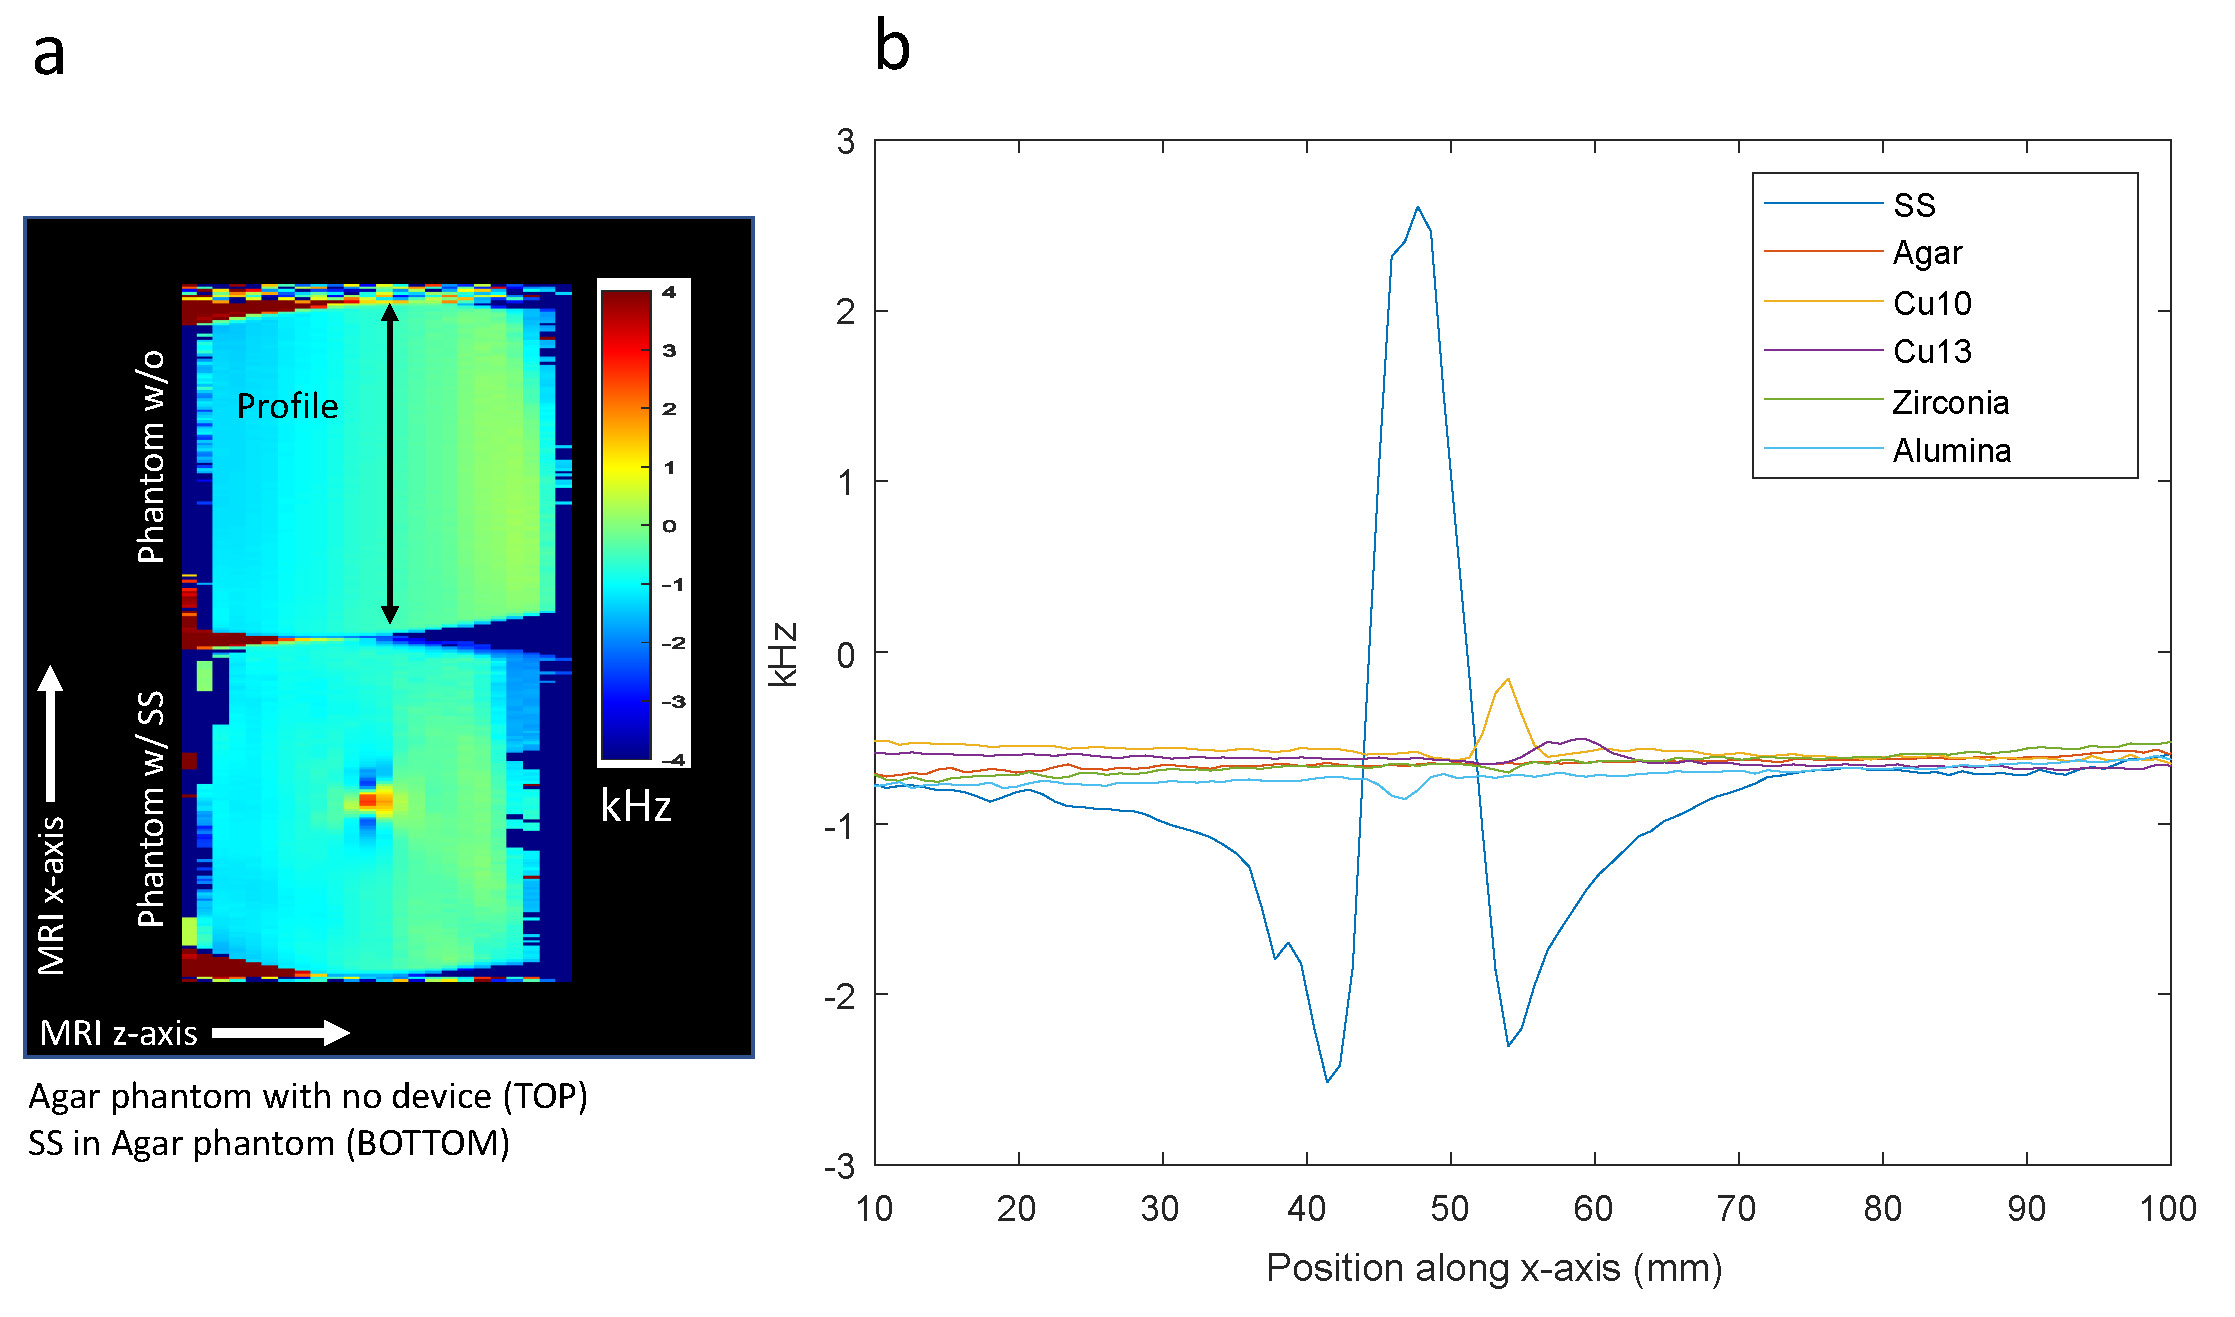
Fig. 3. Example coronal field maps of the
control (no device) and the SS device (a). Profiles of the field maps across
each device (b) show substantial perturbation due to SS (blue line) compared to
lower field changes near the other devices and control.
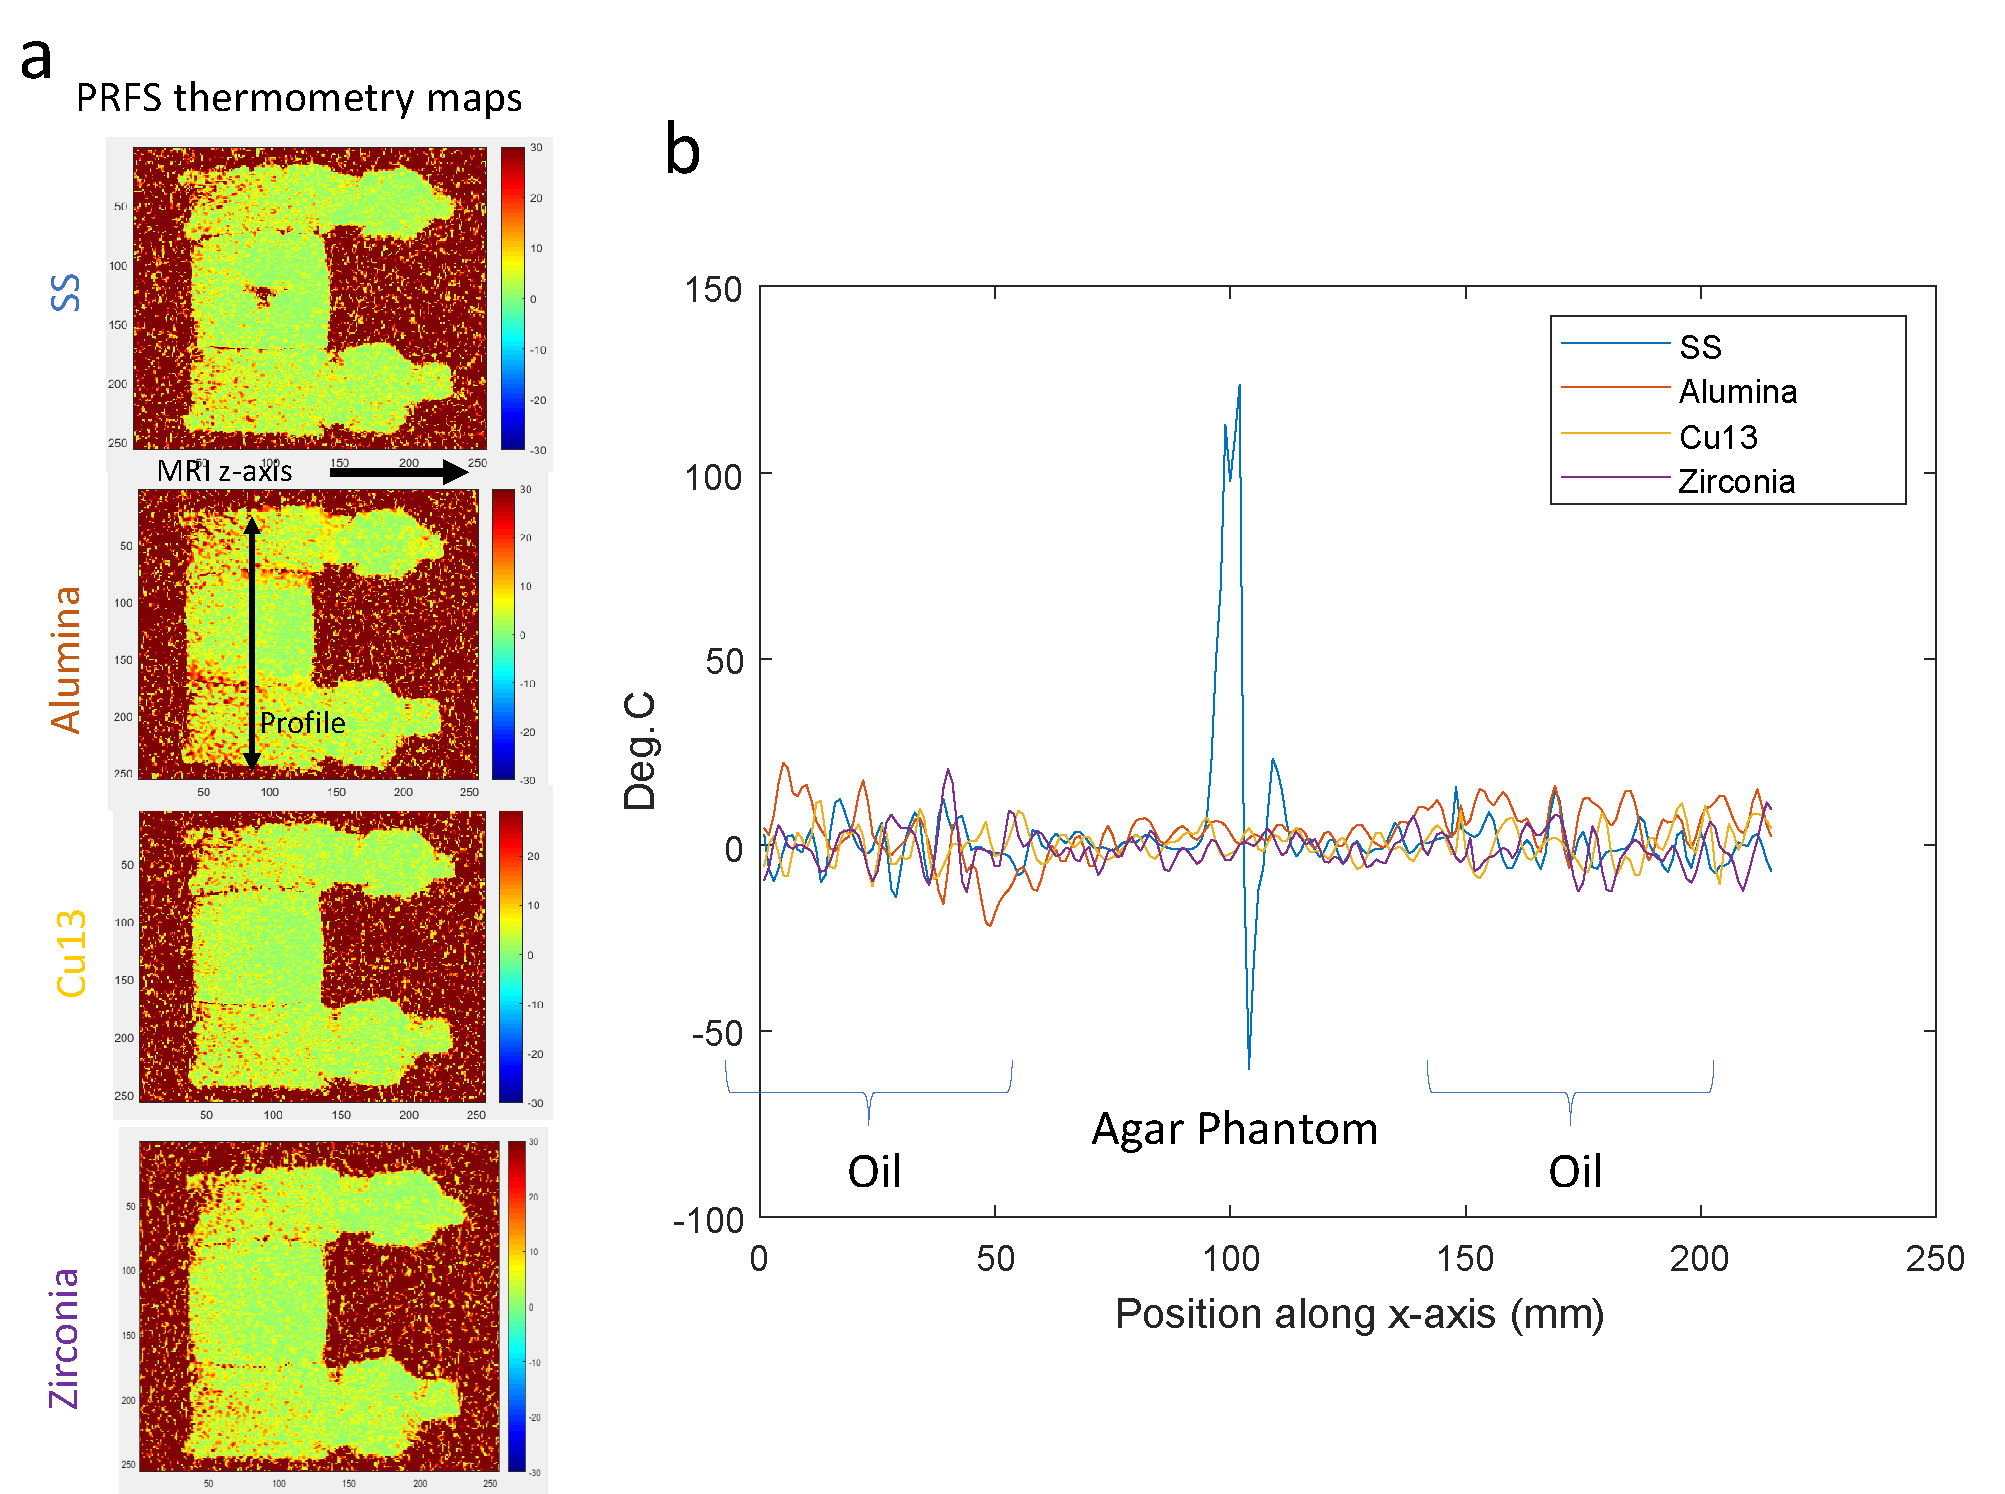
Fig. 4. Coronal images from PRFS MRT
calculated from adjacent time-points with no heating (a). Corresponding
profiles from MRT demonstrate an artifact of approximately 2.1cm around the SS
device (blue line) but no visible artifacts near the other devices.
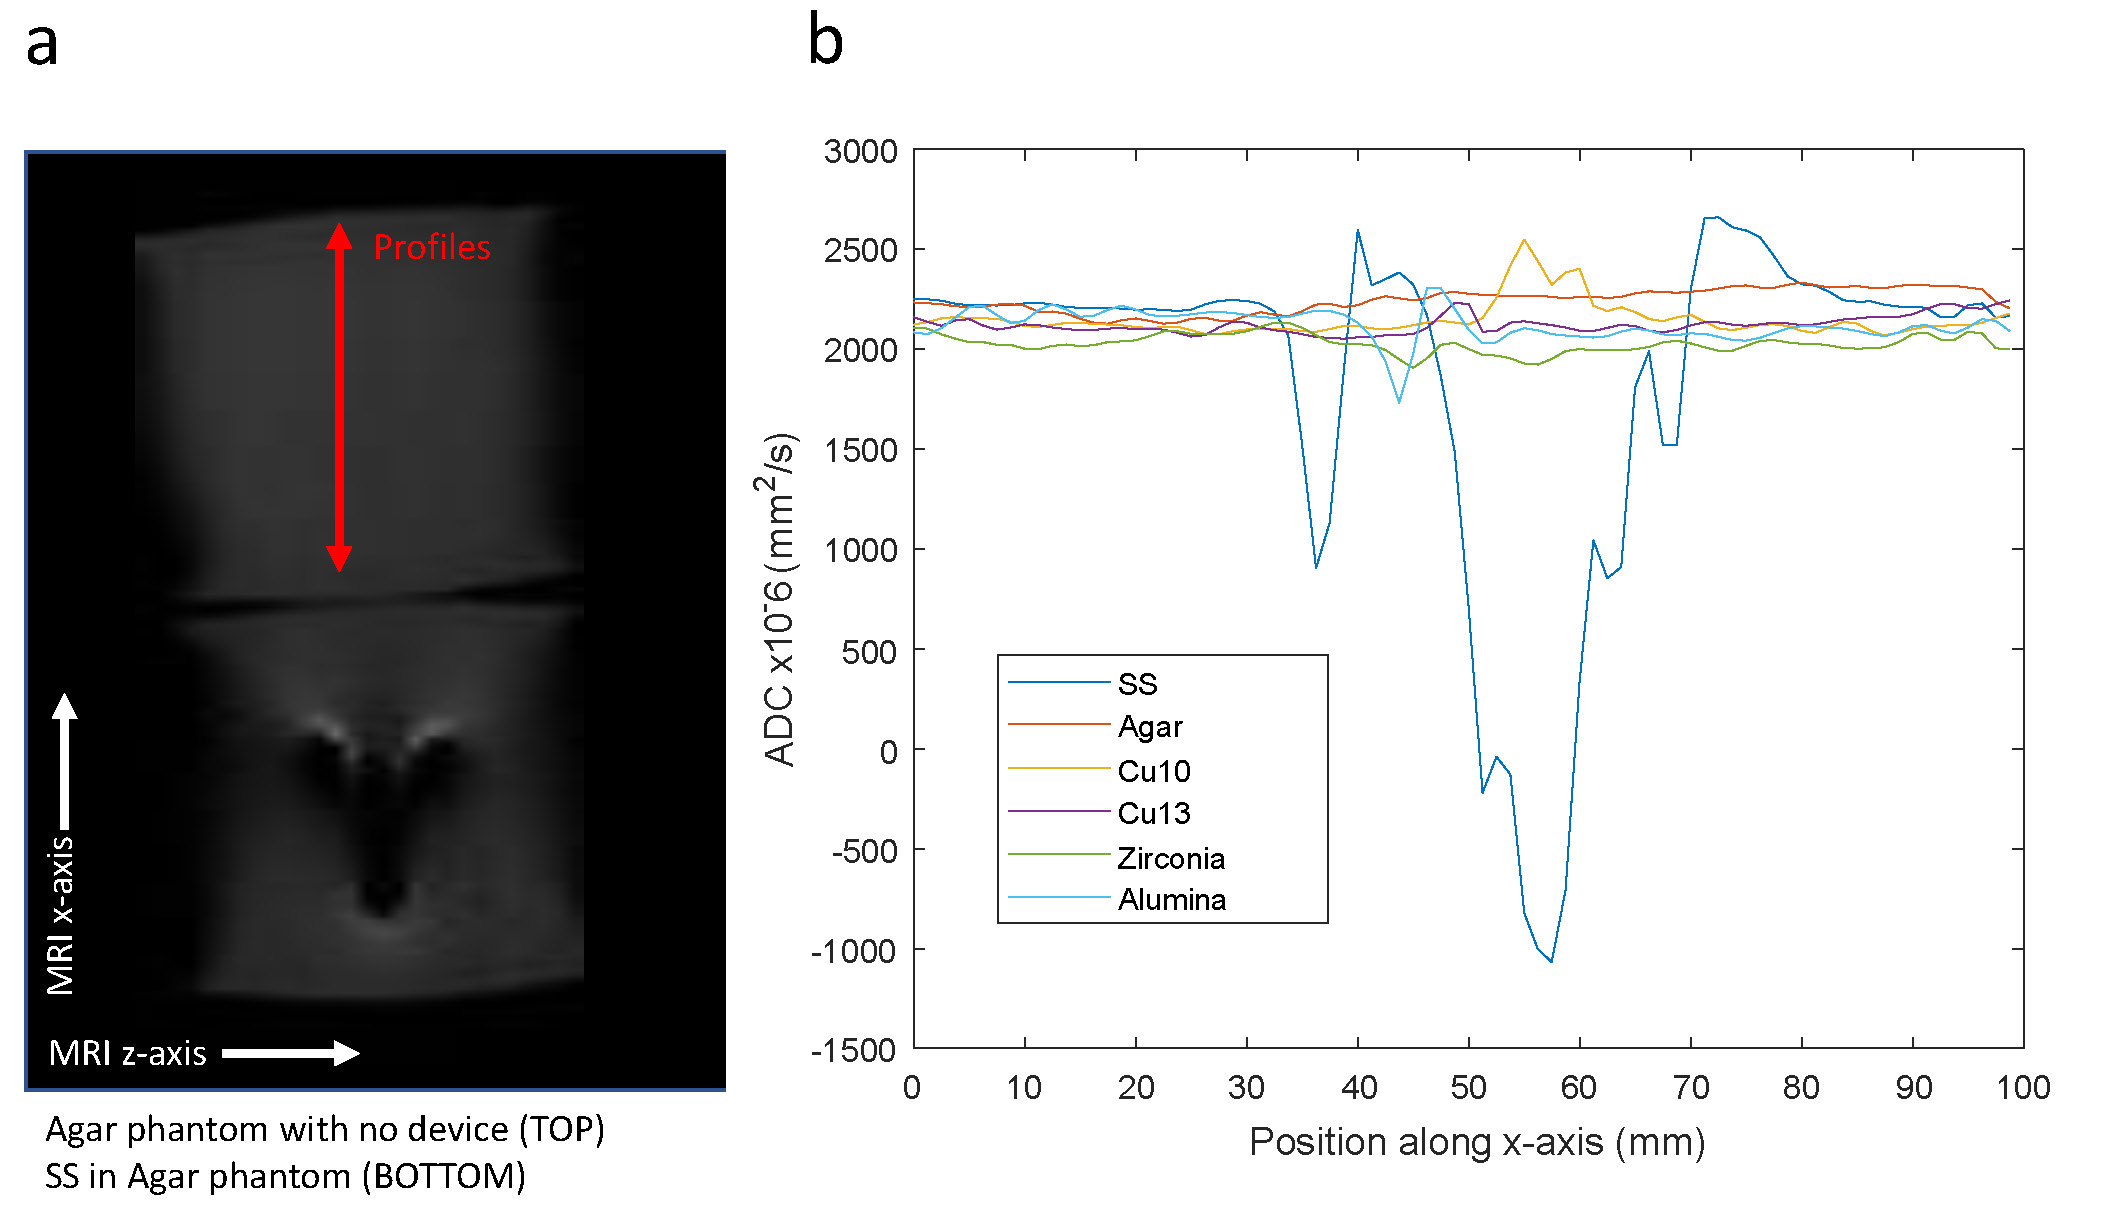
Fig. 5. Example coronal DWI b=50s/mm2 images
showing substantial distortion and signal loss near the SS device (a). Profiles
of the ADC in the x-direction show corresponding large regions of artifact
around the SS device (5cm, blue line) compared to much smaller deviations
observed for the other materials (b).
DOI: https://doi.org/10.58530/2023/4391