4384
Passive Device Tracking for interventional MRI with Ferric Ion Chelated Natural Melanin Nanoparticles1Department of Electrical Engineering and Computer Sciences, UC Berkeley, BERKELEY, CA, United States, 2Department of Biomedical Engineering, İzmir Demokrasi University, İzmir, Turkey, 3Department of Electrical and Electronics Engineering, Boğaziçi University, İstanbul, Turkey, 4Department of Electrical Engineering and Computer Sciences, UC Berkeley, Berkeley, CA, United States
Synopsis
Keywords: Interventional Devices, MR-Guided Interventions, Passive Tracking, Melanin Nanoparticles, MRI devices, interventional MRI
Natural melanin nanoparticles (MNPs) labeled with paramagnetic ions provide a potential MRI contrast enhancing material alternative to current MRI contrast agents due to their biocompatibility, biodegradability, metal, and biomolecule chelation properties. In this study, we investigated T1 shortening effect of Fe3+ chelated MNPs solution compared to gadolinium-based contrast agents under 3T MRI. Then, we examined traceability of MNP-Fe3+ ions deposited interventional nitinol guidewire in MR scans. Results clearly showed that the coating of Fe3+ chelated MNPs over the surface of MRI compatible instruments will increase traceability of interventional devices in MRI.INTRODUCTION
Interventional procedures with MRI guidance are still limited due to lack of MRI-safe and trackable interventional instruments. To overcome these challenges, investigators have introduced both passive and active methods. With active methods, resonant frequency (RF) markers mounted over MRI-safe materials are directly connected to MRI scanner to provide satisfactory SNR and visibility. However, bulky components of RF markers and potential RF-induced current over long transmission lines are the main drawbacks1-4. Alternatively, passive designs incorporate diamagnetic, paramagnetic/ferromagnetic material-based markers over tip or overall shaft of instruments without any connection to the MRI scanner inherently eliminating RF safety concerns5-8. But passive designs suffer from insufficient SNR and durability. Efforts for developing thin film-based RF markers that inductively couple to the transmitted RF, were promising for increasing the SNR while keeping a low profile and canceling the RF induced heating risk9-11. However, the orientation dependency of these RF markers to main magnetic field and high production cost of thin film layers limits their clinical use. In last decade melanin nanoparticles are gaining attraction as a contrast agent in MRI due to their biocompatibility, low cytotoxicity, strong metal ion chelating and paramagnetic properties12-15. Melanin, a polymer pigment abundant in many living organisms, contains catechol groups that increase binding capacity with metal ions, and leading to a significant shortening of the T1 relaxation effect in MRI12-18. In this study first, T1 values of ferric ions (Fe3+) chelated natural melanin nanoparticles (MNPs) and gadolinium-based agents were measured and compared in solutions. Then, MNP-Fe3+ ions solution was coated over the surface of MRI-safe nitinol guidewire samples and their visibility at a 3T MRI scanner was investigated.METHODS
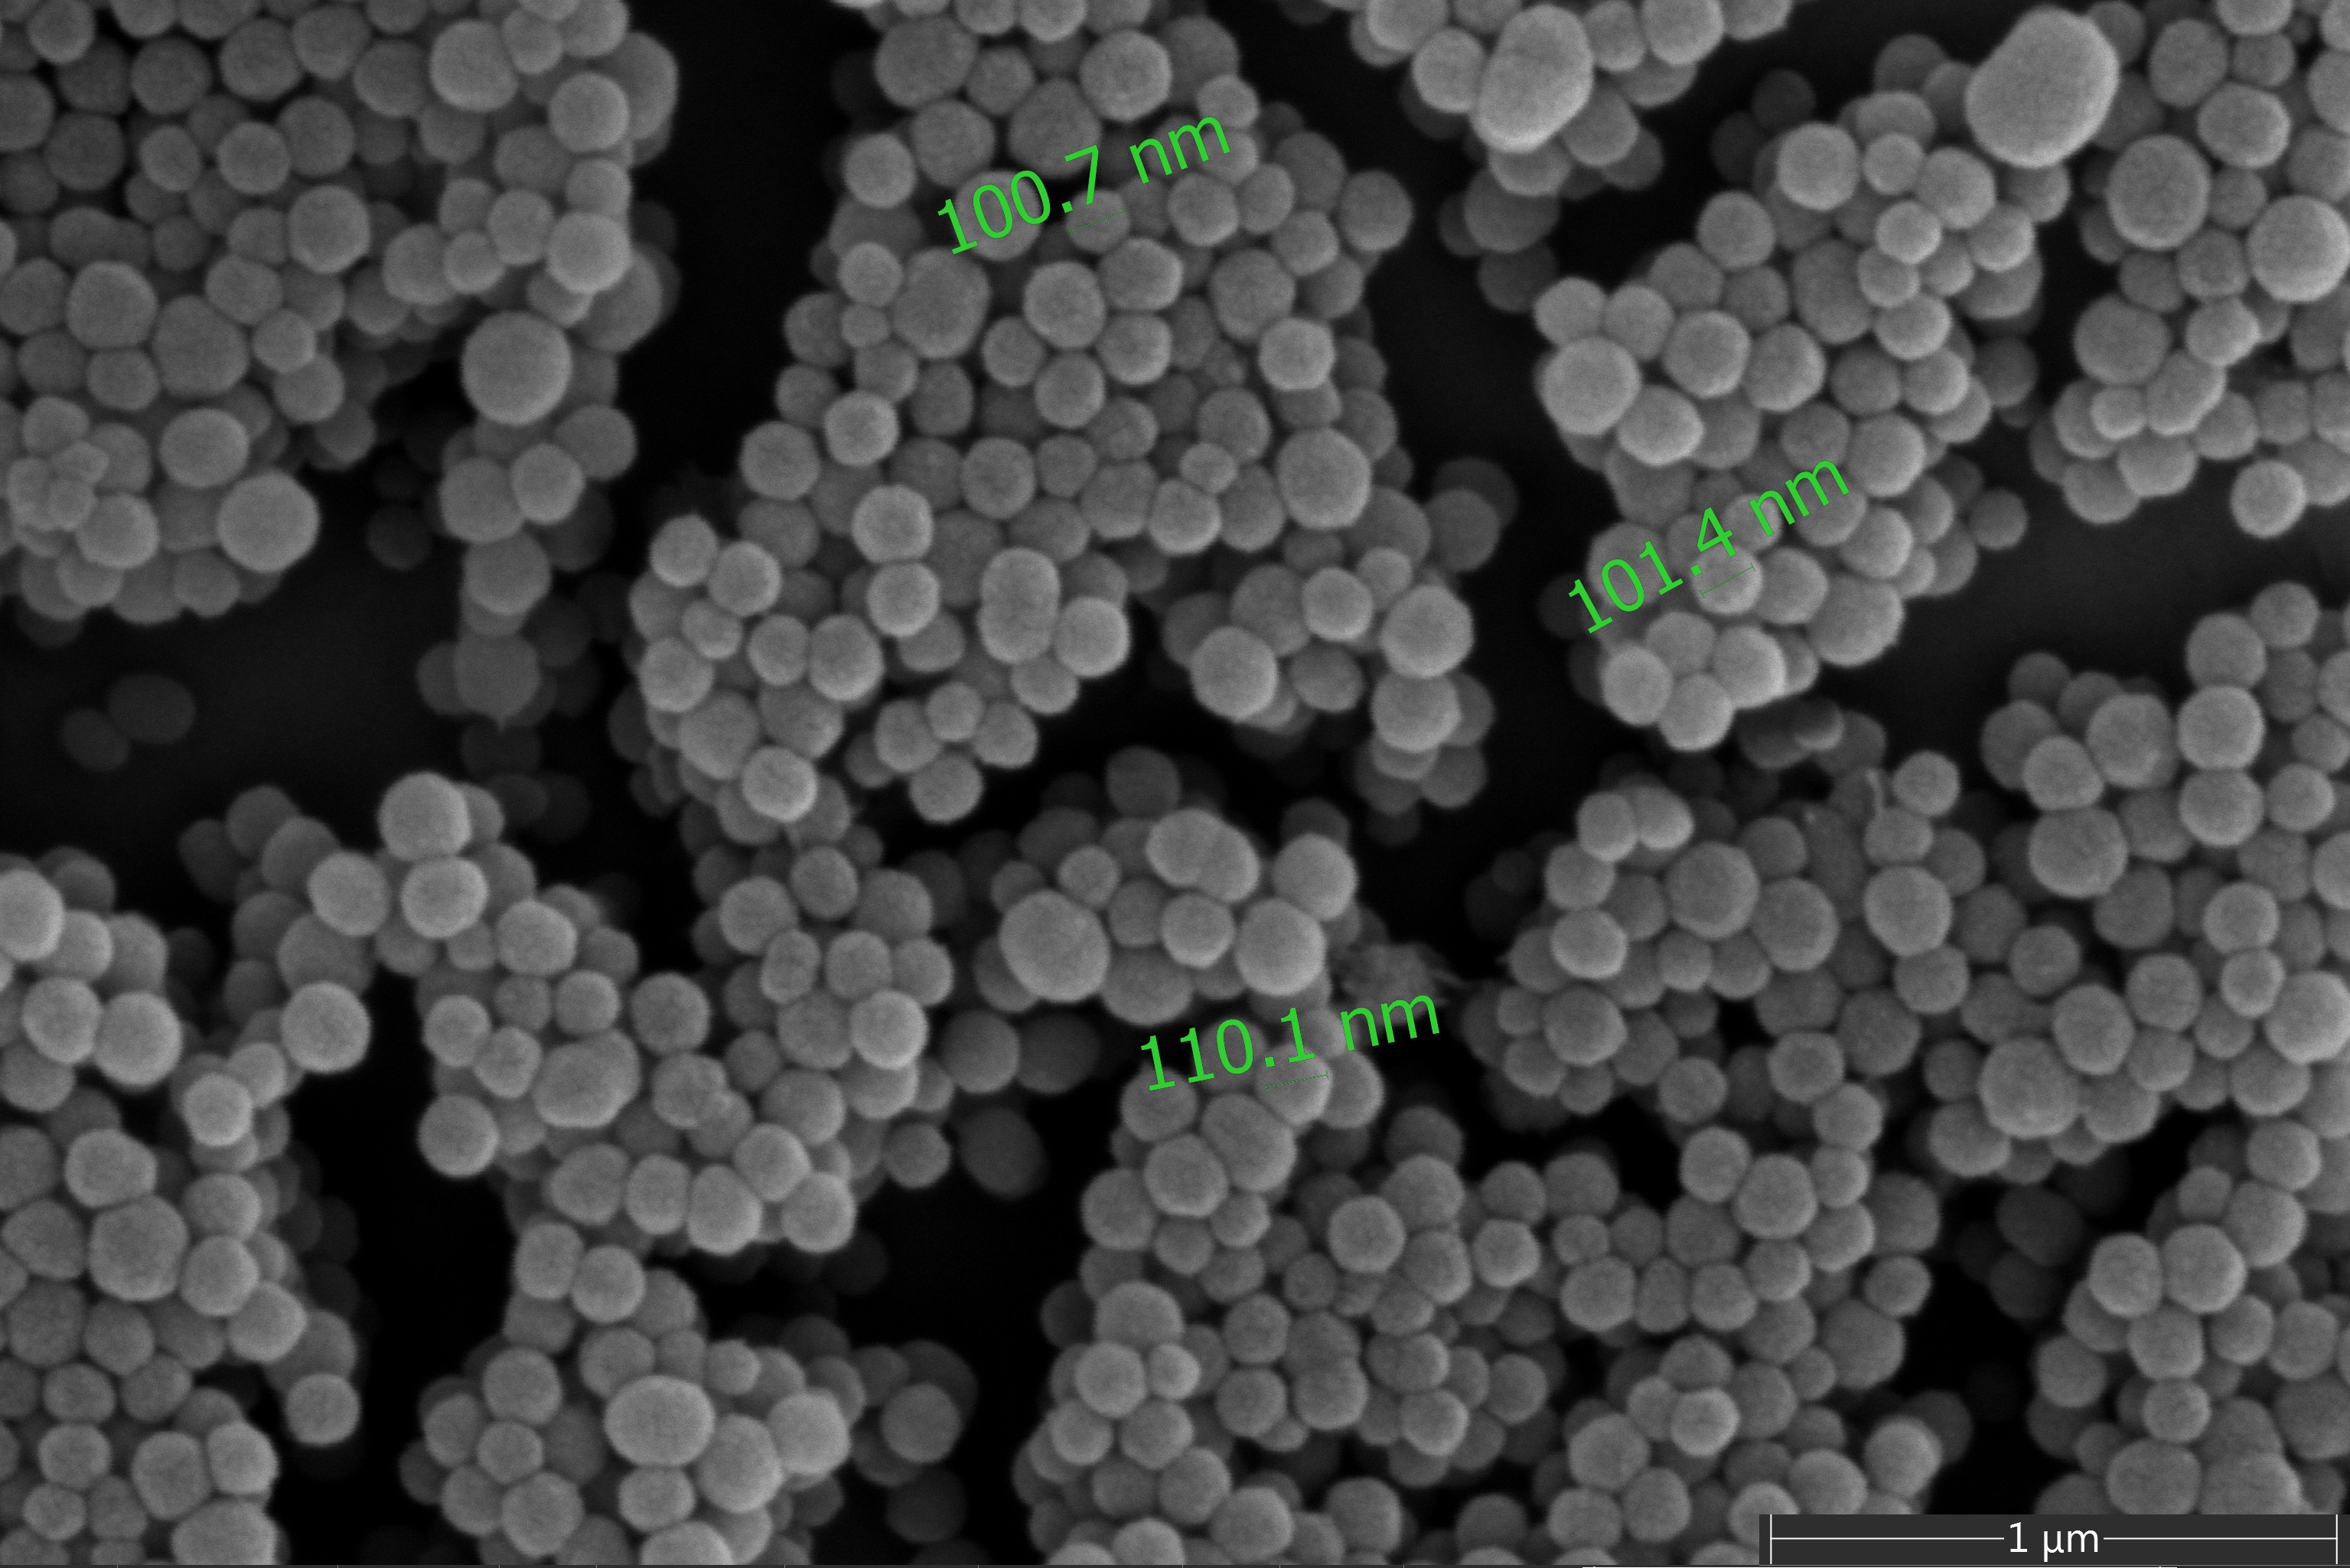
Preparation and Characterization of Fe3+ chelated MNPs and Gadolinium-Based SolutionsNatural MNPs were extracted from commercially available ink sacs of the cuttlefish (Sepia officinalis) using a method described by Jakubiak et al.19 and scanning electron microscope (SEM) images were obtained to determine the size of nanoparticles. For signal enhancement, extracted MNPs were labeled with Fe3+ ions using a modified method described by Ju et al12. The Fe3+ chelating ability of MNPs was measured by inductively coupled plasma mass spectroscopy (Perkin-Elmer Optima-5300-DV). MNP-Fe3+ were added into deionized water and dissolved using bath-type sonicator before each coating process and T1 relaxivity measurements. Gadolinium-based contrast solutions were prepared with the same concentration values as MNP-Fe3+ ions solutions using commercially available gadobutrol monohydrate from Sigma-Aldrich.
T1 Relaxivity Measurement of Fe3+ chelated MNPs and Gadolinium Contrast Solutions
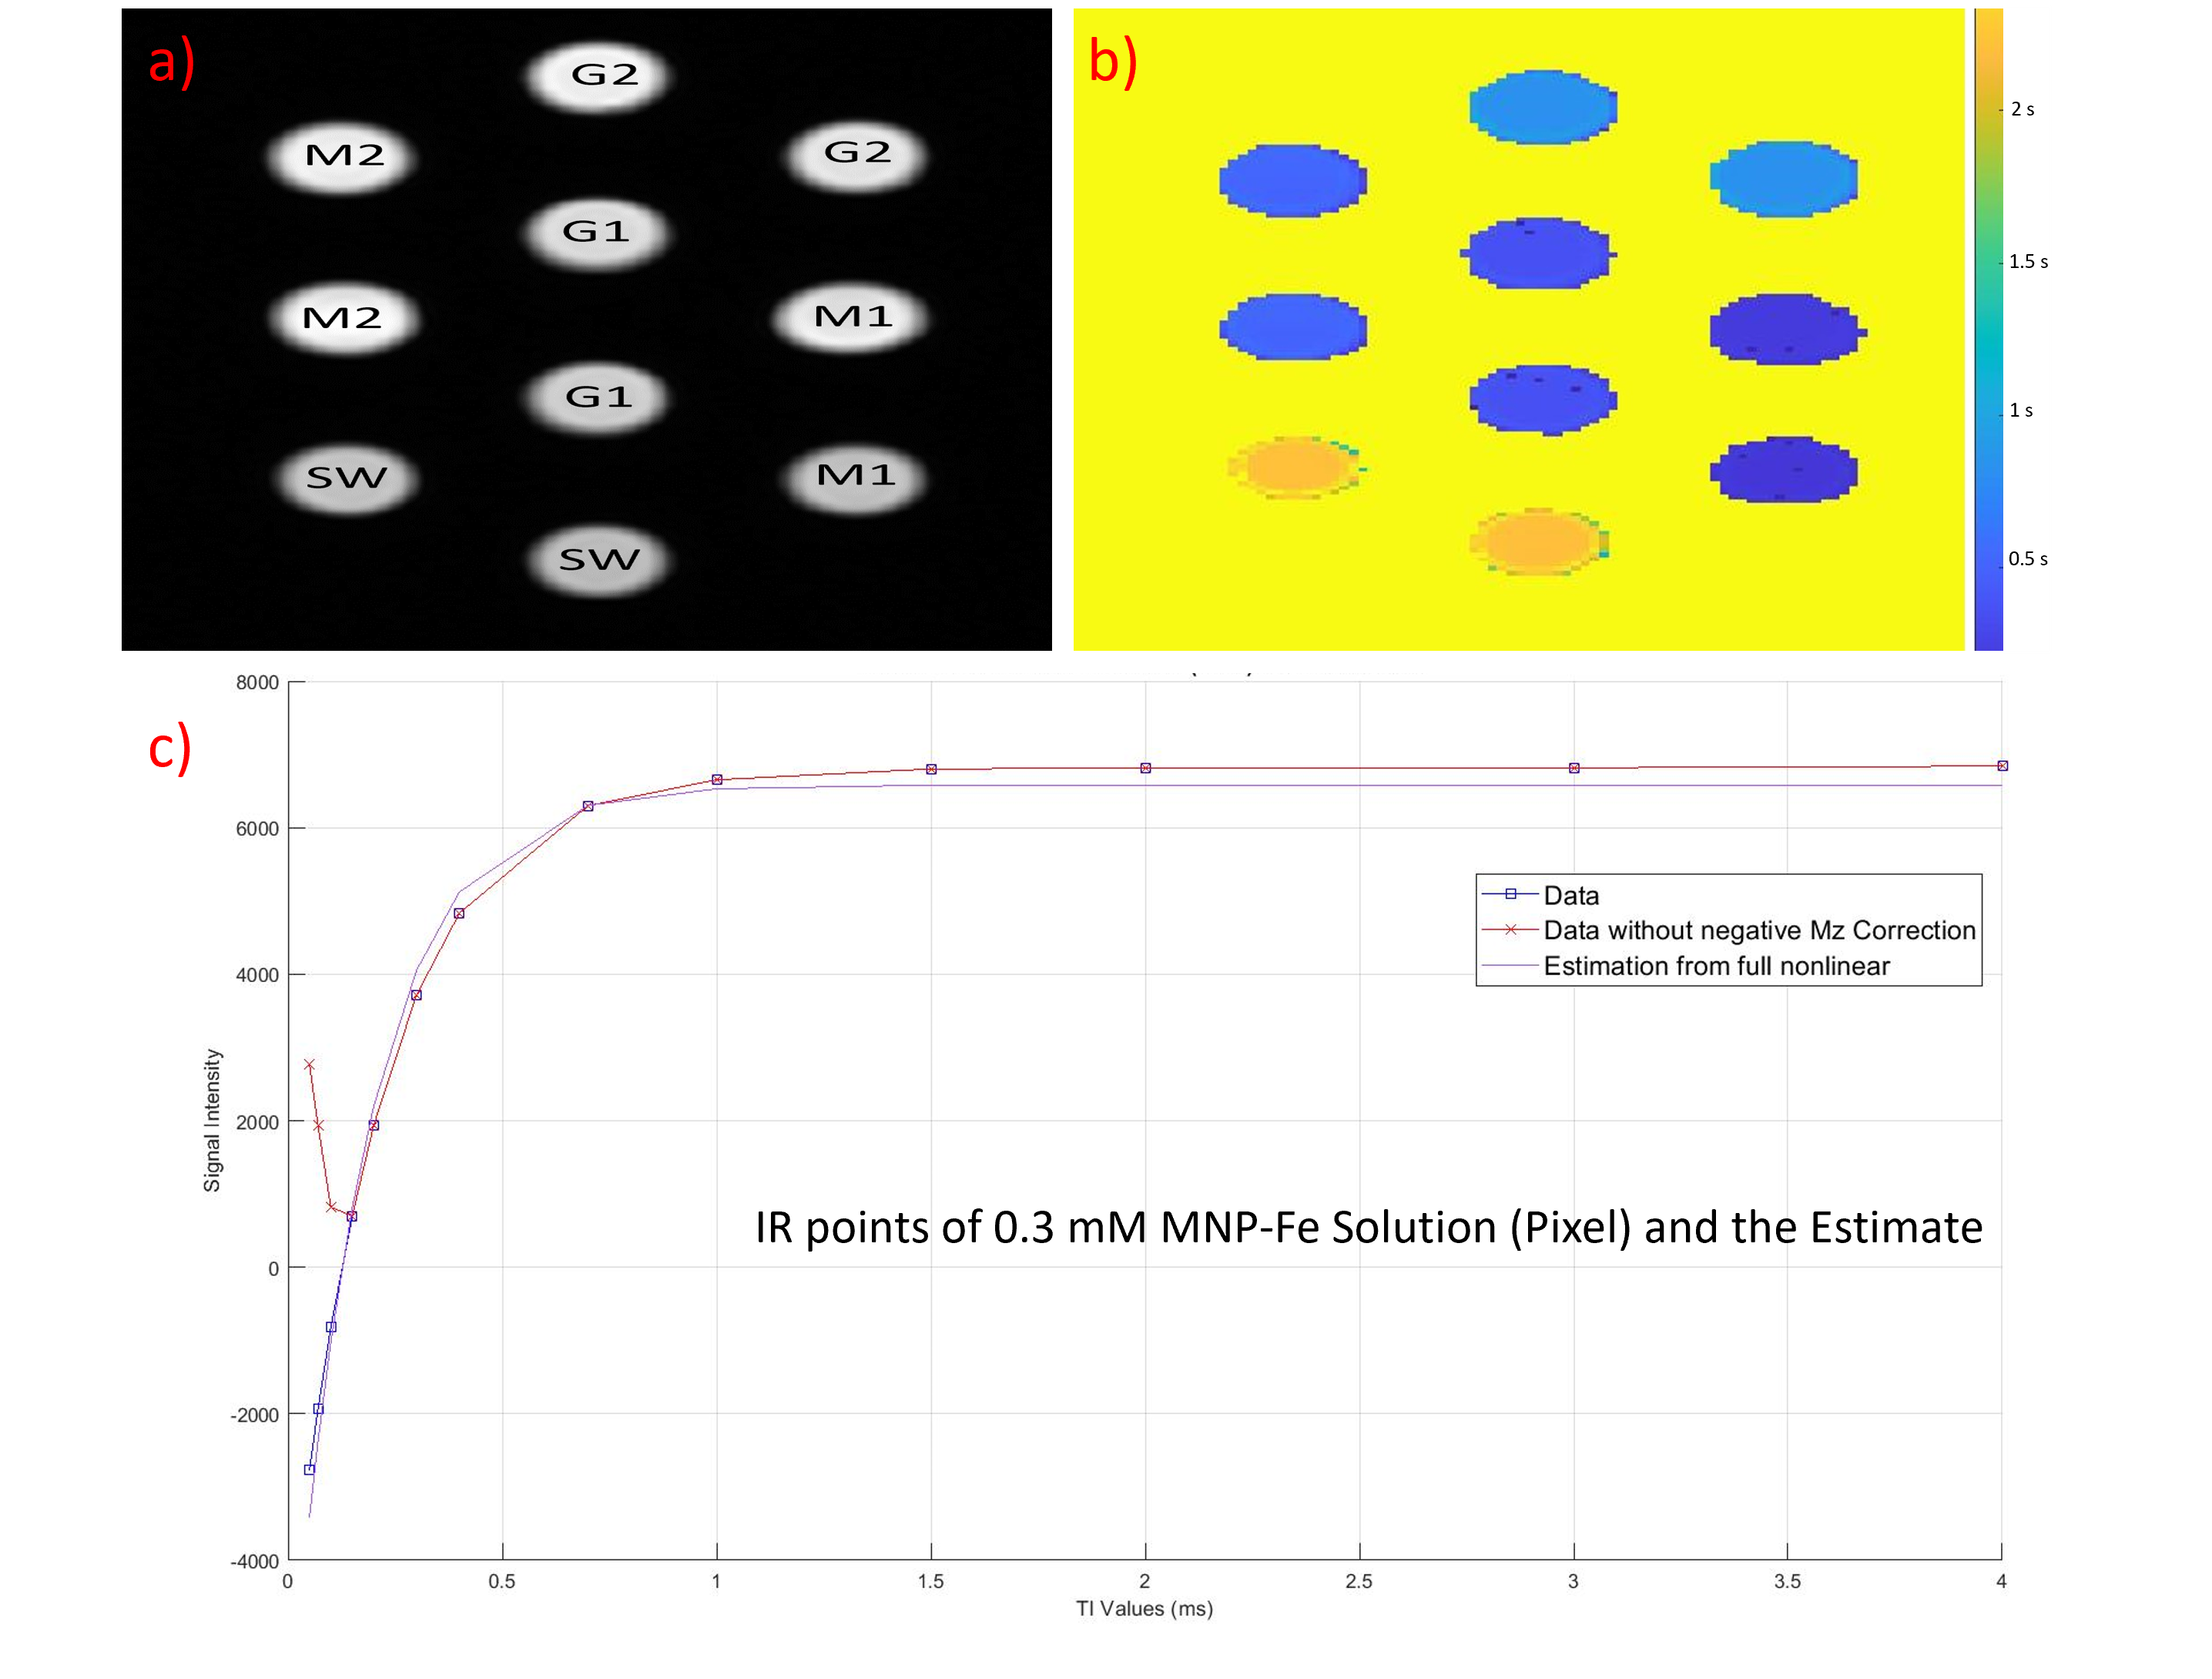
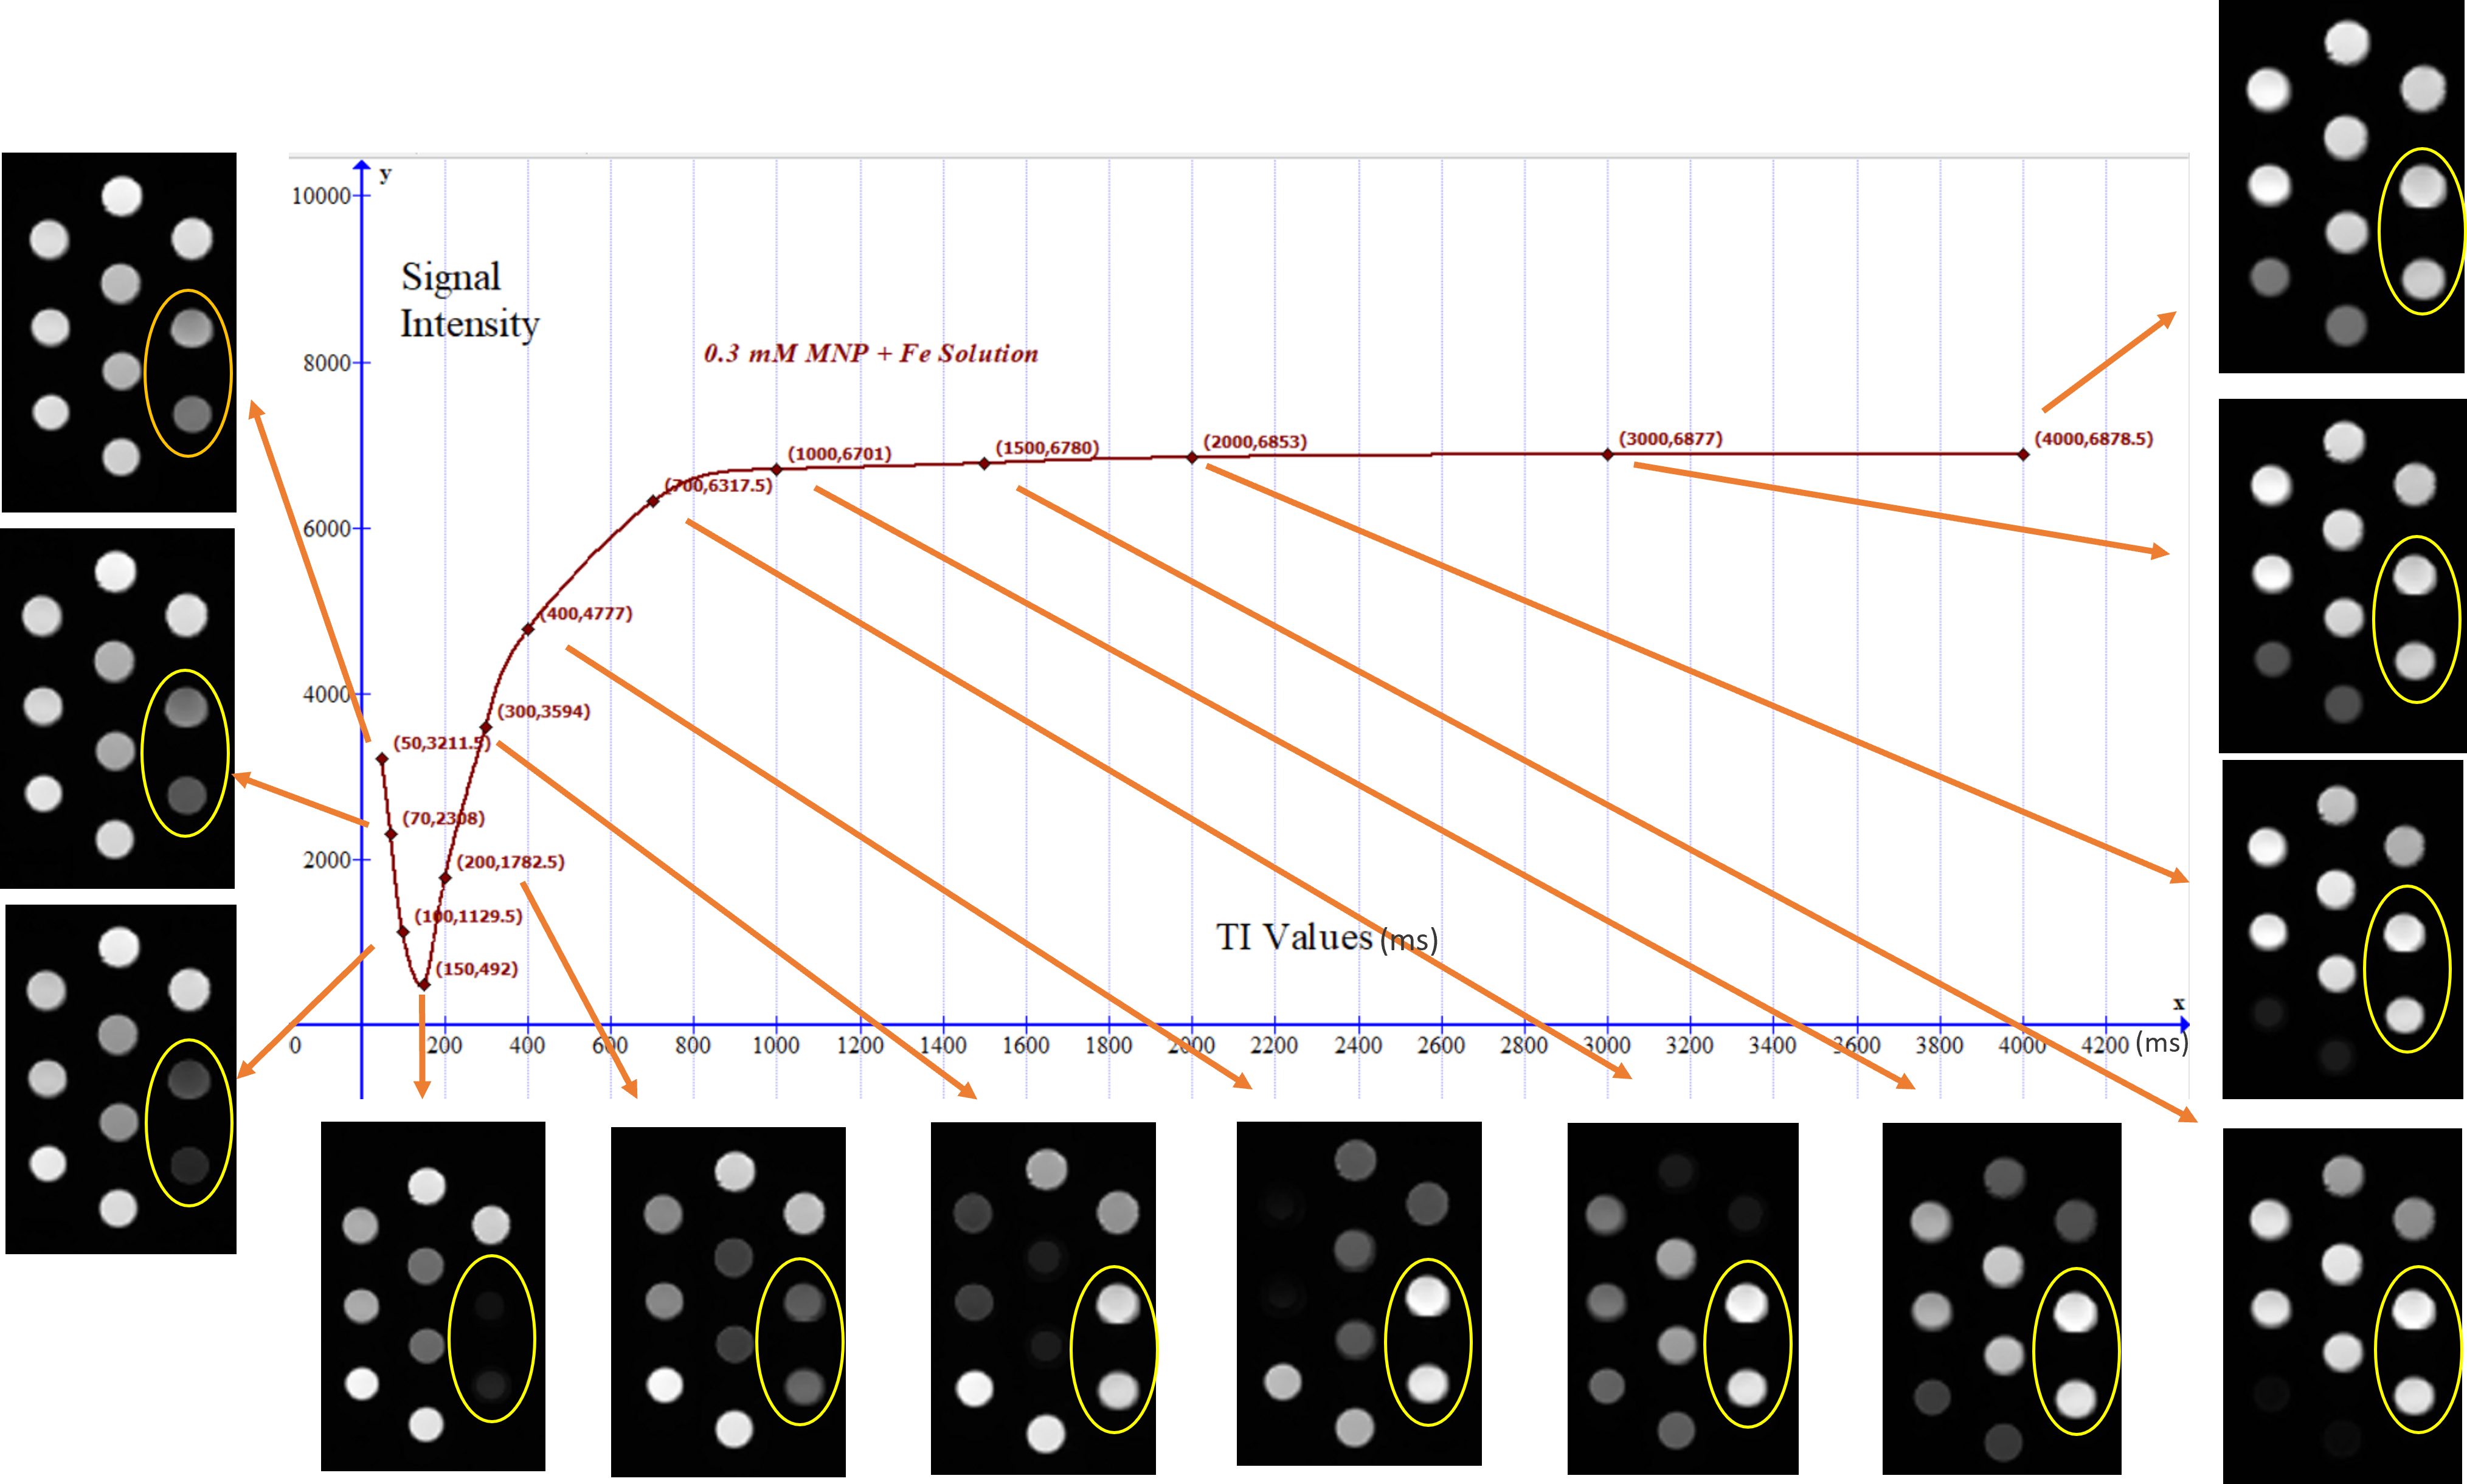
To quantify T1 values of all solutions, a Look-Locker20 method-based slice-selective inversion recovery spin echo (IR-SE) sequence was performed with a repetition time (TR) of 10 seconds, echo time (TE) of 14 ms, and a range of inversion times (TI) including 50, 70, 100, 150, 200, 300, 400, 700, 1000, 1500, 2000, 3000, and 4000 ms. Images were acquired using a 3T GE MR750W system (Waukesha-Wisconsin) using a commercial 24-channel head/neck coil with a 7 mm slice thickness, in-plane matrix size of 256×256 and FOV of 205x205 mm2. Signal intensities of each solution for the corresponding region of interest in images were fitted with a function21 shown below to quantify the T1 parameter of solutions using the lsqcurvefit routine in MATLAB® with Levenberg-Marquard algorithm:
Mz(TI)=M0(1-2e(-TI/T1))
Surface Coating of Nitinol Guidewire Samples
A commercially available nitinol guidewire (Bard-NiCORE) with diameter of 0.35” was cut into small pieces with length of 5 cm and cleaned in acetone, ethanol, and deionized water. Samples were first immersed into the prepared MNP-Fe3+ solutions (in DIW), then the solution placed into a shaking water bath at a temperature of 80 ± 1°C for 12 hours with a constant of 120 rpm. Coated nitinol samples rinsed several times with distilled water and dried at 87°C for 1 hour prior to MRI scanning.
MR Imaging of Coated Samples
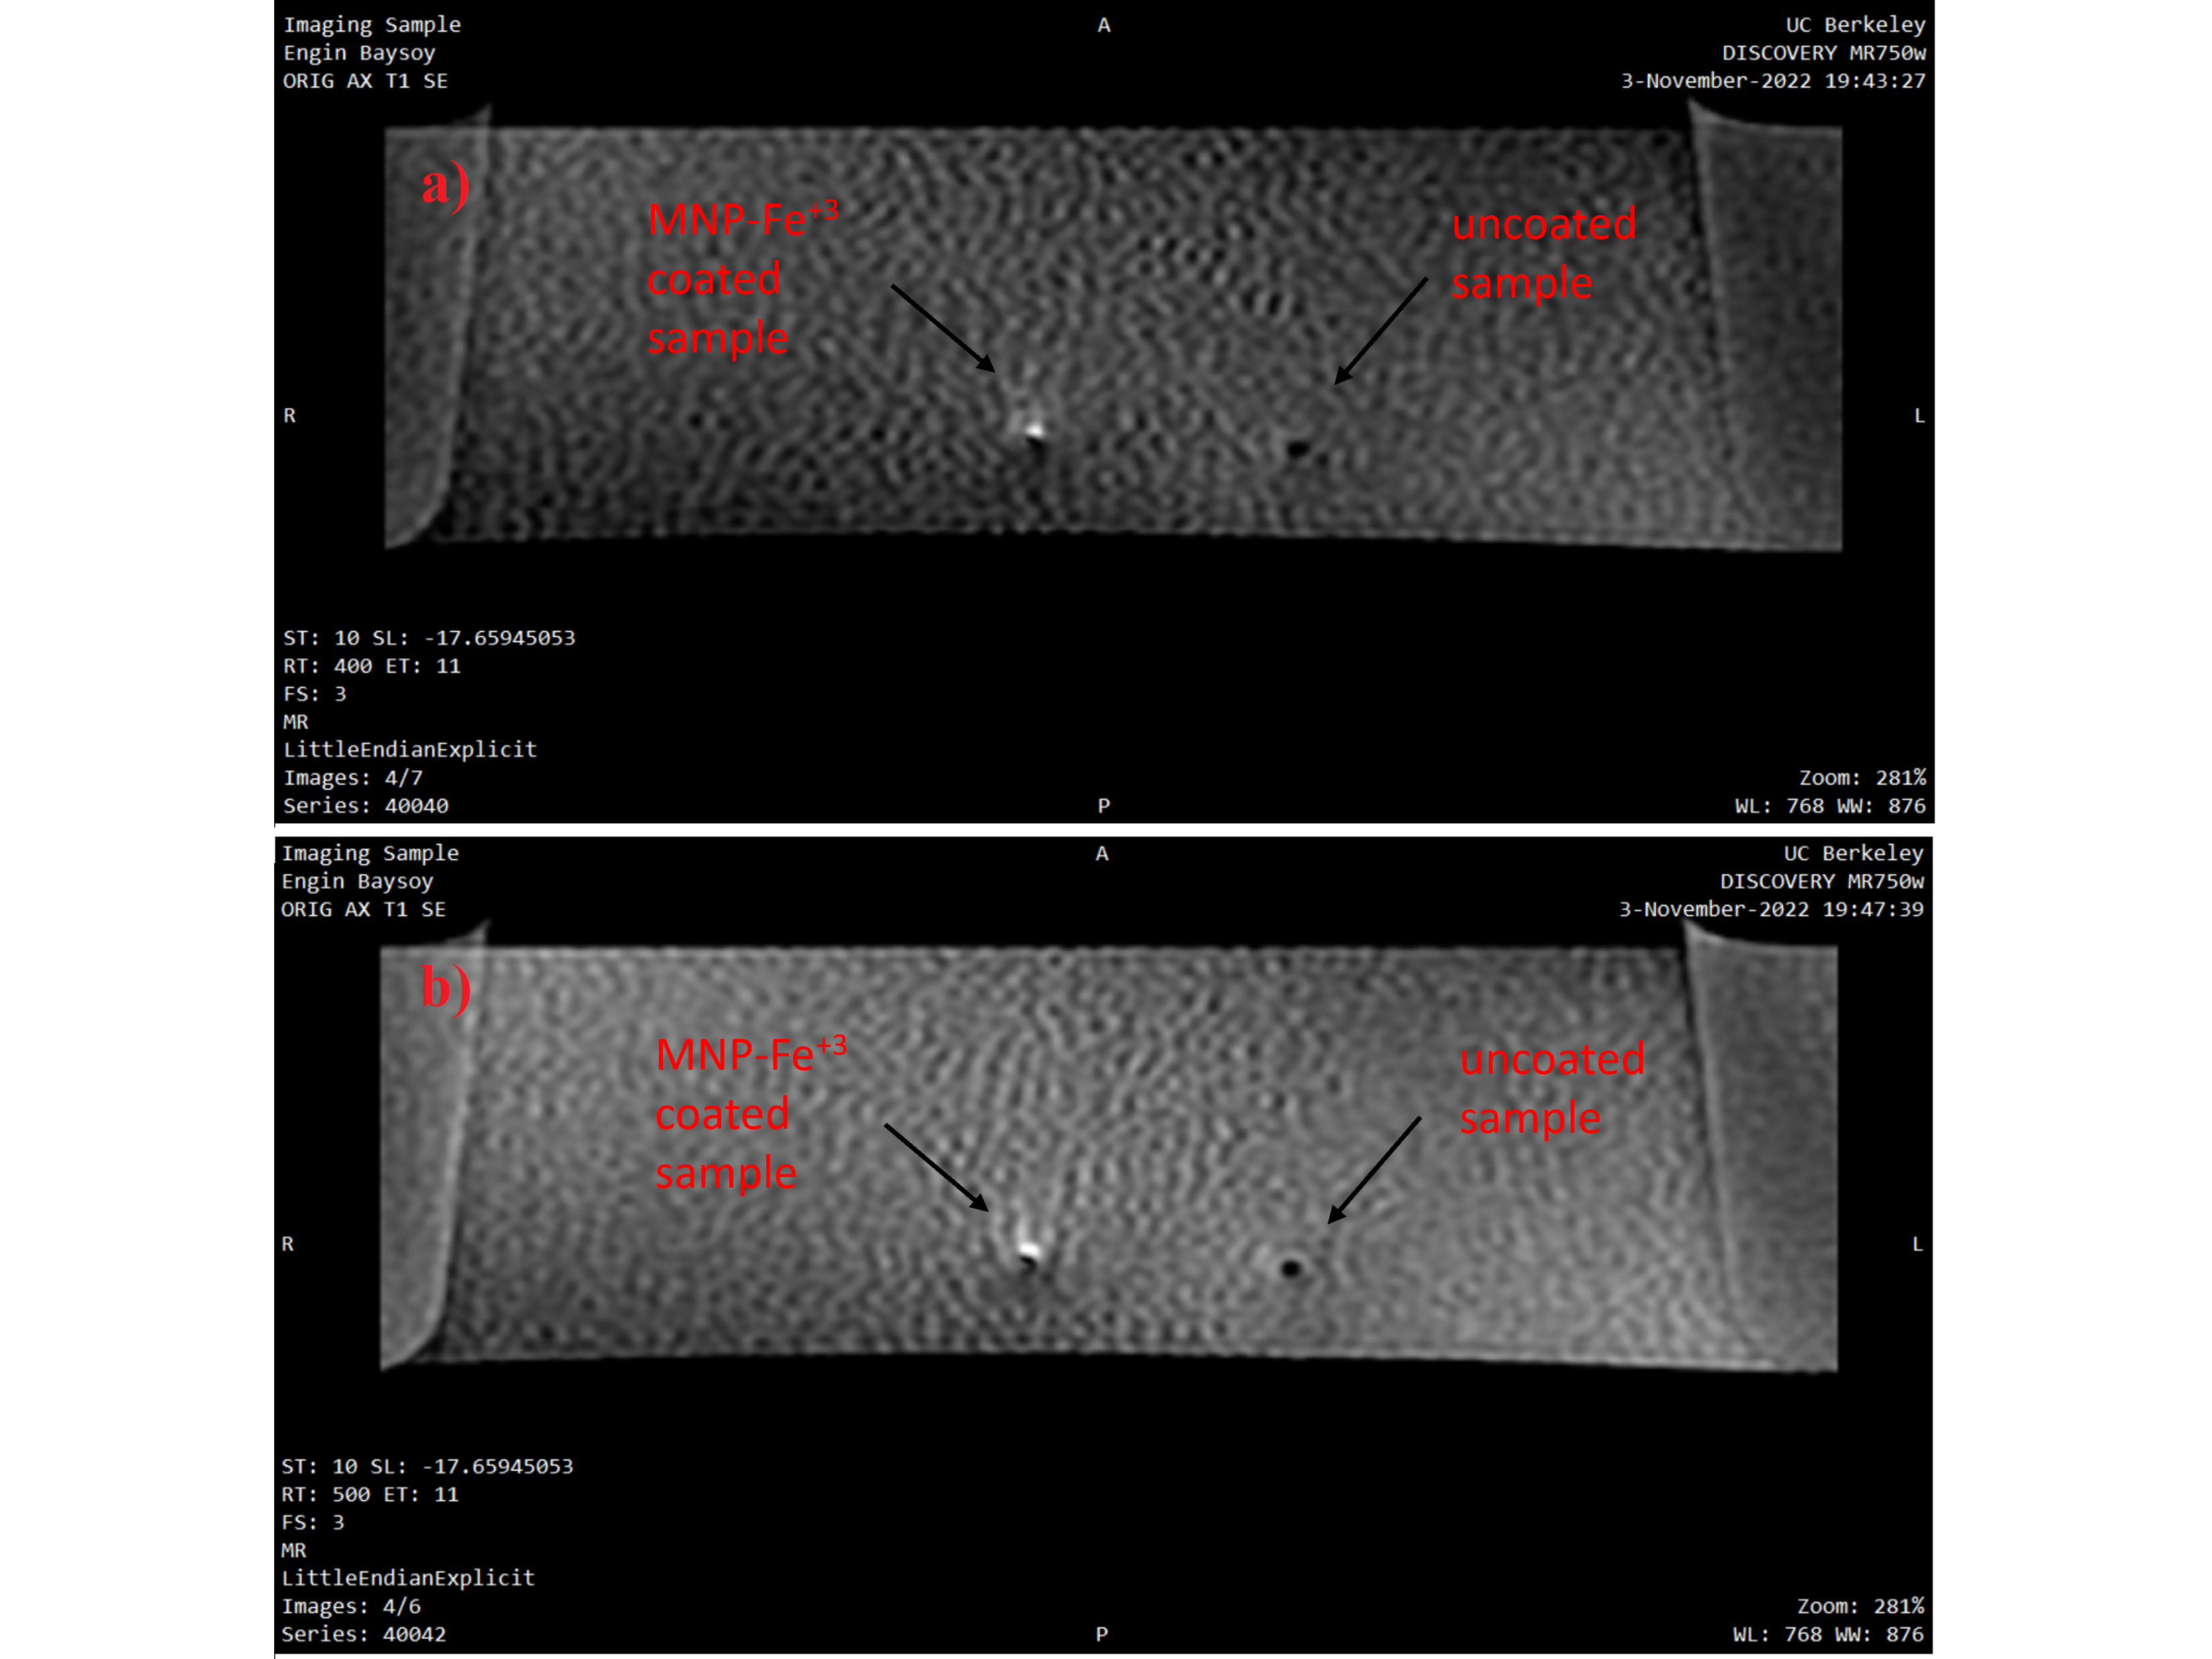
A spin echo sequence was performed for axial imaging of coated and uncoated (control) samples with a 10 mm slice thickness and matrix size of 256×256, while TR: 400/500 ms, TE: 11 ms and flip angle: 90°.
RESULTS
SEM image in Figure 1 shows that a uniform and spherical shape of natural melanin nanoparticles with approximately 101.1±11.2 nm diameter were obtained after the extraction process. T1 map of all solutions is given in Figure 2. T1 values of MNP-Fe3+ solutions were measured to be much lower (192.7 ms and 528.4 ms) than the T1 values of gadolinium-based contrast agents (382.5 ms and 840.9 ms) for 0.3 mM and 0.1 mM concentrations respectively. Images of coated samples are shown in Figure 3. The effect of MNP-Fe3+ ions deposition over nitinol guidewire samples was observed as a “bright spot” in MRI compared to uncoated samples as indicated in Figure 4.DISCUSSION
Consistent with the low T1 values (high relaxation rate) of MNPs-Fe3+ solution, nitinol guidewire samples coated with Fe+3 chelated MNPs presented a distinguished bright signal in MRI compared to uncoated samples. In future applications, a more uniform deposition of nanoparticles over samples will potentially enhance the traceability of MRI-safe instruments in MR scans.CONCLUSION
Coating of non-magnetic instruments with MNP-Fe+3 solution presents a novel passive design method for developing MRI compatible and trackable interventional devices in the future.Acknowledgements
This study was funded through a The Scientific and Technological Research Council Of Türkiye (TUBITAK) Grant (2219-1059B192100591).References
1- Lederman RJ. Cardiovascular interventional magnetic resonance imaging. NIH Public Access: Circulation. 2005;112(19):3009-3017.
2- Kocaturk O, Saikus CE, Guttman MA, et al. Whole shaft visibility and mechanical performance for active MR catheters using copper-nitinol braided polymer tubes. J Cardiovasc Magn Reson 2009;11(29).
3- Settecase F, Hetts SW, Martin AJ, et al. RF Heating of MRI-Assisted Catheter Steering Coils for Interventional MRI. Acad Radiol. 2011;18(3):277-85.
4- Barkhausen J, Kahn T, Krombach GA, et al. White Paper: Interventional MRI: Current Status and Potential for Development Considering Economic Perspectives, Part 1: General Application. Fortschr Röntgenstr, 2017;189(1):611–623.
5- Omary RA, Unal O, Koscielski DS, et al. Real-time MR ımaging-guided passive catheter tracking with use of gadolinium-filled catheters J Vasc Interv Radiol. 2000;11(8):1079-85.
6- Unal O, Li J, Cheng W, Yu H, et al. MR-visible coatings for endovascular device visualization. J Magn Reson Imaging. 2006;23(5):763-9.
7- Dominguez-Viqueira W, Karimi H, Lam WW, Cunningham CH. A controllable susceptibility marker for passive device tracking. Magn Reson Med. 2014;72(1):269-75.
8- Basar B, Sonmez M, Yildirim DK, Paul R, et al. Susceptibility artifacts from metallic markers and cardiac catheterization devices on a high-performance 0.55 T MRI system. Magn Reson Imaging. 2021;77:14-20.
9- Kaiser M, Detert M, Rube MA, et al. Resonant marker design and fabrication techniques for device visualization during interventional magnetic resonance imaging. Biomed Eng Biomed Tech. 2015;60(2):89–103.
10- Alipour A, Gokyar S, Algin O, et al. An inductively coupled ultra-thin, flexible, and passive RF resonator for MRI marking and guiding purposes: Clinical feasibility. Magn Reson Med. 2018;80(1):361-370.
11- Baysoy E, Yildirim DK, Ozsoy C, et al. Thin film based semi-active resonant marker design for low profile interventional cardiovascular MRI devices. Magma. 2017;30:93-100.
12- Ju KY, Lee JW, Im GH, et al. Bio-inspired, melanin-like nanoparticles as a highly efficient contrast agent for T1-weighted magnetic resonance imaging. Biomacromolecules 2013;14(10):3491-7.
13- Fan Q, Cheng K, Hu X, et al. Transferring biomarker into molecular probe: melanin nanoparticle as a naturally active platform for multimodality imaging. J Am Chem Soc. 2014;136(43):15185-94.
14- Xu W, Sun J, Li L, et al. Melanin-manganese nanoparticles with ultrahigh efficient clearance in vivo for tumor-targeting T1 magnetic resonance imaging contrast agent. Biomaterials science. 2017;6(1):207-215.
15- Chen A, Sun J, Liu SJ, et al. The effect of metal ions on endogenous melanin nanoparticles used as magnetic resonance imaging contrast agents. Biomaterials science. 2019.
16- Caldas M, Santos AC, Veiga F, et al. Melanin nanoparticles as a promising tool for biomedical applications - a review. Acta Biomater. 2020;15(105)26-43.
17- Liu H, Yang Y, Liu Y, et al. Melanin-Like Nanomaterials for Advanced Biomedical Applications: A Versatile Platform with Extraordinary Promise. Adv Sci (Weinh). 2020;7(7):1903129.
18- Kaleli-Can G, Ozlu B, Ozguzar HF, et al. Natural Melanin Nanoparticle-decorated Screen-printed Carbon Electrode: Performance Test for Amperometric Determination of Hexavalent Chromium as Model Trace. Electroanalysis. 2020;32:1696–1706.
19- Jakubiak P, Cantrill C, Urtti A, et al. Establishment of an in vitro–in vivo correlation for melanin binding and the extension of the ocular half-life of small-molecule drugs. Molecular Pharmaceutics. 2019;16(12):4890-4901.
20- Look DC, Locker DR. Time saving in measurement of NMR and EPR relaxation times. Rev Sci Instrum 1970;41:250–251.
21- Rohrer M, Bauer H, Mintorovitch J, et al. Comparison of magnetic properties of MRI contrast media solutions at different magnetic field strengths. Invest Radiol. 2005;40(11):715-24.
Figures