4383
Susceptibility-based Positive Contrast Imaging of MR Compatible Metallic Devices Using Model-based Deep Learning1Lauterbur Research Center for Biomedical Imaging, Shenzhen Institutes of Advanced Technology, Chinese Academy of Sciences, Shenzhen, China, Shenzhen, China, 2Shenzhen College of Advanced Technology, University of Chinese Academy of Sciences, Shenzhen, China, Shenzhen, China, 3Research Centre for Medical AI, Shenzhen Institutes of Advanced Technology, Chinese Academy of Science, Shenzhen, China, Shenzhen, China
Synopsis
Keywords: Interventional Devices, Machine Learning/Artificial Intelligence
Susceptibility-based positive contrast MR imaging exhibits excellent efficacy for visualizing the MR compatible metallic devices, by taking advantage of their high magnetic susceptibility. In this work, a model-based deep learning architecture with U-net is developed to realize the 3D susceptibility-based positive contrast MR imaging on real phantom experiments. We train the network on synthetic data to generate positive contrast images from magnetic field maps for localizing the seeds from their surroundings and demonstrate the potential of the deep learning implementation.Introduction
Positive susceptibility contrast imaging (PSCI) exhibits excellent efficacy for visualizing the MR compatible metallic devices, by taking advantage of their high magnetic susceptibility 1,2. However, the reconstruction of the PSCI requires the solution of an ill-posed field-to-source-inversion. Current techniques utilize manual optimization of regularization parameters to balance between smoothing, artifacts and effects of the positive contrast. Recently, deep learning has shown promising results to improve accurately calculation of the susceptibility value3–5. In this work, we proposed a model-based deep learning architecture with U-net, referred to as MoDL-PSCI, to invert the magnetic dipole kernel convolution. We train the network on synthetic data and generate positive contrast images by highlightly localizing the seeds from their surroundings to demonstrate the potential of the deep learning implementation.Theory and Methods
Combination of PSCI and CNNThe positive contrast MR image $$$\chi$$$, can be reconstructed by solving a ℓ1 norm optimization problem in equation (1). This is because the susceptibility mapping $$$\chi(r)$$$ is expected to be sparsely represented in the spatial image gradient domain. G is a first order gradient operator to promote sparsity. Here, One can use the proximal gradient descent algorithm6 to iteratively solve equation (2).
$$ g(χ)=||W(Cχ-δ)||_2^2+λ||MGχ||_1 (1)$$
The $$$\chi$$$ in the kth iteration can be expressed
$$\chi ̂^k=Prox_{T_{k},R} (\chi ̂^{k-1}-{t_{k-1}}∇_g(χ ̂^{k-1})) (2)$$
and $$∇_g (\chi ̂^{k-1} )=2C^H W^H (W(C\chi ̂^{k-1}-δ)) +λG^H M^H T^{-1} MG\chi ̂^{k-1}$$
$$P(\chi ̂^{k-1})=\chi ̂^{k-1}-{t_{k-1}}∇_g( \chi ̂^{k-1})$$
$$=(1-2t_{{k-1}} C^H W^H WC+ λG^H M^HT^{-1} MG)\chi ̂^{k-1}-2t_{{k-1}} C^H W^H Wδ$$
Given: $$A=1-2t_{k-1} C^H W^H WC+ λG^H M^H T^{-1} MG, B=C^H W^H W $$
So, $$P(\chi ̂^{k-1})=A\chi ̂^{k-1}-2t_{k-1}Bδ (3) $$
Where $$$Prox_{T_{k},R} (\cdot)$$$ is the proximity operator:
$$Prox_{T_{k},R} (Z)=argmin_{\chi}(R(Z)+\frac{1}{2T_k-1}||χ-Z||_2^2 ) (4) $$
We incorporate CNNs to train$$$ g(\chi) $$$ term, which can be solved by gradient descent.$$$t_k$$$ is the step size in the kth iteration in gradient descent. The initialized $$$\chi=0$$$. W is a weighting matrix, C is the dipole kernel, $$$\lambda$$$ is a regularization parameter, M is a masking matrix.
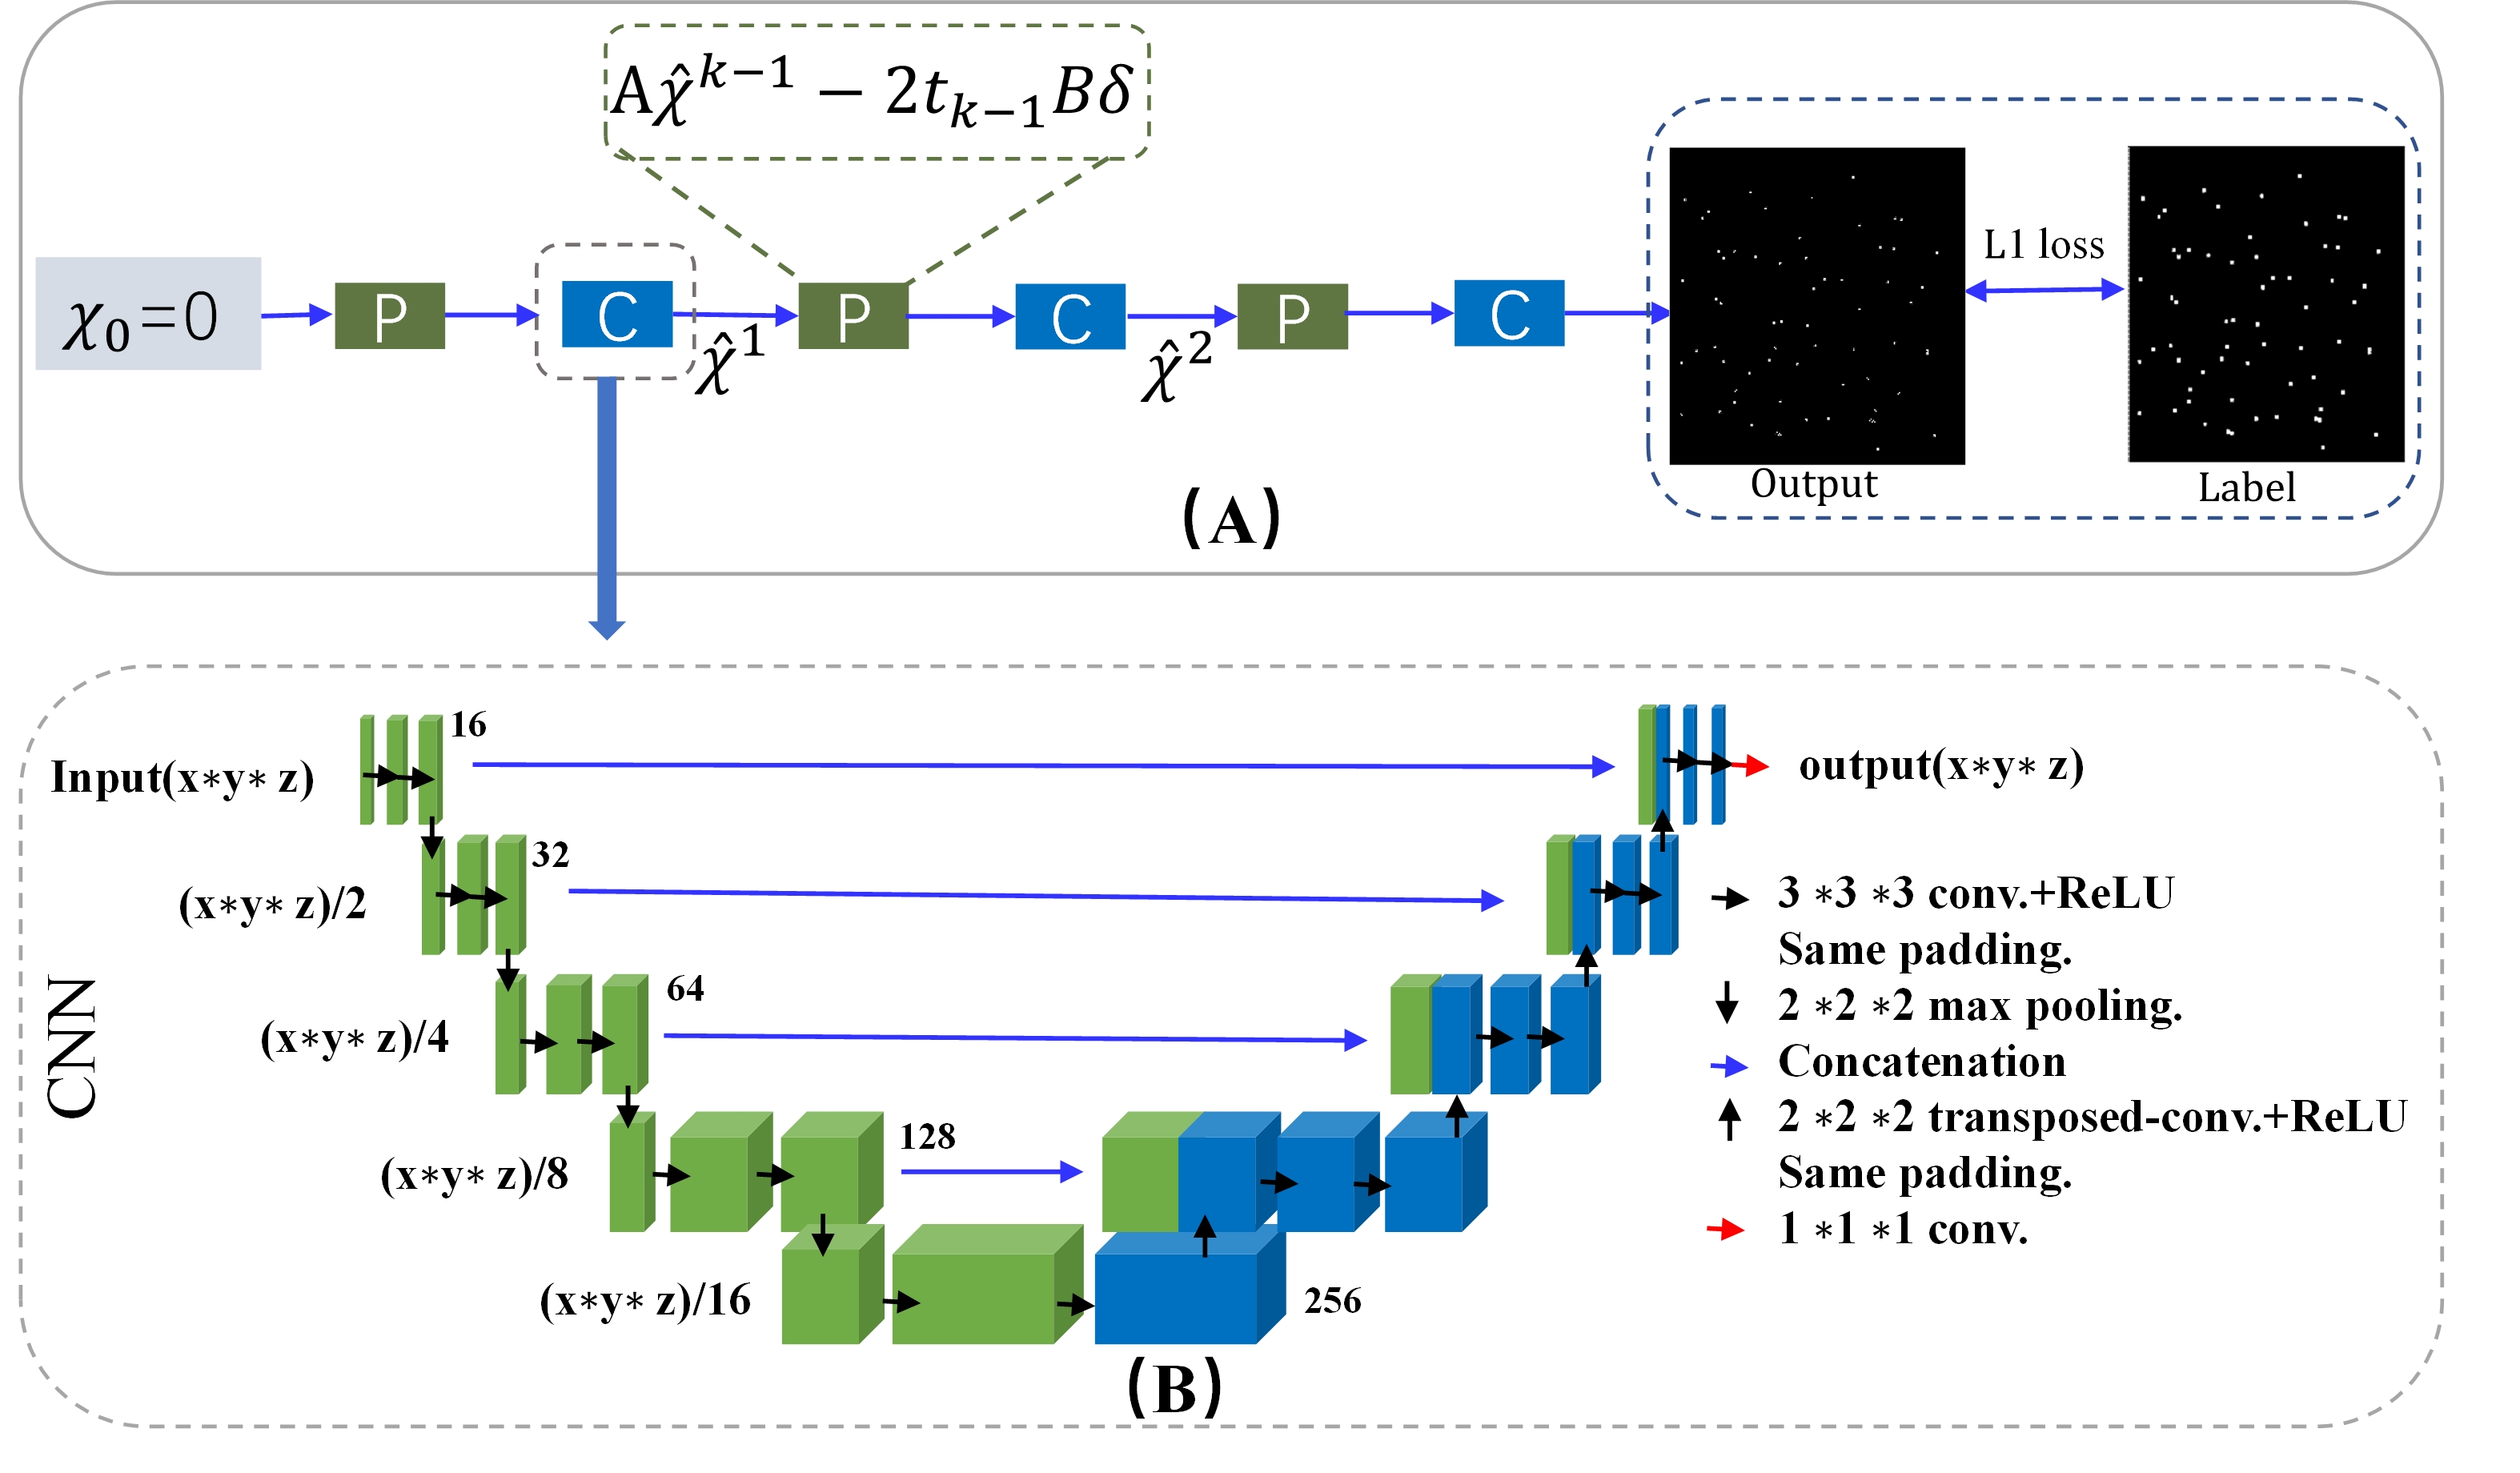
Network architecture
The network architecture is depicted in Figure 1. The u-net input is the initial 3-dimensional susceptibility maps obtained by TV regularization in equation (1). The contracting portion consists of 16 convolutional layers, the kernel size is 3 × 3 × 3 with stride 1. Rectified linear unit (ReLU) is adopted as the activation function and a 2 × 2 × 2 max-pooling operation is used. Each level of the expanding portion consists of 2 × 2 × 2 upsampling, or transposed convolution. Transposed convolutions bring the image back to its original dimensions which have a stride of 2 × 2 × 2 and 3 × 3 × 3 convolutions. The final layer is completed with a 1 × 1 × 1 convolution layer with a hyperbolic tangent (tanh) activation. The u-net output is the 3-dimensional susceptibility map.
Synthetic data and real data
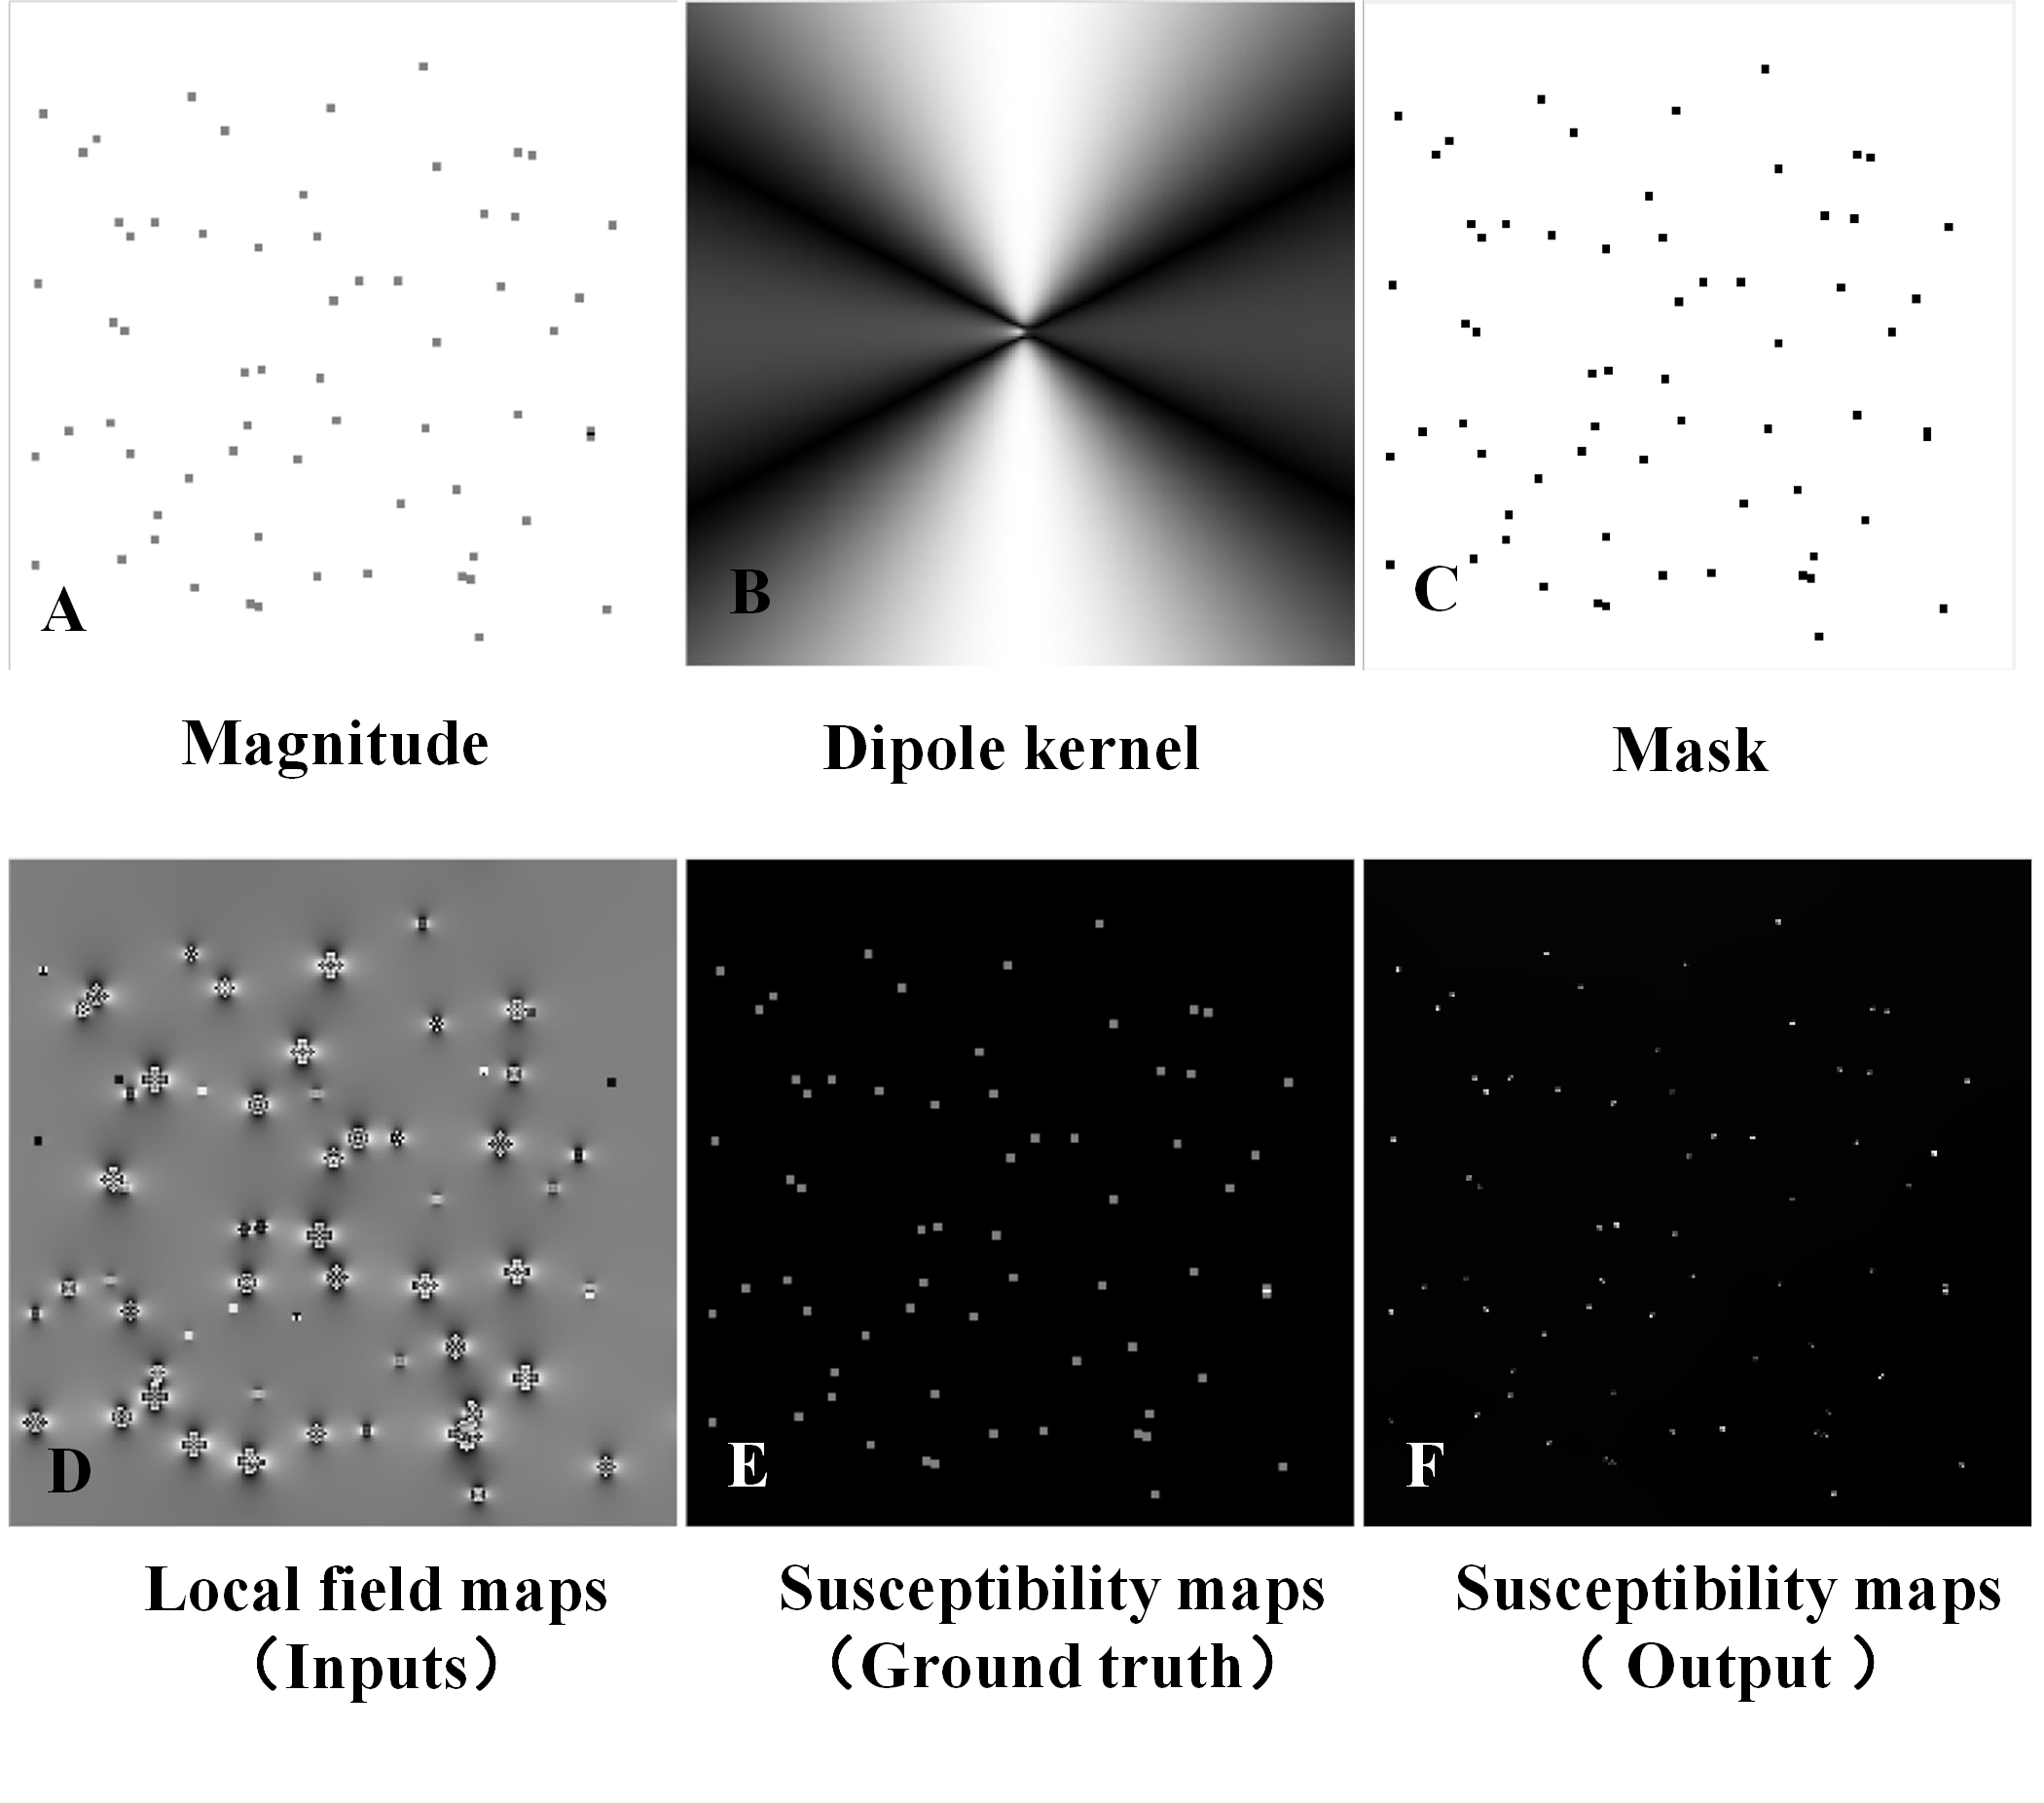
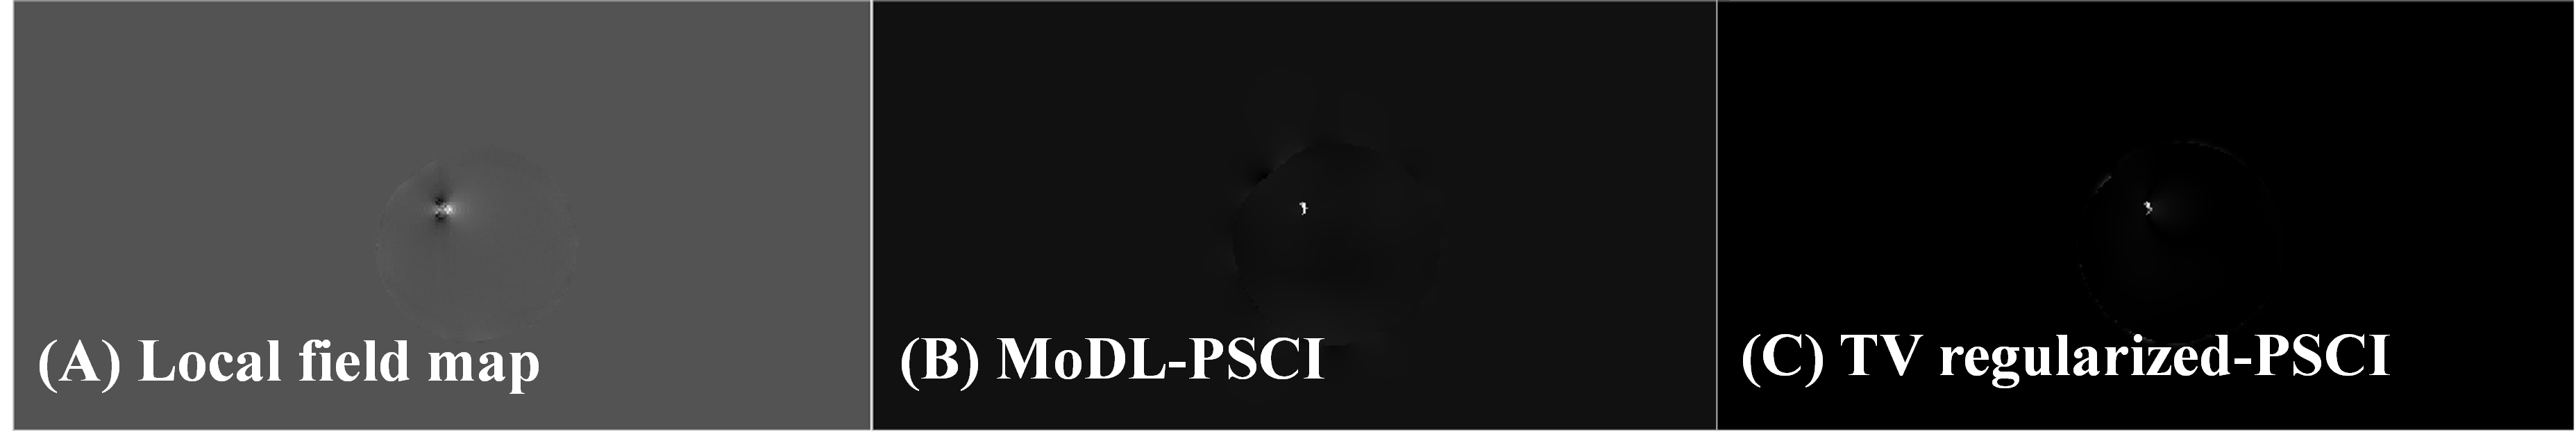
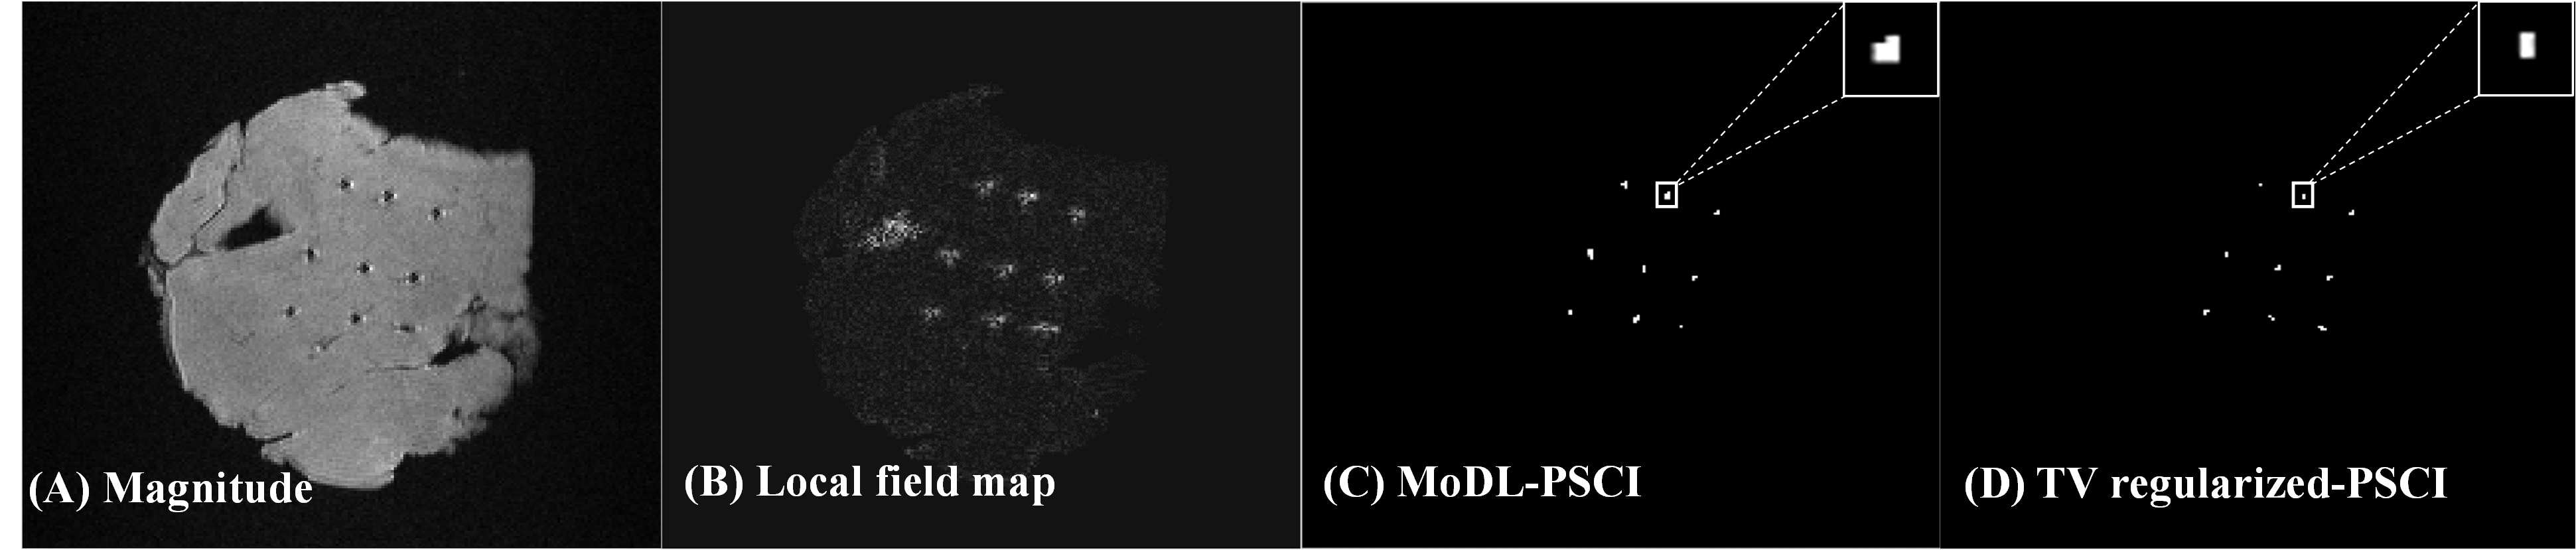
Ground truth susceptibility maps were generated first as the target data. Magnetic field maps $$$\delta$$$ , dipole kernel C , magnitude W and masking matrix M were the synthetic training data that used for the CNN network inputs (See Figure 2). An empty image 𝑥 × 𝑦 × 𝑧 was created, and a fake tissue sample with uniform susceptibility 100 ppm was placed within it to simulate the brachytherapy seeds. Seeds were placed at random orientations and their locations were randomly chosen across all slices. The real data were acquired using 3D FSE with the vFA strategy7 and on a 3T whole-body MRI scanner (u790, United imaging, China) which were used to evaluate the generalizability of the model. The first real MRI data were obtained from a biopsy needle which was inserted into a water phantom. The second real data of ex vivo experiments are from reference7 7. When finished the data sampling, the magnitude and local field map were calculated as reference7 7 before being fed into the network.
Results
We apply the synthetically trained model to real MRI data to see how well it can generate positive contrast images. Figure 2(F) showed the u-net output which could be able to correctly determine the seeds’ true locations although they were over-smoothed in the synthetical data(Figure 2(E)). The results of the real experiment for a single slice were presented in Figure 3&4. The results showed that the model was able to output the metallic devices in positive contrast, while eliminating the susceptibility artifacts that surrounded them in the original field image and it could be capable of solving the ill-posed field-to-source inversion on real-world in MRI phase data without the need for manual parameter tuning. Therefore, it demonstrates the feasibility of the deep learning method and its potential in generating susceptibility-based positive contrast images.Conclusion
In this work, we sought to develop a deep learning-based approach to generating positive contrast MR images for the MR-compatible metallic devices. Synthetic data were used to train our model before it was evaluated on real data. Based on our results, we can conclude that the current CNN implementation could obtain the comparable results with the iterative regularized 𝑙1 minimization algorithm(TV regularized-PSCI). There are certainly improvements that can be made to further optimize our implementation as well as applying it to a wider selection of interventional devices.Acknowledgements
This work was partially supported by the National Natural Science Foundation of China (81901736, 61871373, 62271474, 81830056, 61771463, U1805261, 81729003, 12026603, 12026603 and 81971611), the Strategic Priority Research Program of Chinese Academy of Sciences (XDB25000000 and XDC07040000), the High-level Talent Program in Pearl River Talent Plan of Guangdong Province (2019QN01Y986), the Key Laboratory for Magnetic Resonance and Multimodality Imaging of Guangdong Province (2020B1212060051), the Science and Technology Plan Program of Guangzhou (202007030002), the Key Field R&D Program of Guangdong Province (2018B030335001), the Shenzhen Science and Technology Program, Grant Award (JCYJ20210324115810030), and the Shenzhen Science and Technology Program (Grant No. KQTD20180413181834876, and KCXF20211020163408012).References
1. Dong Y, Chang Z, Xie G, Whitehead G, Ji JX. Susceptibility-Based Positive Contrast MRI of Brachytherapy Seeds. Magnetic Resonance in Medicine. 2015;74:716–726.
2. Shi C, Xie G, Zhang Y, et al. Accelerated susceptibility-based positive contrast imaging of MR compatible metallic devices based on modified fast spin echo sequences. Physics in Medicine and Biology. 2017;62:2505–2520.
3. Yoon J, Gong E, Chatnuntawech I, et al. Quantitative susceptibility mapping using deep neural network: QSMnet. NeuroImage. 2018;179:199–206.
4. Bollmann S, Rasmussen KGB, Kristensen M, et al. DeepQSM - using deep learning to solve the dipole inversion for quantitative susceptibility mapping. NeuroImage. 2019;195:373–383.
5. Hanspach J, Bollmann S, Grigo J, Karius A, Uder M, Laun FB. Deep learning–based quantitative susceptibility mapping (QSM) in the presence of fat using synthetically generated multi-echo phase training data. Magnetic Resonance in Medicine. 2022;1548–1560.
6. Boyd NP and S. Proximal Algorithms. In: Foundations and Trends in Optimization. 2014; pp. 127–239.
7. Shi C, Qiu Z, Liu C, et al. Rapid variable flip angle positive susceptibility contrast imaging for clinical metal seeds. Journal of Magnetic Resonance. 2022;340:107232.
Figures