4381
Relaxometric mapping of normal tissue using magnetic resonance fingerprinting (MRF)
Enlin Qian1, Amaresha Shridhar Konar2, Tiago Fernandes3, Ramesh Paudyal2, Amita Shukla-Dave2,4, Lawrence Schwartz5, and Sairam Geethanath3
1Columbia Magnetic Resonance Research Center, Columbia University, New York, NY, United States, 2Department of Medical Physics, Memorial Sloan Kettering Cancer Center, New York, NY, United States, 3Accessible MR Laboratory, Biomedical Engineering and Imaging Institute, Dept. of Diagnostic, Molecular and Interventional Radiology, Icahn School of Medicine at Mt. Sinai, New York, NY, United States, 4Department of Radiology, Memorial Sloan Kettering Cancer Center, New York, NY, United States, 5Department of Radiology, Columbia University Irving Medical Center and New York Presbyterian Hospital, New York, NY, United States
1Columbia Magnetic Resonance Research Center, Columbia University, New York, NY, United States, 2Department of Medical Physics, Memorial Sloan Kettering Cancer Center, New York, NY, United States, 3Accessible MR Laboratory, Biomedical Engineering and Imaging Institute, Dept. of Diagnostic, Molecular and Interventional Radiology, Icahn School of Medicine at Mt. Sinai, New York, NY, United States, 4Department of Radiology, Memorial Sloan Kettering Cancer Center, New York, NY, United States, 5Department of Radiology, Columbia University Irving Medical Center and New York Presbyterian Hospital, New York, NY, United States
Synopsis
Keywords: Muscle, Muscle
We explored the feasibility of T1 and T2 mapping of normal tissue (masseter muscle) in the head and neck (HN) region using magnetic resonance fingerprinting (MRF) and evaluated its repeatability. Our study included fingerprinting data from four healthy volunteers and four repeats each, along with acquiring B0 maps. The T1 and T2 estimation of masseter muscle by MRF is similar to previous literature values. We report wCV<4.3% for T1 measurements and wCV<7% for T2 measurements for all subjects. No significant B0 variations were observed in the masseter muscle regions.Introduction
MRI is commonly used for imaging tissue in the head and neck (HN) region. While T1 and T2 metrics could be useful biomarkers for HN tumor morphology, only a limited number of studies investigates the relaxometric mapping of HN region 1. Clinical relaxometry mapping is restricted by long acquisition times.In this study, we explored the feasibility of T1 and T2 mapping of normal tissue masseter muscle in the HN region using magnetic resonance fingerprinting (MRF) and evaluated its reliability and robustness by conducting a repeatability study on four healthy volunteers with four repeats each. We are the first to demonstrate normal tissue masseter muscle T1 and T2 mapping using MRF to the best of our knowledge.
Methods
Volunteer selectionFour healthy volunteers participated in this study. Written informed consent was obtained from all the volunteers. The median age of the four volunteers was 32 years (range, 24-34 years; all males). None of the volunteers have a patient history related to masseter muscles. The subject-specific information is presented in Table 1.
MRF implementation
The TR/FA scheme of the MRF sequence used parameters reported in previous literature 2, 3. The sequence parameters were: Field of View (FOV) of 25 cm × 25 cm, matrix size=225×225, sampling bandwidth=±250 kHz, TE=2.3 ms, slice thickness=5 mm, number of slices=25. The acquisition time of 25 slices is 7:26 (min:sec). The raw data were reconstructed using singular value decomposition (SVD) based dictionary matching in MATLAB (MathWorks, Nattick, MA). The reconstruction time of a 25 slices dataset is ~3 minutes.
HN MRI protocol
All of the volunteers' scans were performed on a 3T, 70 cm bore scanner (SIGNA Premier, General Electric Healthcare (GEHC,Waukesha, WI, USA), using an HN coil for imaging. The HN imaging protocol consists of a vendor-supplied T1 spin echo (SE) sequence, a T2 fat-suppressed SE sequence, a MRF sequence, and a B0 mapping sequence.
The T1 and T2 SE sequence were only scanned once in the first repeat for subject 1. The B0 mapping sequence was added at the end of the protocol for all subjects except subject 1. We repeated the MRF sequence four times for each subject in a coffee break scan setting. The total scan time of one repeat was ~15 minutes.
A vendor sequence (fast GRE based B0 mapping) was run to acquire the B0 maps. The parameters of the B0 mapping sequence were: TR=250 ms, FOV=250 mm, slice thickness=5 mm, and FA=30 degree. The total acquisition time for the sequence was 2:12 (min:sec).
Region of interest (ROI) and statistical analysis
All ROIs were selected using ITK-SNAP (www.itksnap.org) 4. Two regions (left and right masseter muscle) were selected for each slice where masseter muscles were presented. The size of ROIs were adjusted based on the size of the masseter muscles. We used within-case coefficients of variation (wCV) to assess the repeatability of T1 and T2 values estimated using MRF. For repeatability, wCV is defined as the ratio of the standard deviation (SD) to the mean T1 and T2 values over four repeats.
Results/Discussion
Figure 1 presents the T1w and T2w images acquired using vendor supplied T1 SE and T2 fat-suppressed SE sequence and T1 and T2 maps acquired using MRF for all subjects. One representative slice was used. The orange arrows indicate the location of the masseter muscle. ROIs were selected for all slices where masseter muscles were presented.Table 2 summarizes the HN volunteers’ T1 and T2 value for normal-appearing masseter muscle for all volunteers. The mean T1 and T2 values were 982.0 ms and 75.1 ms for left masseter muscle and 926.2 ms and 69.2 ms for right masseter muscle respectively. These values are comparable to previous literature values 1. The T1 and T2 values of the left masseter muscle are slightly larger than the right masseter muscle. This may be caused by B0 inhomogeneity, shown in Figure 3.
Figure 2 shows the T1 and T2 values of MRF for four datasets. MRF estimates have less than 7% variations for all subjects. The wCV of T2 estimations is larger than the T1 estimations. This may be because the MRF dictionary used in this study has resolution of 10 ms in the small T2 range. A dictionary with finer resolution will likely improve the wCV of T2 estimations.
Figure 3 presents the B0 maps for subject 2, 3, and 4. We did not acquire B0 map for subject 1. The left side of the masseter muscle experiences larger B0 variations compared to the right side of the masseter muscle. This may contribute to the difference in mean T1 and T2 between left and right masseter muscle shown in Table 2. B0 inhomogeneity correction methods may be applied in future work to improve the T1 and T2 values of masseter muscles.
Conclusion
In this study, we investigated feasibility of relaxometric mapping of normal tissue masseter muscle using MRF and evaluated its repeatability. We conducted repeatability study on four healthy volunteers, with four repeats for each volunteer. B0 maps were acquired at the end of the protocol. We report T1 and T2 estimates by MRF similar to previous studies, and wCV<7% for all volunteers.Acknowledgements
This work was supported, in part, by GE-Columbia research partnership grant and also performed at Zuckerman Mind Brain Behavior Institute MRI Platform, a shared resource, and Columbia MR Research Center site.References
- Konar AS, Paudyal R, Shah AD, et al.: Qualitative and Quantitative Performance of Magnetic Resonance Image Compilation (MAGiC) Method: An Exploratory Analysis for Head and Neck Imaging. Cancers 2022; 14.
- Jiang, Y., Ma, D., Seiberlich, N., Gulani, V., & Griswold, M. A. (2015). MR fingerprinting using fast imaging with steady state precession (FISP) with spiral readout. Magnetic Resonance in Medicine. https://doi.org/10.1002/mrm.25559
- Shridhar Konar A, Qian E, Geethanath S, et al.: Quantitative imaging metrics derived from magnetic resonance fingerprinting using ISMRM/NIST MRI system phantom: An international multicenter repeatability and reproducibility study. Med Phys 2021.
- Paul A. Yushkevich, Joseph Piven, Heather Cody Hazlett, Rachel Gimpel Smith, Sean Ho, James C. Gee, and Guido Gerig. User-guided 3D active contour segmentation of anatomical structures: Significantly improved efficiency and reliability. Neuroimage 2006 Jul 1;31(3):1116-28.
Figures
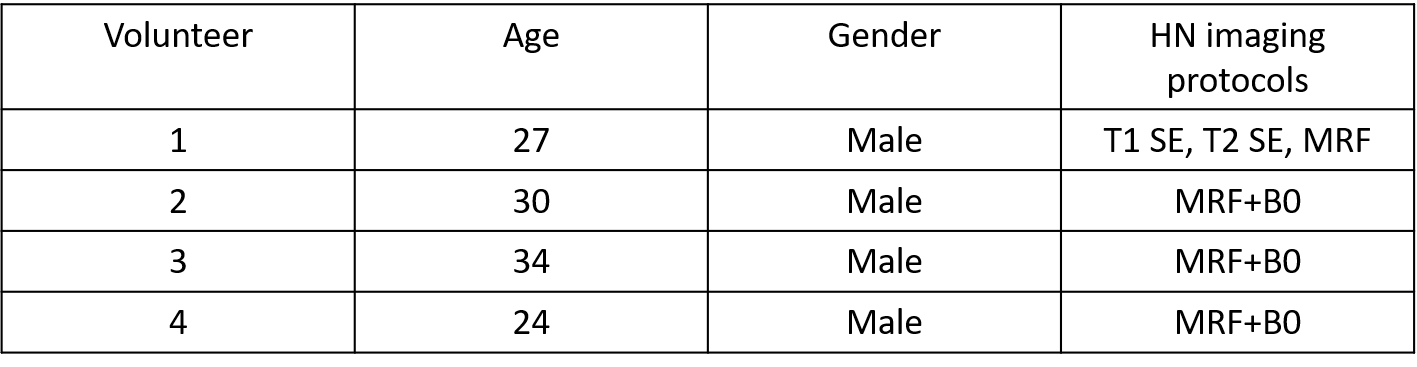
Table 1: Table 1 presents the volunteer information as well as their imaging protocols. The vendor-supplied HN T1 SE and T2 SE sequences were only applied to subject 1. Vendor-supplied B0 mapping sequence was added to all subject scans except subject 1.
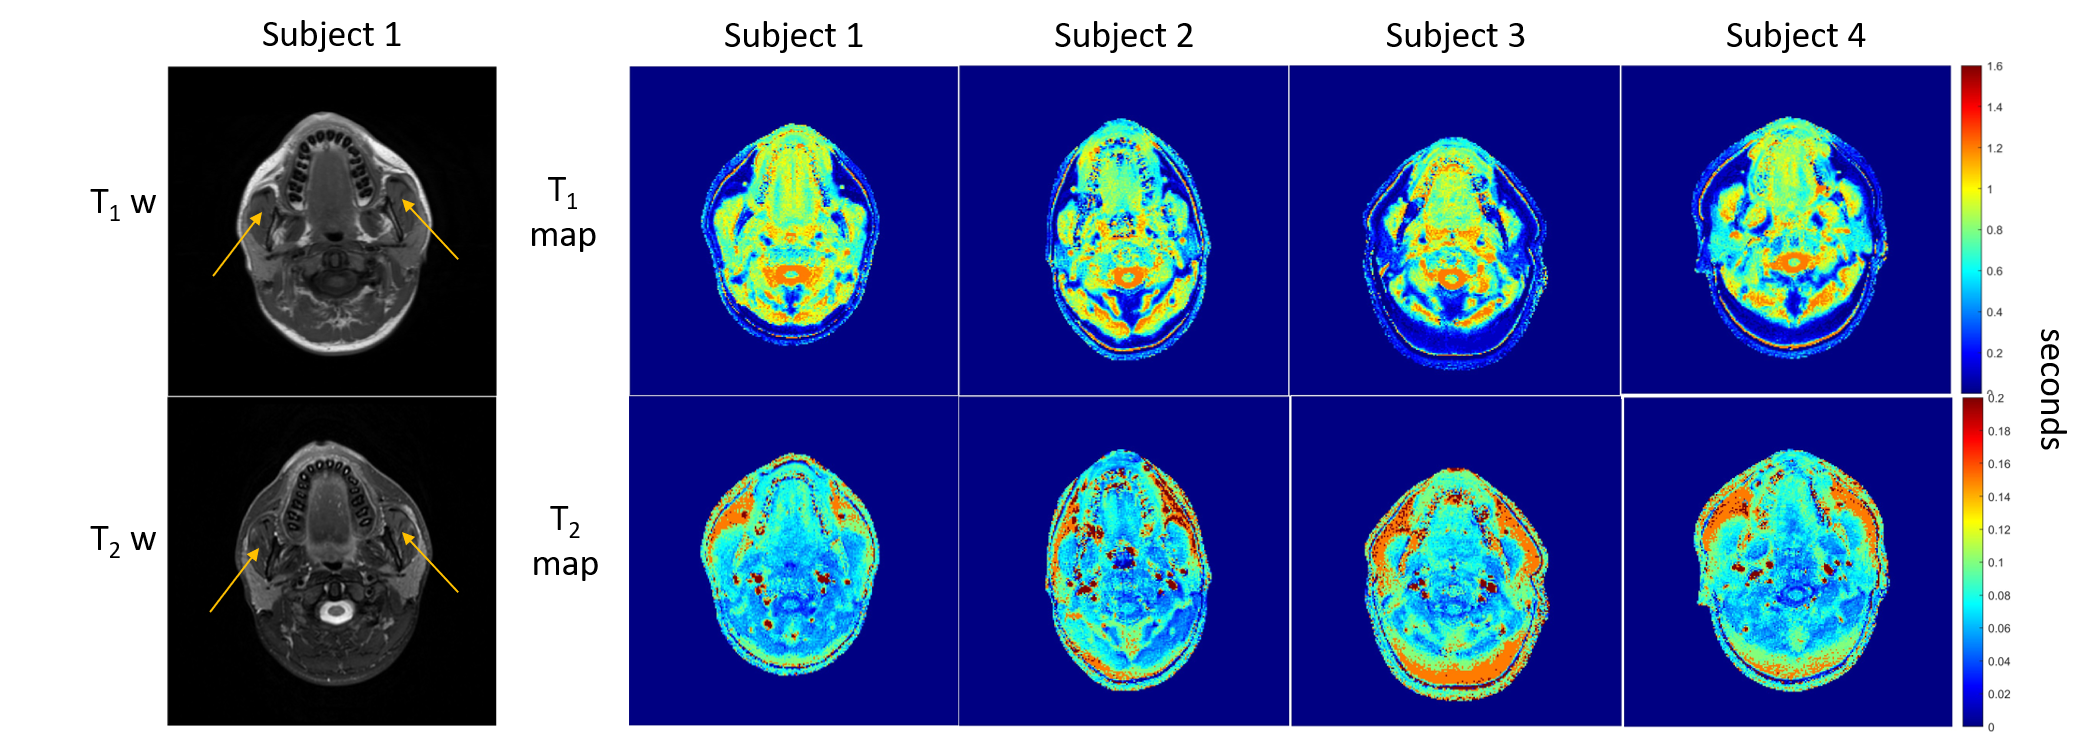
Figure 1: Figure 1 presents the T1w and T2w images for subject 1, and T1 and T2 maps for all subjects. The orange arrow points to the masseter muscle region. One representative slice was selected for this figure.

Table 2: Table 2 is the summary of T1 and T2 estimates by MRF for left and right normal-appearing masseter muscle.
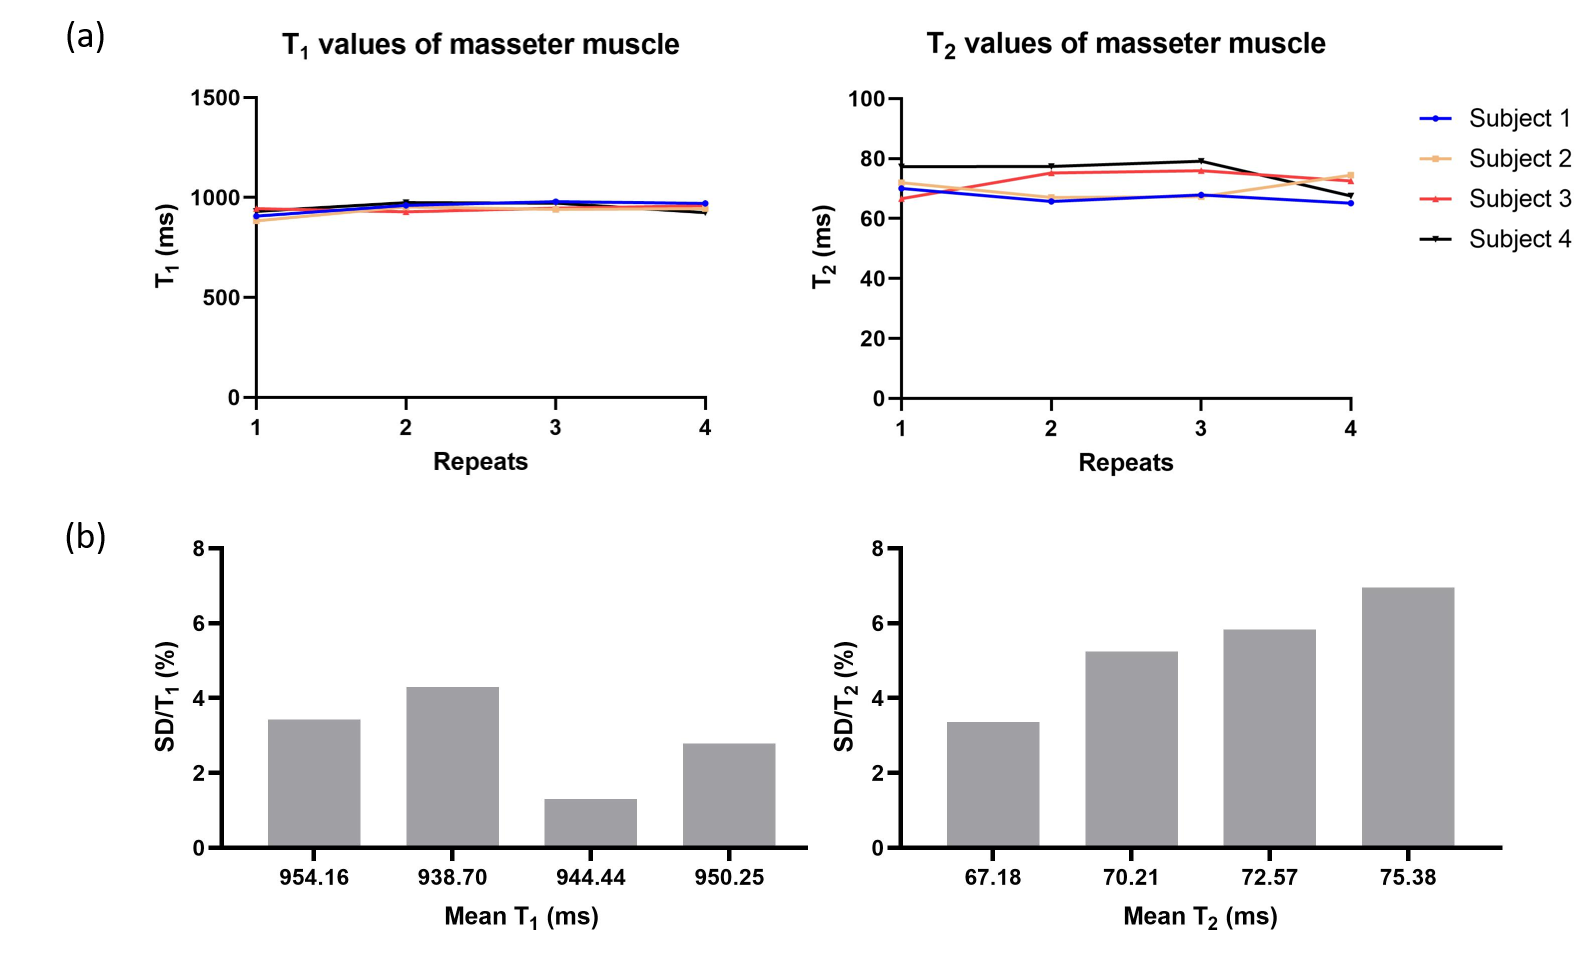
Figure 2: Figure 2 presents (a) the T1 and T2 estimates by MRF for all subjects and all repeats. (b) presents the wCV for all four subjects. wCV is defined as the ratio of standard deviation to mean T1 and T2 values, respectively.

Figure 3: Figure 3 shows the B0 maps for subject 2, 3, and 4. No B0 map was acquired for subject 1. The B0 mapping sequence was added to the end of the HN MRI protocol.
DOI: https://doi.org/10.58530/2023/4381