4379
Quantitative 3D Assessment of Meniscus in Patients with Posterior Root Tears and Healthy Controls Using T2* Mapping at 7T1Center for Magnetic Resonance Research, University of Minnesota, Minneapolis, MN, United States, 2Department of Radiology, University of Minnesota, Minneapolis, MN, United States, 3Department of Biomedical Engineering, Lerner Research Institute, Ohio, OH, United States, 4Twin Cities Orthopedics, Edina, MN, United States, 5Department of Diagnostic and Interventional Radiology, Ataturk University Research Hospital, Erzurum, Turkey
Synopsis
Keywords: MSK, Quantitative Imaging, Meniscus
Evaluating 3D T2* mapping of the meniscus at ultra-high field 7T provides necessary high resolution to better characterize tissue changes in the meniscus. This study was designed to measure the 3D structure of the meniscus with T2* mapping in a clinically acceptable scan time at 7T, and to evaluate meniscus degeneration in twelve patients with arthroscopically verified tears of the posterior horn of the medial meniscus and nine age, sex and body mass index matched healthy controls. T2* mapping at 7T provided comprehensive 3D evaluation of meniscus and detected degenerative alterations caused by the root tears in the patients.Introduction
Meniscal root tears are one of the highest risk factors for the development and progression of knee osteoarthritis1. Early and accurate detection of degenerative changes in menisci, before gross morphological changes are visible, can pave the way to effective treatment plans and potentially avoid the onset and progression of knee osteoarthritis2. We hypothesize that 3D T2* mapping with gradient echo sequences at 7T provides accurate detection of meniscal abnormalities3,4 in clinically feasible time. The goal of this study was i) to design a 3D GRE T2* mapping sequence to capture fast relaxing meniscus signal in a clinically feasible scan time at 7T, and ii) to measure the 3D structure of the meniscus to comprehensively evaluate meniscal degeneration in patients with arthroscopically proven root tears.Methods
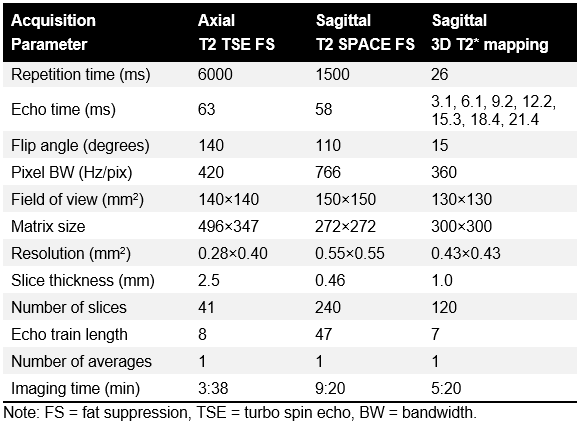
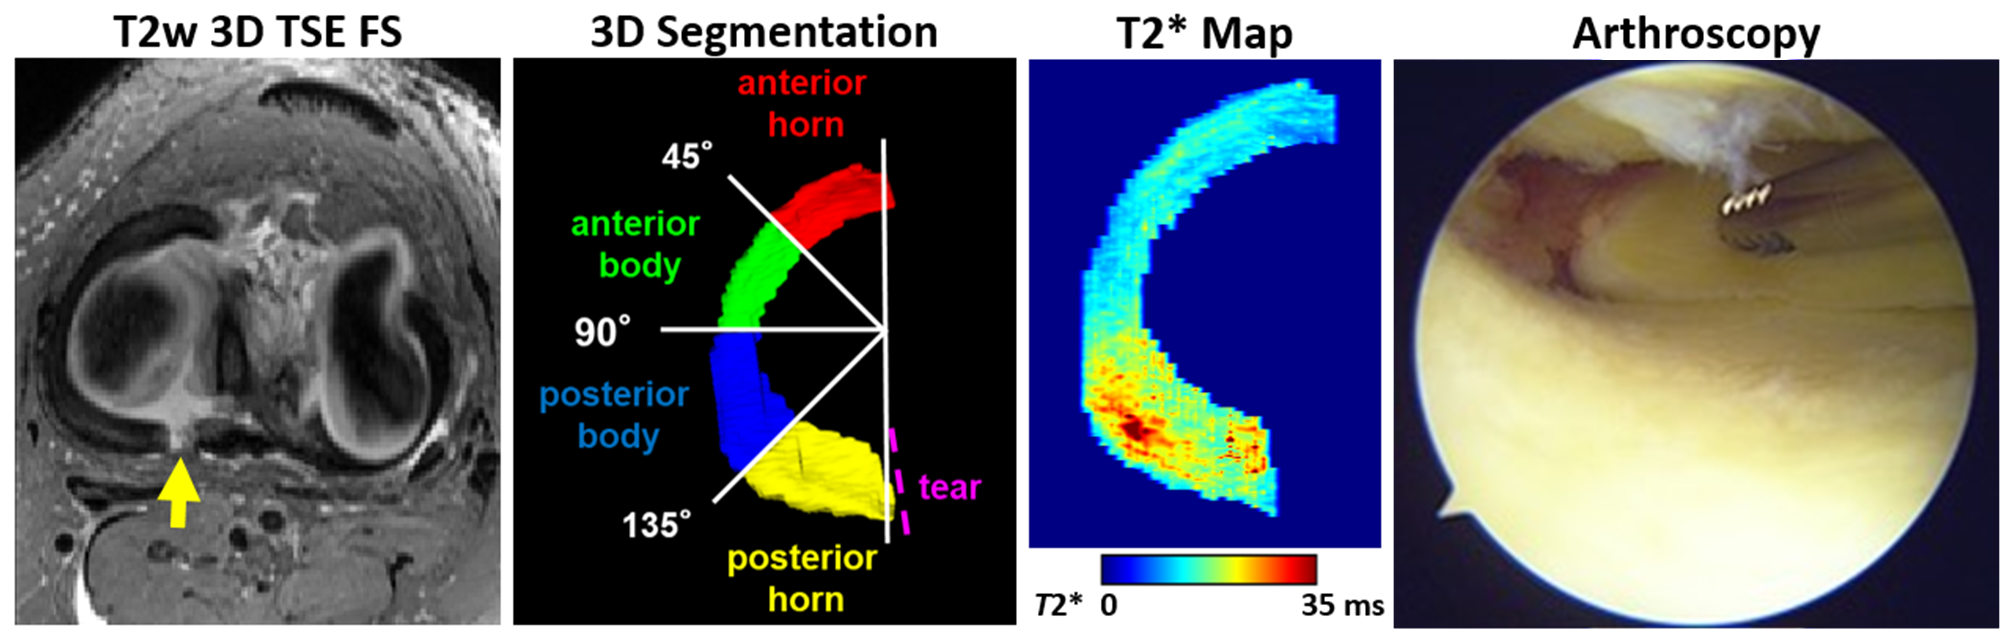
In this study, twelve patients with a Type II unilateral posterior root tear of the medial meniscus (mean age, 52 years {age range: 34-66 years}; mean body mass index, 26.9 kg/m2; 10 women) and nine healthy controls (mean age, 51 years {age range: 34-67}, mean body mass index, 26.2 kg/m2, 7 women) received 7T MRI and subsequently underwent arthroscopic repair of the root attachment. The controls had no knee symptoms or any abnormal knee MRI findings. MRI was performed on a 7T system (Siemens, Erlangen, Germany) using a birdcage transmit and 28-channel receive phased-array knee coil. The MRI protocol included T1- and T2-weighted turbo-spin echo sequences with fat suppression and a T2-weighted 3D SPACE with fat suppression for the morphological evaluation of knee joints. For quantitative evaluation, a 3D multi-echo gradient recalled echo (GRE) sequence with seven echo times (TE) between 3.1 and 21.4 ms was acquired to calculate T2* relaxation times in the menisci. The MRI acquisition parameters are listed in Figure 1. For the quantitative analysis, T2* maps were calculated by fitting a mono-exponential signal decay of the multi-echo T2* data with a two-parametric least-square fitting routine in Matlab. To evaluate the fitting accuracy, root mean square error (RMSE) was normalized to the estimated signal intensity at TE of 0 ms. The 3D-structure of the lateral and medial meniscus was segmented on T2*-weighted images with a TE of 6.1 ms using ITK-SNAP (Fig. 2). The menisci were segmented between the anterior attachment and the tear for the torn menisci, and from the anterior attachment to the posterior attachment for the healthy menisci. The segmented 3D volume of each meniscus was divided into four regions as follows: anterior horn (0°-45°), anterior body (45°-90°), posterior body (90°-135°), and posterior horn (135°-180°) (Fig. 2). Median T2* values and the corresponding RMSE were measured in four meniscal regions. Arthroscopic evaluation of the meniscus integrity was performed during the repair of the posterior root attachment of the medial meniscus (Figure 2). The Pauli grading system5 was used to assess the menisci by evaluating the surface integrity of the femoral, tibial, and inner surfaces during the arthroscopy. For statistical analyses, a linear mixed effect model, with age and body mass index as covariates, was used to evaluate T2* values between the regions in patients and healthy controls. A P-value of 0.05 was considered as the limit of statistical significance.Results
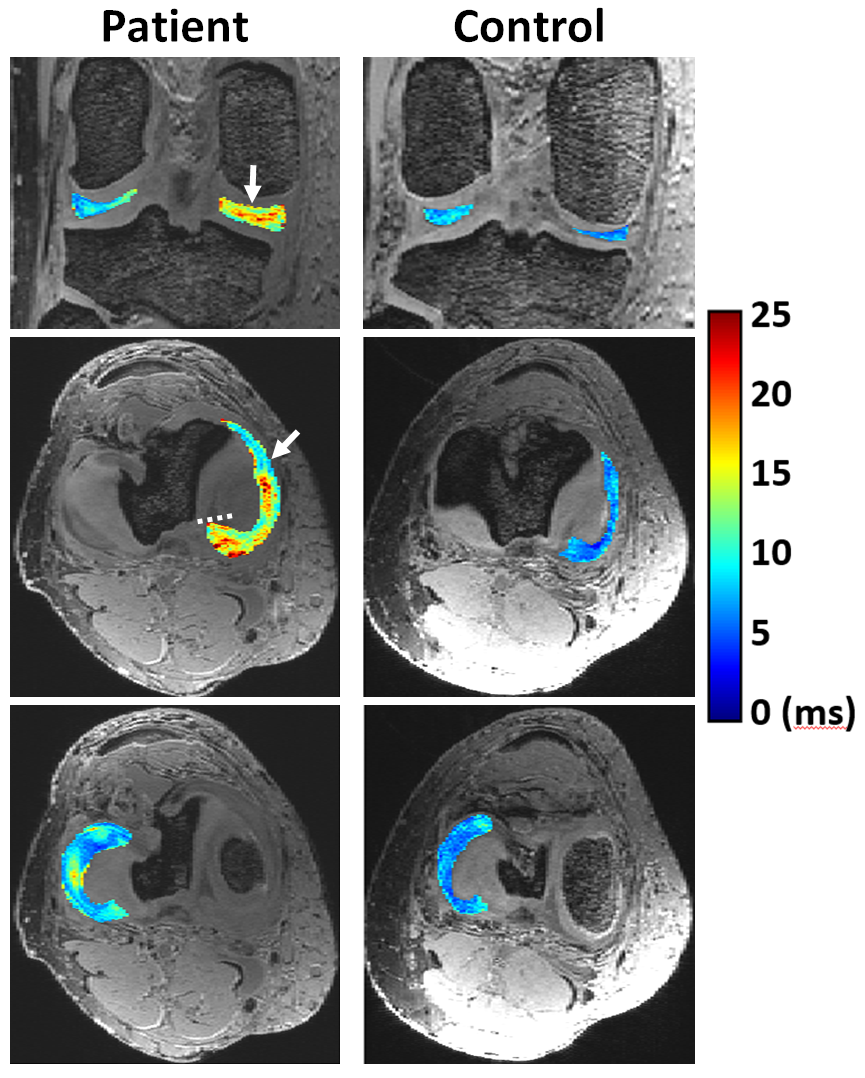
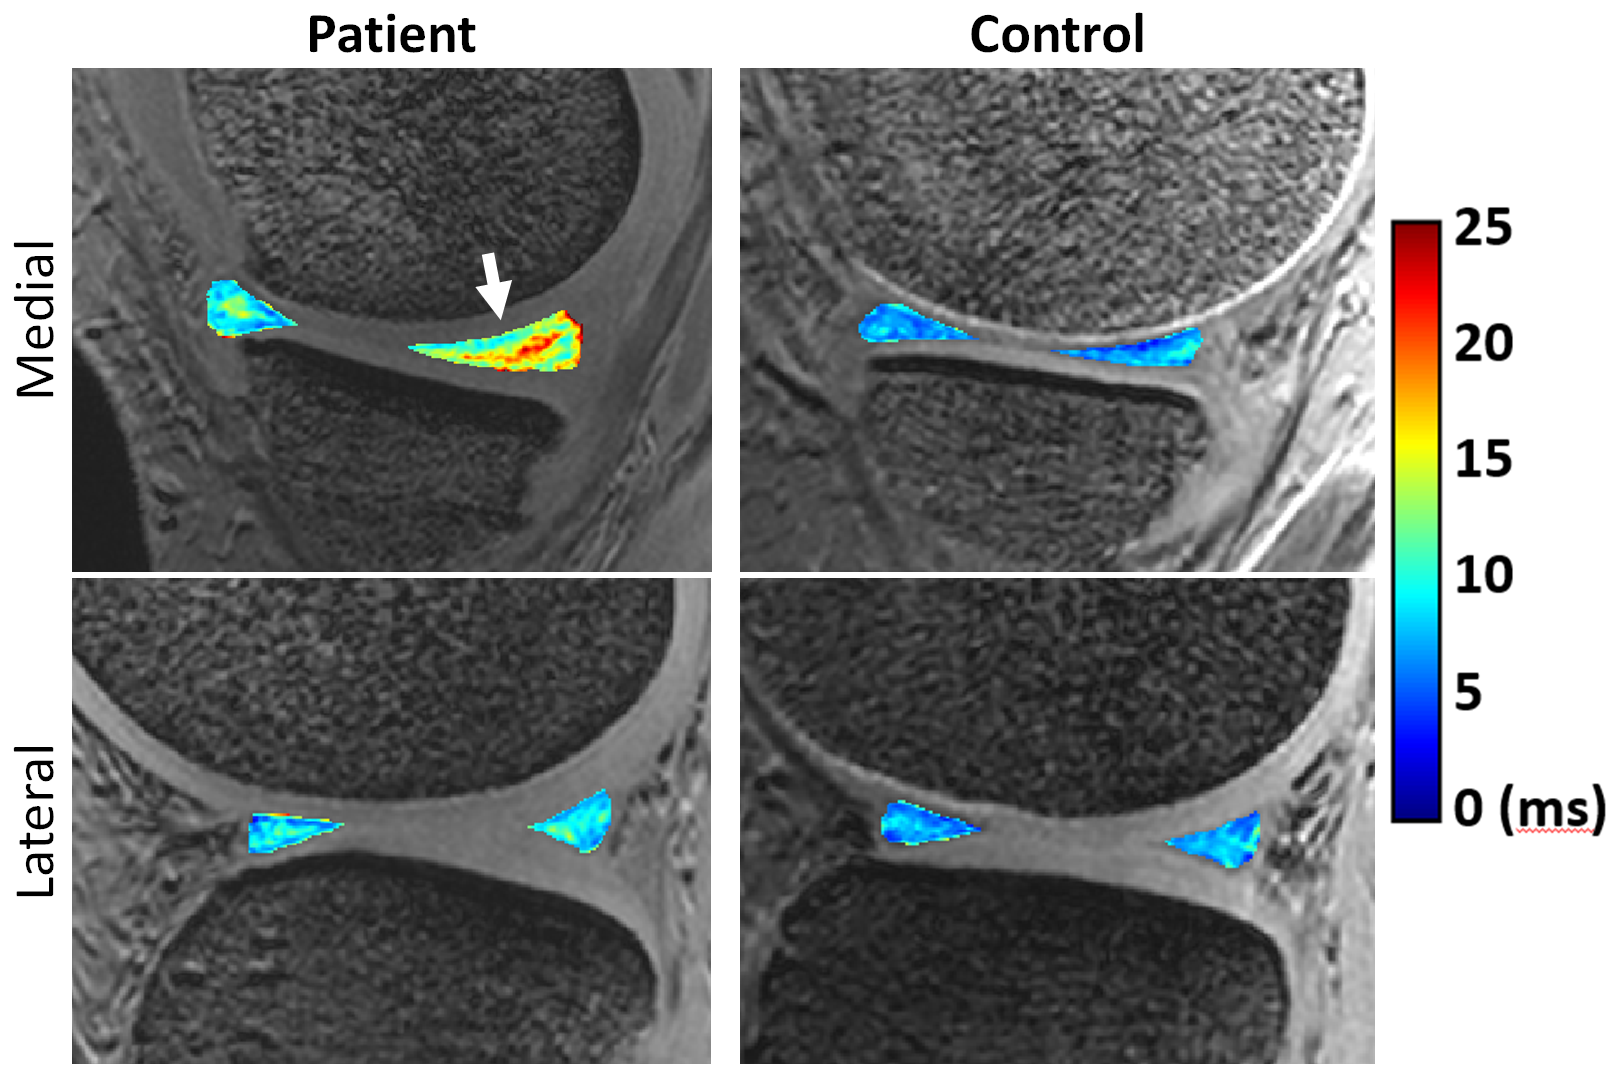
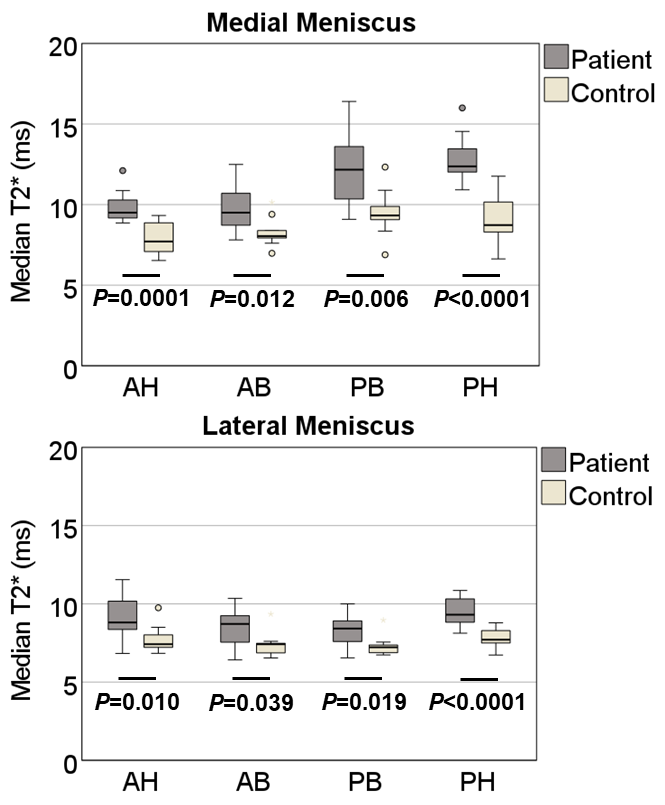
Quantitative 3D evaluation of the medial and lateral menisci was performed in a clinically feasible scan time of approximately 5 min at 7T (Figs. 3-4). Significantly higher T2* were found (p<0.001) in all analyzed meniscal regions of patients with root tears when compared to the corresponding regions in the healthy controls (Fig. 5). The highest T2* values were observed in the posterior horn of medial meniscus adjacent to the root tear (p<0.0001) (Figs. 3-5). All mean normalized RMSE values were lower than 7%, showing a good reliability of the fitted results.Arthroscopy: The medial menisci of all patients had a complete posterior root tear. Based on Pauli grading, six patients had slight to moderate fibrillation at the inner surface, femoral and tibial sides on the medial or lateral menisci. The rest of the menisci surfaces were smooth.
Discussion
Elevated T2* values in the analyzed regions of the patients suggest that degenerative changes extended beyond the areas close to the actual tear and appear to significantly affect T2* in all the compartments of the meniscus. The region closest to the tear in patients was the posterior horn of the medial meniscus, which had the highest T2* values. These results suggest that T2* mapping at 7T is highly sensitive to the degenerative alterations in the meniscus caused by the posterior root tear of medial meniscus. These findings are in line with previous studies reporting increased T2 values in degenerated menisci6-8. The findings are highly significant for patient management, since the success of surgical root repair relies on the presence of healthy tissue in the posterior horn of the meniscus. Suture fixation in highly abnormal tissue might increase the risk of postsurgical failure.Conclusion
In vivo T2* mapping at 7T provides clinically feasible 3D evaluations of meniscus structure providing the necessary resolution to be sensitive to changes in meniscal composition and serve as a quantitative biomarker for the detection of early meniscal degeneration.Acknowledgements
This study was supported by the NIH-NIBIB grant (P41 EB027061).References
1. Floyd ER, Rodriguez AN, Falaas KL, Carlson GB, Chahla J, Geeslin AG, LaPrade RF. The Natural History of Medial Meniscal Root Tears: A Biomechanical and Clinical Case Perspective. Front Bioeng Biotechnol. 2021;9:744065. Epub 2021/10/12. doi: 10.3389/fbioe.2021.744065. PubMed PMID: 34631684; PMCID: PMC8495066.
2. Berthiaume MJ, Raynauld JP, Martel-Pelletier J, Labonte F, Beaudoin G, Bloch DA, Choquette D, Haraoui B, Altman RD, Hochberg M, Meyer JM, Cline GA, Pelletier JP. Meniscal tear and extrusion are strongly associated with progression of symptomatic knee osteoarthritis as assessed by quantitative magnetic resonance imaging. Ann Rheum Dis. 2005;64(4):556-63. Epub 20040916. doi: 10.1136/ard.2004.023796. PubMed PMID: 15374855; PMCID: PMC1755443.
3. Disler DG, Kattapuram SV, Chew FS, Rosenthal DI, Patel D. Meniscal tears of the knee: preliminary comparison of three-dimensional MR reconstruction with two-dimensional MR imaging and arthroscopy. AJR Am J Roentgenol. 1993;160(2):343-5. doi: 10.2214/ajr.160.2.8424347. PubMed PMID: 8424347.
4. Thompson WO, Thaete FL, Fu FH, Dye SF. Tibial meniscal dynamics using three-dimensional reconstruction of magnetic resonance images. Am J Sports Med. 1991;19(3):210-5; discussion 5-6. doi: 10.1177/036354659101900302. PubMed PMID: 1867329.
5. Pauli C, Grogan SP, Patil S, Otsuki S, Hasegawa A, Koziol J, Lotz MK, D'Lima DD. Macroscopic and histopathologic analysis of human knee menisci in aging and osteoarthritis. Osteoarthritis Cartilage. 2011;19(9):1132-41. Epub 2011/06/21. doi: 10.1016/j.joca.2011.05.008. PubMed PMID: 21683797; PMCID: PMC3217905.
6. Son M, Goodman SB, Chen W, Hargreaves BA, Gold GE, Levenston ME. Regional variation in T1rho and T2 times in osteoarthritic human menisci: correlation with mechanical properties and matrix composition. Osteoarthritis Cartilage. 2013;21(6):796-805. Epub 2013/03/19. doi: 10.1016/j.joca.2013.03.002. PubMed PMID: 23499673; PMCID: PMC3909565.
7. Wang A, Pedoia V, Su F, Abramson E, Kretzschmar M, Nardo L, Link TM, McCulloch CE, Jin C, Ma CB, Li X. MR T1rho and T2 of meniscus after acute anterior cruciate ligament injuries. Osteoarthritis Cartilage. 2016;24(4):631-9. Epub 2015/12/02. doi: 10.1016/j.joca.2015.11.012. PubMed PMID: 26620091; PMCID: PMC4799742.
8. Eijgenraam SM, Bovendeert FAT, Verschueren J, van Tiel J, Bastiaansen-Jenniskens YM, Wesdorp MA, Nasserinejad K, Meuffels DE, Guenoun J, Klein S, Reijman M, Oei EHG. T2 mapping of the meniscus is a biomarker for early osteoarthritis. Eur Radiol. 2019;29(10):5664-72. Epub 2019/03/20. doi: 10.1007/s00330-019-06091-1. PubMed PMID: 30888480; PMCID: PMC6719322.
Figures