4376
Increased accuracy in relaxometry estimates through statistical determination of the noise floor
Laurel Hales1, Ananya Goyal1, and Feliks Kogan1
1Radiology, Stanford University, Stanford, CA, United States
1Radiology, Stanford University, Stanford, CA, United States
Synopsis
Keywords: Cartilage, Relaxometry, low SNR
Including data below the noise floor in estimating relaxometry values leads to overestimation. It is possible to identify and remove data below the noise floor by considering the set of voxel data in an ROI at each echo time as a separate but related dataset, and then comparing the data from each echo time statistically. Removing data below the noise floor, reduces error in the estimates of relaxometry values.
Introduction
Quantitative MRI, and in particular, relaxometry methods such as T2, T2*, T1rho mapping, have shown to be a promising measure of cartilage health and a potential early indicator of osteoarthritis (OA) 1,2. Finding these values involves determining the decay constant of an exponential curve. This can be challenging because of the relatively low SNR in cartilage. While the selection of datapoints can have a significant impact on the accuracy of the relaxometry value estimate, there is very little literature about how to select optimal datapoints.Theory
The inclusion of high TE data, where noise is dominant, can lead to an overestimation of T, while the inclusion of only low TE data can decrease the robustness of the data (Figure 1). The value of the maximum TE above the noise floor (TE*) varies with SNR.The noise characteristics of modern MRI data are complex and noise level varies between scanner, hardware, protocol and even patient-to-patient, making it difficult to predict which TE values will result in data above the noise floor. One possible solution is to identify which TE values are below the noise floor after acquisition and not include them in the decay constant estimation.
If one considers the signal value at each voxel in an ROI as a measurement of a random variable, the set of voxel values at each TE are like a separate but related dataset and can be compared statistically. Our proposed method for selecting TE* is based on this idea: datasets with high TE values, will be dominated by noise, and will therefore be statistically similar to other datasets below the noise floor, but statistically different from those above the noise floor.
Methods - Proposed method for selecting Maximum TE
To determine the TEmax (TE*) for each ROI, we used a paired t-test with an $$$\alpha=0.05$$$ and Bonferroni correction of the number of TE values minus 1, to compare voxel data for each TE value, to the voxel data for TEmax. This was repeated for each TE<TEmax. TE* for that ROI was then determined to be the maximum TE value that was less than the first TE value with a null hypothesis.Methods - Simulated Data
We simulated data for 100 ROIs of 300 voxels each. We assumed a mono-exponential model ($$$S=S_0 e^{-TE/T}$$$) with additive bivariate gaussian ($$$\sigma_n=1/SNR$$$). We used an average decay constant of 30 ms, with 1/T varying normally ($$$ \sigma_R=0.1\times 1/T$$$), and an average S0 of 1, varying normally ($$$\sigma_S=0.1$$$). For each voxel, data was generated for 10 randomly selected TE values between 0 and TEmax. We then compared the voxel data for the first 9 TE values for TEmax to determine TE*. This process was repeated for TEmax values of 10, 20, 30, 40, 50, 60, 70, 80, 90, 100, 110, and 120 ms. We used the python polyfit function to estimate T for each voxel, once using all 10 TE values, and one using only the data with TE<TE*. This was repeated with SNR levels of 10, 15, and 25 and with 5 and 15 TE values at an SNR of 15.Methods - in-vivo data
We applied our method to in-vivo data of the Achilles tendon, another low SNR region, acquired with the parameters in figure 3. We used a bi-exponential fit for this data ($$$S=S_{1} e^{-TE/T_{2, short}^{*}}+S_{2} e^{-TE/T_{2,long}^{*}}$$$).Results - simulated data
Figure 4 shows how our method improves the estimate of T for various values of TEmax, SNR and the number of datapoints generated.Results - in-vivo data
Figure 5 demonstrates how the estimate of T2*long varies with TEmax (b) and two examples showing the p-values from the paired t-tests for each of the first 18 TE values (c). We reported only the results for T2*long, as T2*short is not sensitive the choice of TEmax.Discussion
The paired–t test is a relatively simple and rapid test, that adds very little time to a data analysis. The results from the simulated data show that our method seems to be most effective for $$$TEmax>2 \times T$$$ and in low SNR regimes. While, our method overestimates the value of T for high TEmax value, and even though, our method actually uses less datapoints in calculating an estimate of T, the estimate is more accurate because it eliminates datapoints below the noise-floor. Further work is needed to determine the continued cause of this error, and find if it is possible to eliminate it.The In-vivo data had more false negatives (TE values that were erroneously identified as below the noise floor). The occurrences were usually isolated and surrounded by positives. Such a problem could be handled by a more complex algorithm for choosing TE* that considers the possibility of type 1 errors, particularly for small ROIs, or comparing the results across multiple ROIs to find a value of TE* that is consistent. Further work is needed to determine the limits of our proposed method.
Conclusions
Our method leads to consistently lower error in estimates in the decay constant, T, and a more robust estimate for average value of T. It is particularly helpful in low-SNR data with many TE values. Our method shows promise in leading to more reliable measures of relaxometry data, and aiding in creating more robust and repeatable measures of cartilage health.Acknowledgements
This research was funded with grants from GE healthcare and nih R01AR079431 and R21EB030180References
- Lo, J., Chan, L., & Flynn, S. (2021). A systematic review of the incidence, prevalence, costs, and activity and work limitations of amputation, osteoarthritis, rheumatoid arthritis, back pain, multiple sclerosis, spinal cord injury, stroke, and traumatic brain injury in the United States: a 2019 update. Archives of physical medicine and rehabilitation, 102(1), 115-131.
- Eck, B. L., Yang, M., Elias, J. J., Winalski, C. S., Altahawi, F., Subhas, N., & Li, X. (2022). Quantitative MRI for Evaluation of Musculoskeletal Disease: Cartilage and Muscle Composition, Joint Inflammation, and Biomechanics in Osteoarthritis. Investigative Radiology, 10-1097.
Figures
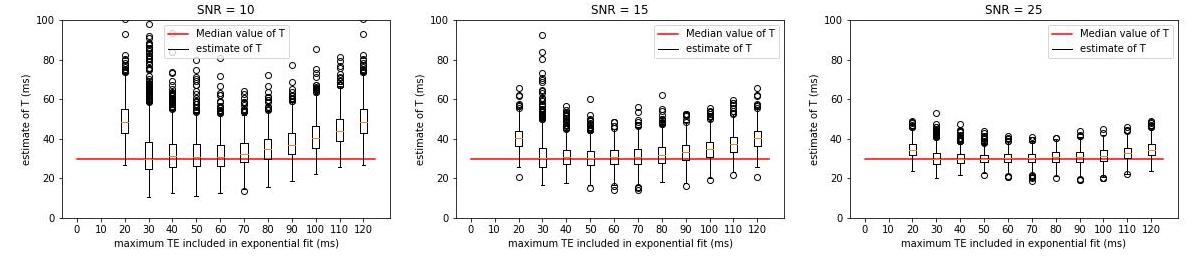
The effect of datapoint selection shown for simulated data with various SNR values. Each estimate of T, was made using 10 TE values between 0 and maximum TE value shown. A high TE max causes and overestimation of T, while a very low maximum TE decreases the robustness of the mono-exponential fit. The value of the maximum TEmax that generates an accurate estimate of T (TE*) varies with SNR
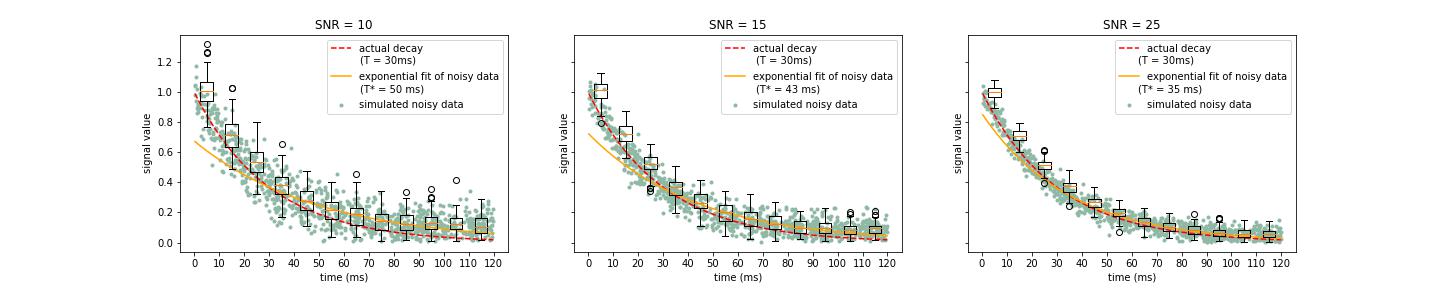
Simulated mono-exponential decay data with three different SNR levels and the associated decay constant estimate. Note how the distribution of data at different timepoints changes from a symmetrically distributed Rician distribution to the non-negative (non-central) Rayleigh distribution in low-signal areas, leading to an overestimation of the decay constant in low signal regimes.
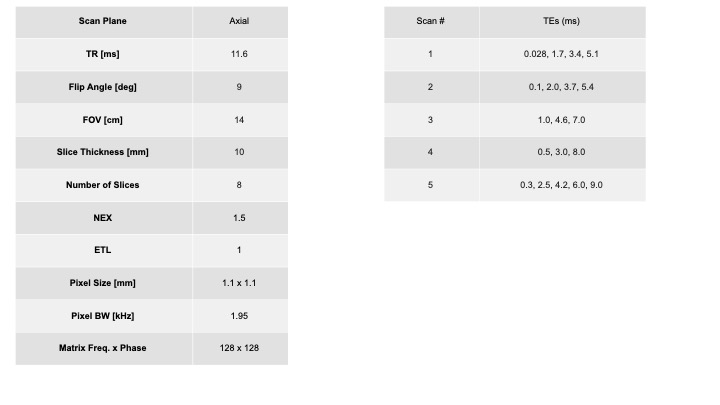
In-vivo data was acquired with a UTE sequence with a cones trajectory in the ankle with the parameters above with a total of 19 different TEs. Data was acquired for 2 participants in 3 positions, and we considered an 2-D ROI of approximately 50 pixels. This data was fit using a bi-exponential model. For simplicity we only included results relating to T2*long (the longer decay constant), because T2*short is not sensitive to changes in TEmax.
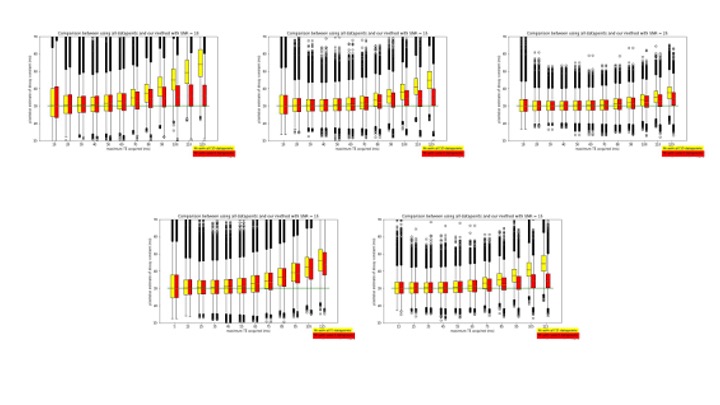
The top row shows the voxel-wise estimates for T using all 10 TE values (yellow), compared with T estimates using only TE<TE* (red), for various TEmax values with SNR of 10, 15, and 25. The bottom row shows the same comparison using 5 and 15 TE values for each voxel with an SNR of 15.
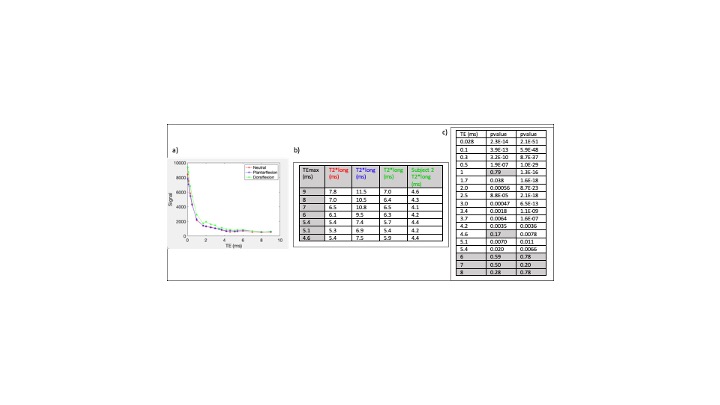
a) a plot of the in-vivo signal vs TE. b) a demonstration of how the average estimate for T2*long varies with choice of TEmax. c) two examples of the performance of our method at determining statistically significant differences between the ROI datasets. Any tests that fail to disprove the null-hypotheses and not different from the TE=9ms dataset, are highlighted in grey.
DOI: https://doi.org/10.58530/2023/4376