4375
CRLB minimization for optimal Multi Spin-Echo T2-mapping of the cartilage using dictionary-based estimation1nstitute for Systems and Robotics - Lisboa and Department of Bioengineering, Instituto Superior Técn, Lisboa, Portugal, 2Accessible Magnetic Resonance Laboratory, Biomedical Imaging and Engineering Institute, Department of Diagnostic, Molecular and Interventional Radiology, Icahn School of Medicine at Mount Sinai, New York, NY, United States, New York, NY, United States, 3Institute for Systems and Robotics - Lisboa and Department of Bioengineering, Instituto Superior Técnico – Universidade de Lisboa, Lisbon, Portugal, Lisboa, Portugal
Synopsis
Keywords: Cartilage, Quantitative Imaging
.We compared Cramer-Rao Lower Bounds of Multi Spin-Echo sequences’ derived T2 values using a dictionary approach for musculoskeletal relaxometry. The refocusing flip angle, inter-echo spacing and echoe number were varied, constraining the B1+rms to 5μT and the exam time to 9 minutes, keeping TR to a minimum. Designed sequences were tested in NIST/ISMRM phantom and ex vivo, and compared against the vendor’s MSE. A repeatability study was performed during 5 days. An optimized sequence with target T2 value (45ms), representative of the cartilage, scored below 10% for Within-case Coefficient of Variation in 9 out of 14 vials.Introduction
T2 is a promising MRI biomarker, with applications including detection of early cartilage degeneration [1]. Fitting a mono-exponential model to multi spin-echo (MSE) measurements is typical for clinical T2-mapping. However, as the signal deviates from this model due to echoes caused by unwanted pathways, dictionary-based estimation approaches were proposed [2]. A dictionary of echo modulation curves (EMC) is predicted using the Extended Phase Graphs (EPG) formalism [3], considering all acquisition parameters and a range of expected tissue parameters (T1 and T2); mapping consists of finding the best match to the measured signal. We proposed an MSE pulse sequence optimization for dictionary-based cartilage T2-mapping, following up on promising results in the knee and hip cartilages[2]. We aim to determine the best combination of refocusing flip angle (kept constant), inter-echo spacing (dTE) and total number of echoes (ETL - echo train length).Methods
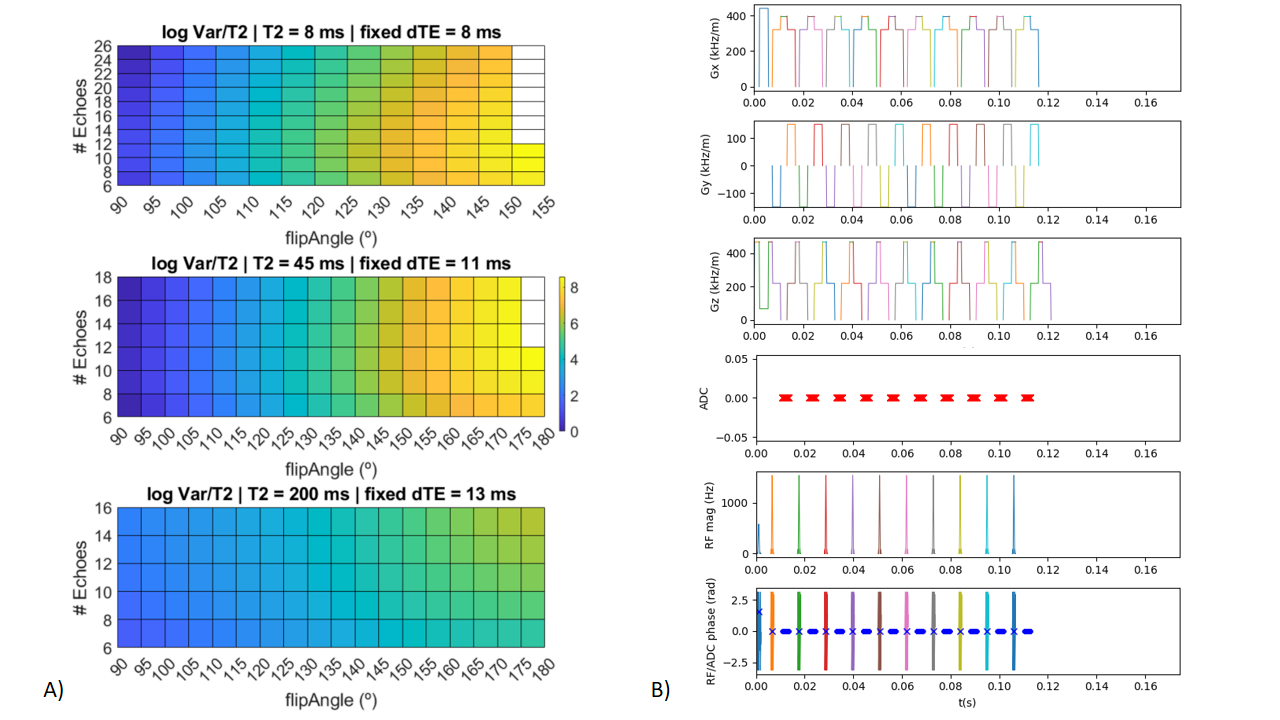
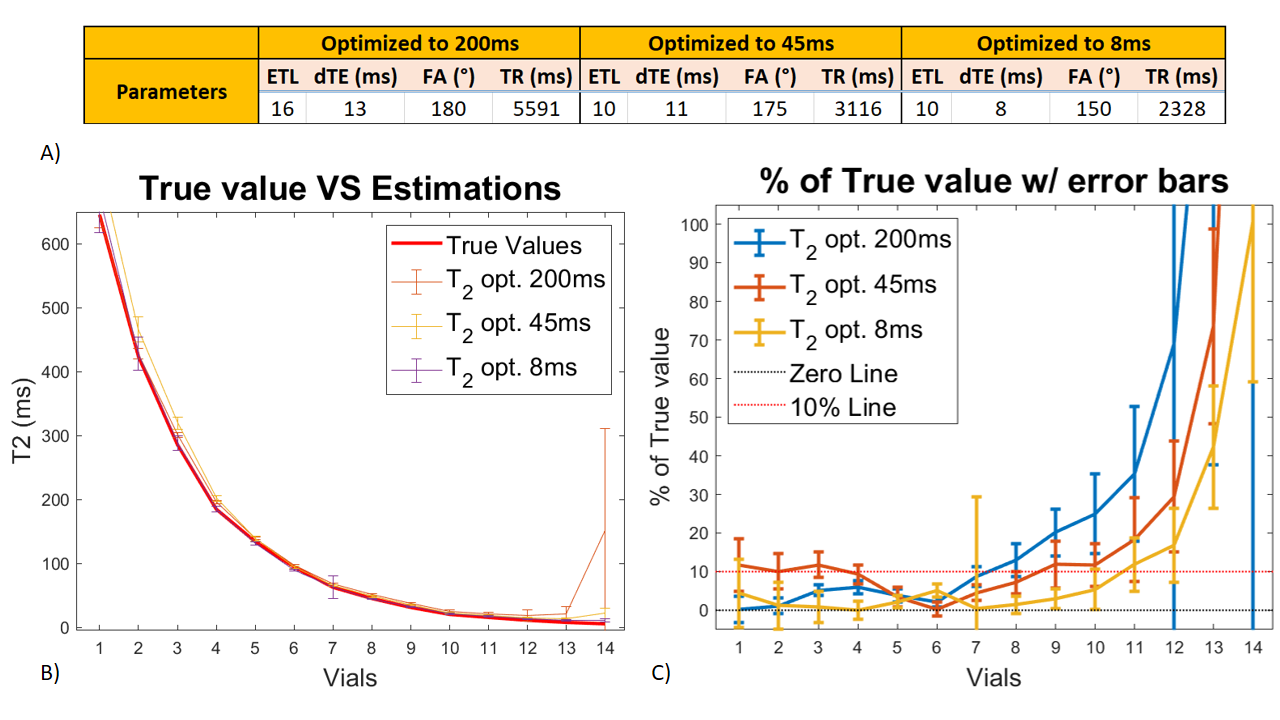
The Cramer-Rao Lower Bound (CRLB) metric is widely used when designing parameter estimation experiments [4]. Two factors limiting MSE applicability are specific absorption rate (SAR) constraints and total scan duration [2]. We took them into account by limiting the search space to sequences with an average transmit field B1+rms (square-root of the mean RF power per time unit) lower than 5μT (proxi to comply with safety limts), and considering a maximum sequence duration of 9 minutes with minimum feasible TR. The CRLB was weighted by the scan duration to account for the impact of the repetition number on the variance. We considered two T2 values representative of short (8ms), mid-range (45ms) and edema components found in knee cartilage (200ms), T1=1000ms, an image signal-to-noise (SNR) ratio of 40 (for the shortest TE), dTE=8:1:30ms, ETL=6:2:30, refocusing flip angles 90º:5:180º, 30 slices and 256 phase encode lines. We computed CRLB values using the parameter combinations obeying the acquisition constraints, using echo modulation curves (EMC) and their analytical derivatives - Fig.1.To illustrate the impact of optimization, three open-source MSE sequences (T2me MSE) optimized for each target T2 value were tested in a NIST phantom, with GRAPPA (af=2) on a Siemens 3T Skyra using pypulseq [5] with the following parameters (FOV=256mm, matrix size=256x256, slice thickness=5mm). Data was processed in Python and Matlab and T2-mapping carried out using EMC matching. Vial masks were manually drawn, and the mean signal values and standard deviation calculated - Fig. 2.Repeatability was tested over 5 days with three exams a day. The phantom was placed in the scanner room to minimize temperature variations. T2me MSE targeting 45ms, with the following parameters: TR=3116ms, TE=11ms, ETL=10, FA=175º (7min16s) was benchmarked against Siemens’ MSE T2 mapping sequence (6m45s) with the same parameters(vMSE). Vendor software performed the mapping for vMSE data. An ex vivo experiment on the porcine muscle and bone was also performed. We measured repeatability with the within-case coefficient of variation (wCV) and repeatability coefficient (RC) [6]. No data preprocessing steps were applied.The code is available at https://github.com/Laseeb/CRLB_T2MSE_EMCopt .Results
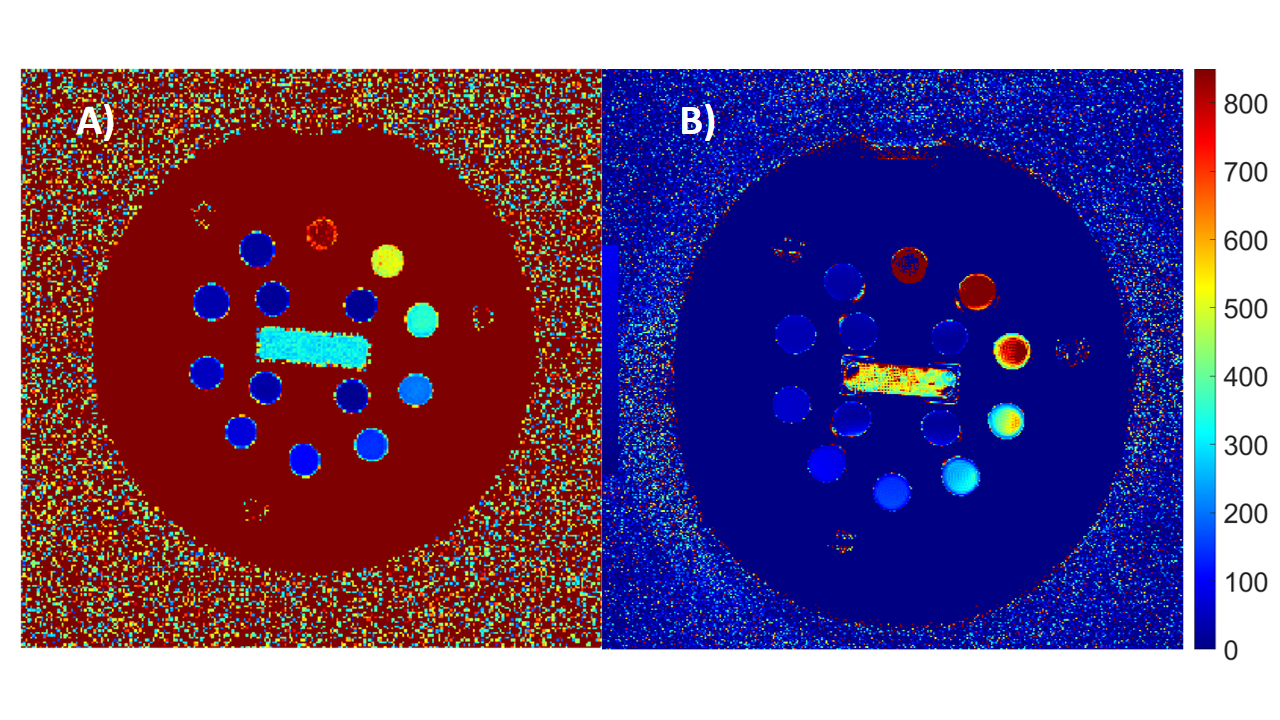
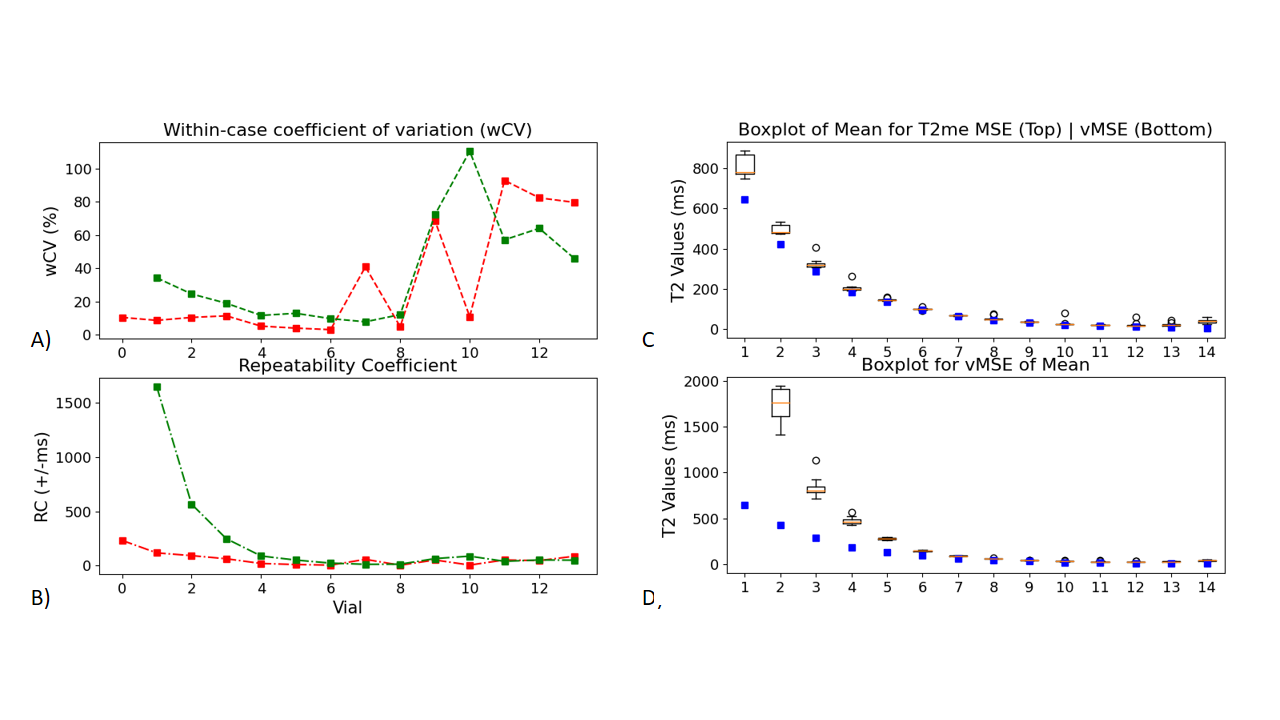
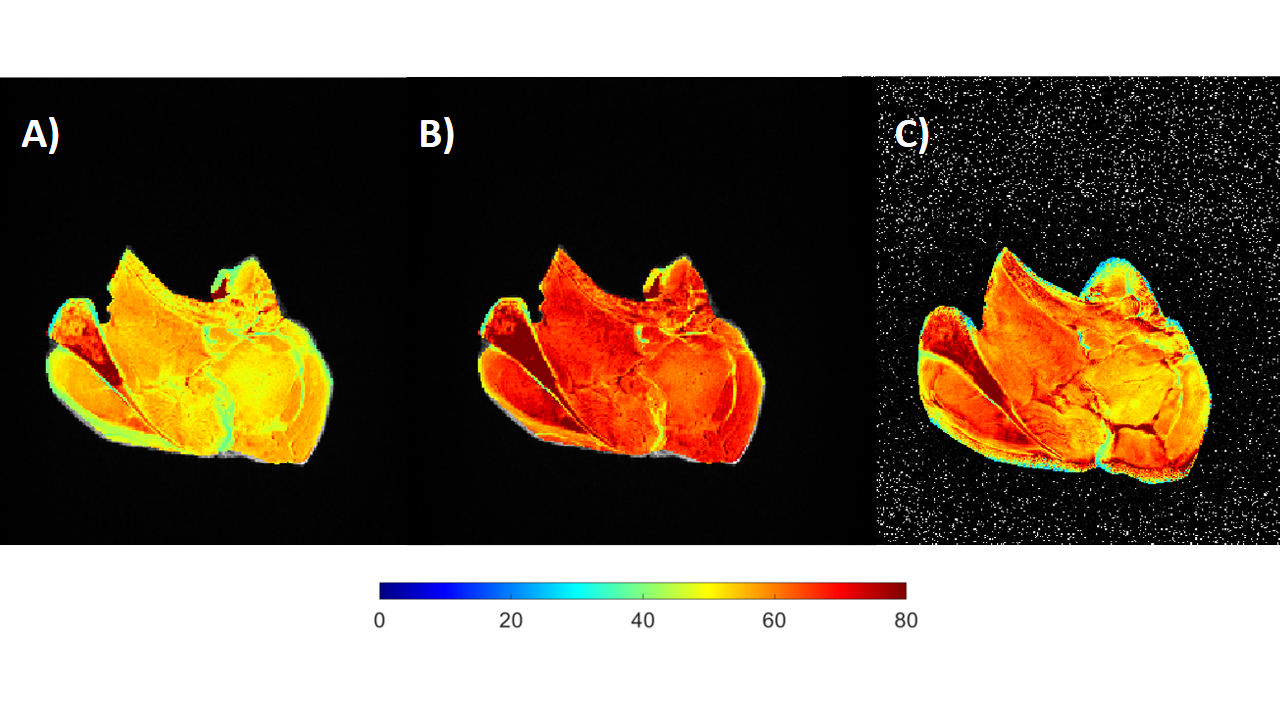
Fig.1 depicts CRLB application to our problem. Figure 2 a) depicts the measured NIST T2 values, and B) that by optimizing for different T2 values, accuracy can be improved. For most short T2, the optimization for 8ms overcomes its opponents but not for all the vials. Visual T2 maps obtained using T2me MSE(45) in the repeatability study are depicted in Fig.3 for T2me MSE and vMSE.Boxplot of the distribution of T2 values and standard-deviations per vial can be seen in Fig.4. These depict the tendency of failing to match theoretical T2 values as they decrease. It is clear that exponential fit leas to overestimation as expected. Fig.3 C) depicts wCV lower for T2me MSE than vMSE, they are lower than 10% for the majority of values higher than low T2 = 20ms. Regarding RC, it tends to increase with increased T2. ROI size varied, in order to try to control for partial volume effects.Ex vivo T2 maps are depicted in Fig.4. The values are in accordance with the previous findings, showing lower T2 values for T2me MSE.Discussion
Previous works have dealt with MSE optimization for EMC-based T2 mapping in brain [6]. An important difference is that we considered variations in dTE and ETL while accounting for their impact in the acquisition time and targeted a different application (knee articular cartilage).Based on wCV, our results show that an open-source with dictionary matching tool is able to outperform the vMSE mapping pipeline. We observe bigger variations for lower T2 values, probably due to the selected minimum TE and embedded noise present in the measurements, meaning that the dictionary overestimates the results probably because the SNR considered in the CRLB optimization was too optimistic. A possible solution is to filter data before using the dictionary. Another possibility is to apply Deep Learning approaches to match data with the dictionary considering an expected noise level [6-7].Conclusion
It was possible to optimize MSE sequences for dictionary-based T2 mapping of the cartilage through CRLB calculation. Future work will involve in vivo validation.Acknowledgements
This work was supported by Fundação para a Ciência e a Tecnologia (FCT) - (grants SFRH/BD/120006/2016, 2020.05080.BD, PTDC/EMD-EMD/29686/2017) and Programa Operacional Regional de Lisboa 2020 (LISBOA-01-0145-FEDER-029686). Program also sponsored by FLAD CON2/CAN8 & Fulbright Program.References
1. Prasad AP, Nardo L, Schooler J, Joseph GB, Link TM. T1ρ and T2 relaxation times predict progression of knee osteoarthritis. Osteoarthritis and Cartilage. 2013. pp. 69–76. doi:10.1016/j.joca.2012.09.011
2. Dula AN, Gochberg DF, Does MD. Optimal echo spacing for multi-echo imaging measurements of Bi-exponential T2 relaxation. J Magn Reson. 2009;196: 149–156.
3. M. Weigel, “Extended phase graphs: Dephasing, RF pulses, and echoes - Pure andsimple,” J. Magn. Reson. Imaging, vol. 41, no. 2, pp. 266–295, 2015.
4. Keerthivasan MB, Saranathan M, Johnson K, Fu Z, Weinkauf CC, Martin DR, et al. An efficient 3D stack-of-stars turbo spin echo pulse sequence for simultaneous T2-weighted imaging and T2 mapping. Magn Reson Med. 2019;82: 326–341.
5. Ravi, Keerthi, Sairam Geethanath, and John Vaughan. "PyPulseq: A Python Package for MRI Pulse Sequence Design." Journal of Open Source Software 4.42 (2019): 1725.
6 Qian, E. et al. (2022) ‘Tailored magnetic resonance fingerprinting for simultaneous non-synthetic and quantitative imaging: A repeatability study’, Medical physics, 49(3), pp. 1673–1685
7. Shridhar Konar A, Qian E, Geethanath S, Buonincontri G, Obuchowski NA, Fung M, Gomez P, Schulte R, Cencini M, Tosetti M, Schwartz LH, Shukla-Dave A. Quantitative imaging metrics derived from magnetic resonance fingerprinting using ISMRM/NIST MRI system phantom: An international multicenter repeatability and reproducibility study. Med Phys. 2021 May;48(5):2438-2447. doi: 10.1002/mp.14833. Epub 2021 Apr 1. PMID: 33690905; PMCID: PMC9284672.
Figures