4374
Evaluation of the effect on quantitative ultrashort echo time (UTE) biomarkers with cartilage dehydration and rehydration1Radiology, Tenth People's Hospital of Tongji University, Shanghai, China, 2Radiology, University of California, San Diego, San Diego, CA, United States, 3Radiology, VA San Diego Healthcare System, San Diego, CA, United States
Synopsis
Keywords: Cartilage, Quantitative Imaging
Ex vivo and cadaveric articular cartilage samples often undergo freeze and thaw cycles and sample preparation in air. These procedures will result in cartilage dehydration and degradation, which may affect the results of UTE-biomarkers. This study was aimed to evaluate the effect of cartilage dehydration and rehydration on UTE-biomarkers and to compare the rehydration capability of synovial fluid and normal saline. Cartilage dehydration resulted in significant changes in all evaluated UTE-biomarkers. Rehydrating with normal saline had non-significant effect on UTE-biomarkers while synovial fluid resulted in significant changes for MMF and T2*. Rehydrating with normal saline is better than synovial fluid.Introduction
Ex vivo and cadaveric hyaline articular cartilage samples are commonly used in magnetic resonance imaging (MRI) research to study osteoarthritis and related joint diseases. Use of these samples facilitates destructive and invasive testing that may otherwise be prohibitive. However, for accurate correlation of results obtained from these samples with in vivo scenarios, a thorough understanding of how tissue handling and preparation affects quantitative measures of interest is mandatory [1, 2]. It is widely accepted that the optimal condition of cartilage samples is immediately after harvesting from a living host with extreme care to avoid dehydration. In reality this is often not possible, and even after a few minutes of dehydration in room air, measurable changes in cartilage thickness are present [3]. To our knowledge, changes in cartilage subject to dehydration and rehydration have not been systematically studied. Researchers may be unaware of the amount of dehydration that has occurred in their sample.Recent years, a series of quantitative UTE MRI techniques have been developed to evaluate cartilage properties, including T1 [4], AdiabT1ρ [5-7], macromolecular fraction (MMF) [8], magnetic transfer ratio (MTR) [9] and T2* [10]. The current study was aimed to evaluate the effect of cartilage dehydration and rehydration on these quantitative UTE-biomarkers and to investigate which kind of solution can help rehydrate the cartilage with minor effect on biomarker measurements using results from fresh cartilage samples as reference standard.
Methods
Sample preparation: 37 osteochondral cores were harvested from patients who underwent total knee replacement, and the osseous components were removed using a scalpel. The whole process was done within 30 minutes with a humidifier to prevent samples from dehydration. Fresh cartilage cores were weighted before baseline MR scan. Native synovial fluid was collected during surgery.MR sequences: All imaging was performed on a 3T clinical MRI scanner (MR750, GE Healthcare Technologies, Milwaukee, WI, USA) using a homemade 30 ml birdcage coil. The following four imaging protocols were performed: A) 3D UTE-Cones magnetization transfer (3D UTE-Cones-MT) with three saturation pulse powers (θ = 400°, 600°, and 800°) and five frequency offsets (Δf = 2, 5, 10, 20, and 50 kHz) [11]; B) 3D UTE-cones with actual flip angle imaging and variable flip angles (3D UTE-Cones AFI-VFA) with flip angles (FA) of 5°, 10°, 20°, and 30°, and a TR of 20 ms [4, 12]; C) 3D UTE-Cones with adiabatic T1ρ preparation (3D UTE-Cones-AdiabT1ρ) with spin-locking time (TSL) of 0, 12, 24, 36, 48, 72, and 96 ms [5]; D) 3D UTE-T2* with TEs of 0.032, 4.1, 8.1, 12.1, 16.1, and 32 ms. Other imaging parameters included: FOV = 5 cm, matrix=160×160, slice thickness=0.5mm, 60 slices. The total scan time was 78 min.
Dehydration and rehydration process: After MR imaging, samples were put in air for 2 hours to dehydrate. Weights were recorded before and after dehydration. Samples were sub-grouped into two groups with one soaking in synovial fluid and the other soaking in normal saline to rehydrate. After 4 hours rehydration, samples were taken out from solutions and wipe out the surface using Kimwipe. Weights were recorded before and after rehydration. MR scanning were performed after dehydration and rehydration using the same imaging protocols mentioned above.
Data analysis: Three consecutive slices at the center of each wafer were used for global region of interest (ROI) analysis. T1, AdiabT1ρ, MMF, MTR and T2* values were calculated for cartilage samples, at fresh, dehydrate and rehydrate time points. Two-sided paired t test, liner regression and Bland-Altman analysis were used for statistical analysis.
Results
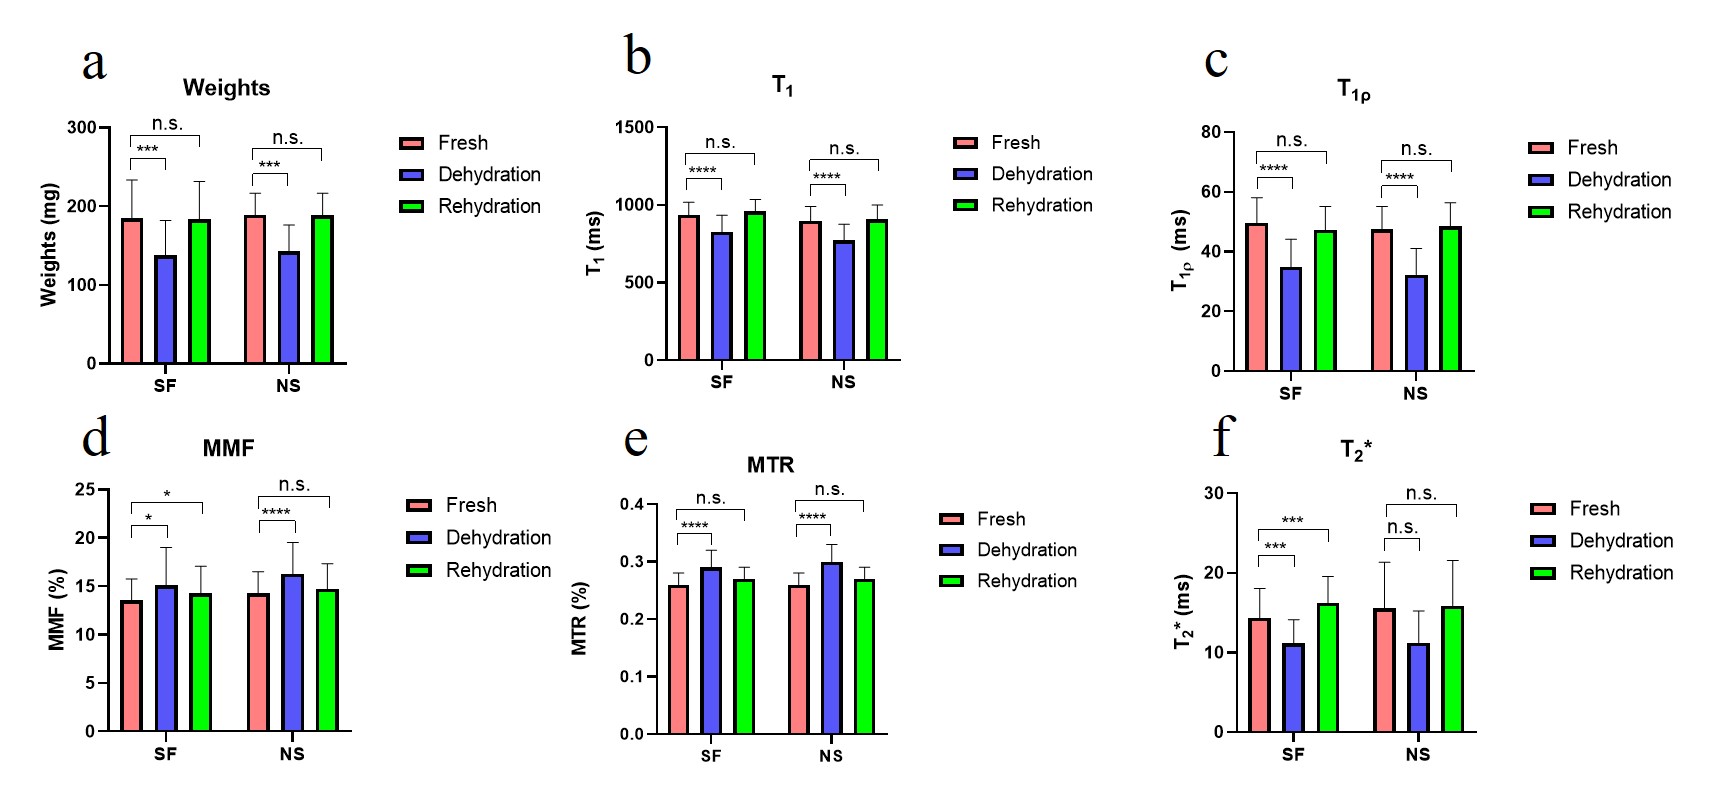
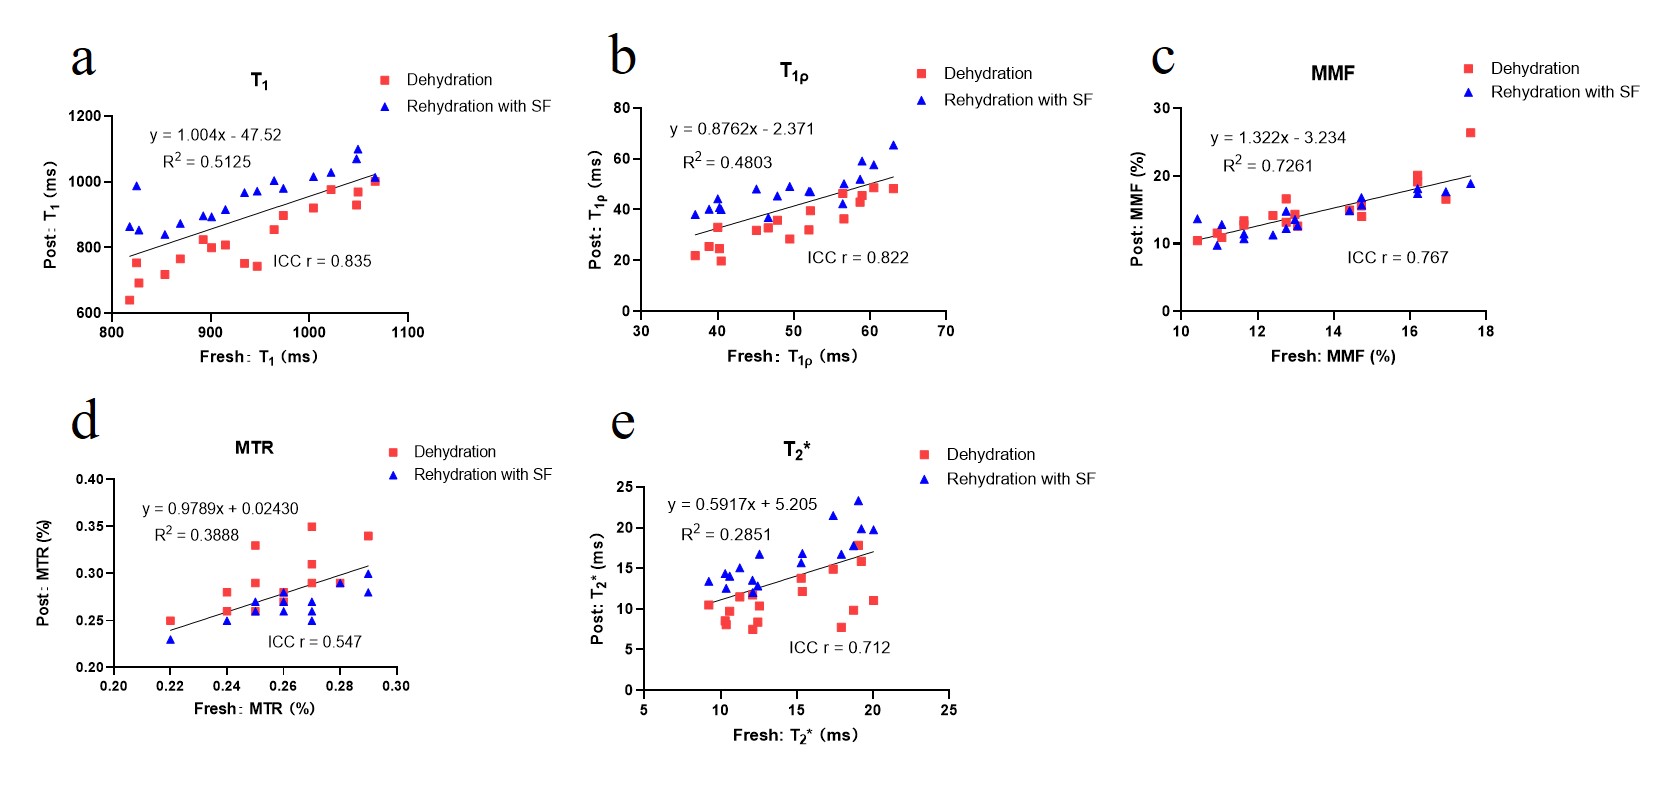
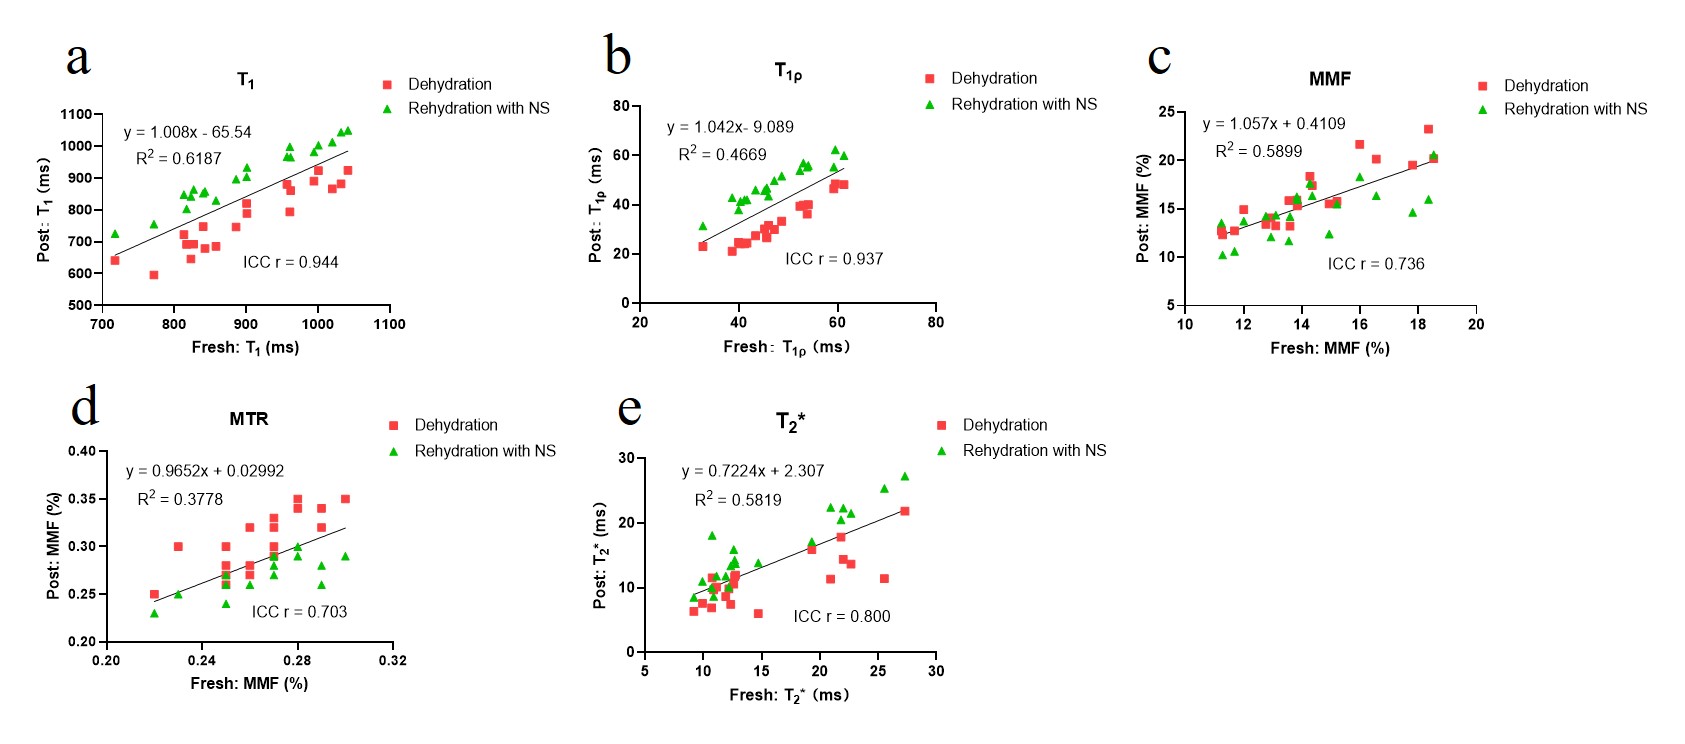
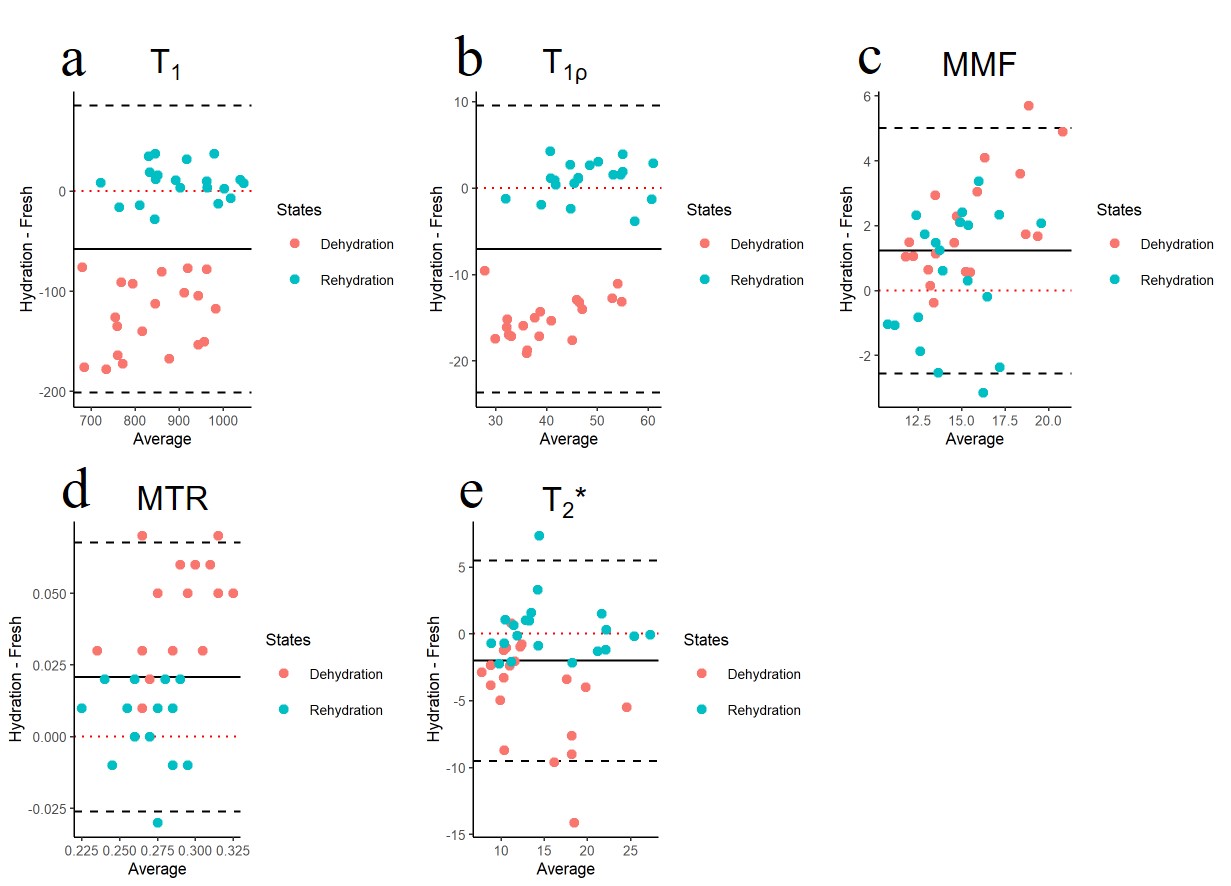
Figure 1 shows significant weight loss after dehydration in air for 2 hours. Both synovial fluid and normal saline can bring weights back to normal after immersing for 4 hours (all P>0.05). Cartilage dehydration will have significant effects on the quantitative results of UTE-biomarkers.Figure 2 and 3 suggests that stronger agreement of UTE-biomarkers in cartilage samples of normal saline group than that of synovial fluid group.
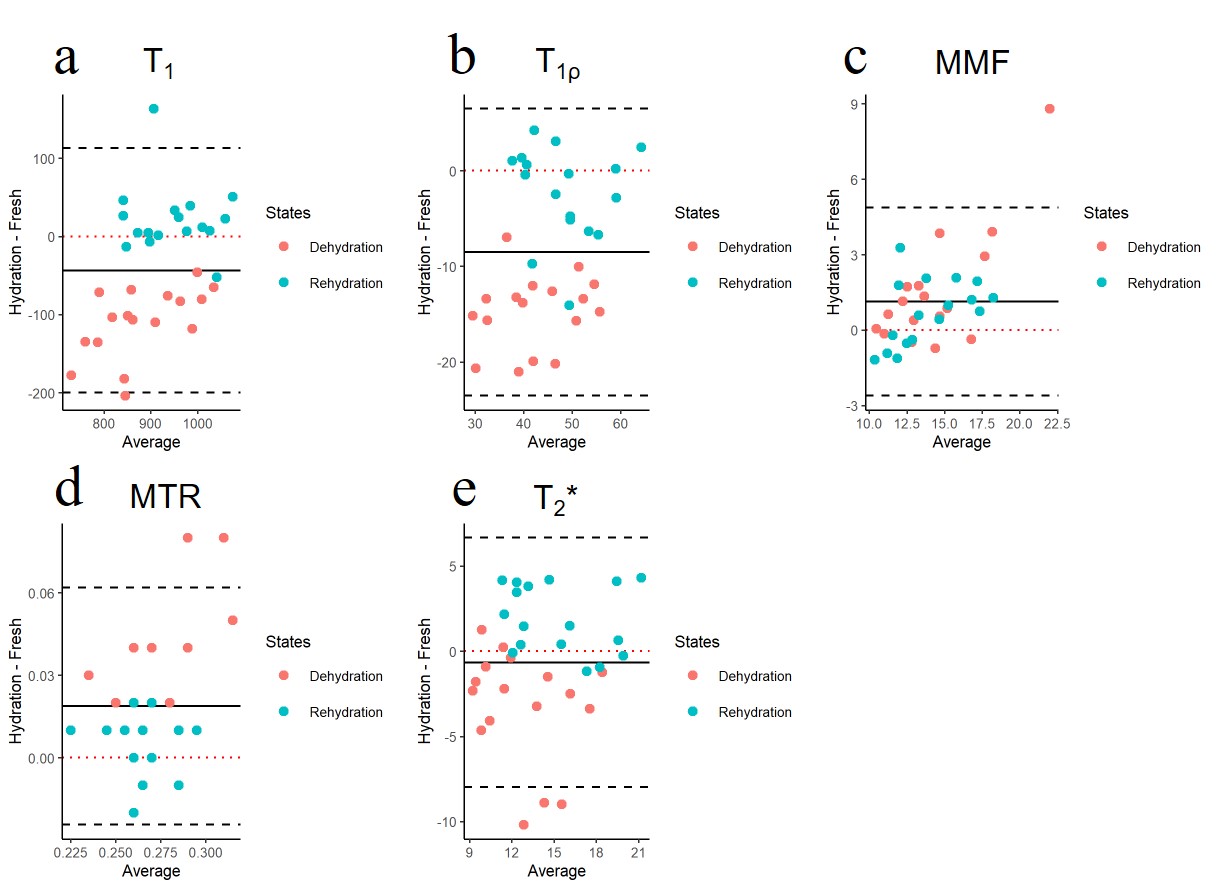
Figure 4 and 5 suggests that high reproducibility of UTE-biomarkers after dehydration and rehydration process and cartilage samples of normal saline group with relatively higher reproducibility than samples of synovial fluid group.
Discussion
Both synovial fluid and normal saline brought weights of cartilage back to normal without swelling, which is consistent with a previous study that the mass of 40%-dehydrated cartilage appeared to be steady after 5 hours placed in normal saline [13]. Cartilage dehydration result in significant decrease of T1, T1ρ, and T2* values while increase of MMF and MTR values. One possible explanation for this is that the cartilage moisture loss during dehydration process result in a relative increase in PG and collagen content.Stronger agreement and higher reproducibility of UTE-biomarker measurements between fresh samples and samples rehydrated with normal saline were observed than samples rehydrated with synovial fluid. The most likely reason for this is that cartilage dehydration is mainly a loss of water without change in internal structure [2]. Normal saline contains more water than synovial fluid. Hence, in the case of cartilage dehydration, it’s better to rehydrate with normal saline.
Conclusion
Cartilage dehydration will have significant effects on the quantitative results of UTE-biomarkers. Rehydrating with normal saline is better than synovial fluid.Acknowledgements
The authors acknowledge grant support from the National Institutes of Health (R01AR062581, R01AR068987, R01AR075825, R01AR079484, RF1AG075717 and R21AR075851), VA Clinical Science and Rehabilitation Research and Development Services (Merit Awards I01CX001388, I01CX002211, and I01RX002604), GE Healthcare, and Science and Technology Innovation Action Plan of STCS (22YF1434000).References
1. Fishbein, K.W., et al., Optimal methods for the preservation of cartilage samples in MRI and correlative biochemical studies. Magn Reson Med, 2007. 57(5): p. 866-73.
2. Zheng, S., et al., Damages to the extracellular matrix in articular cartilage due to cryopreservation by microscopic magnetic resonance imaging and biochemistry. Magn Reson Imaging, 2009. 27(5): p. 648-55.
3. Pham, A. and M.L. Hull, Dehydration rates of meniscus and articular cartilage in vitro using a fast and accurate laser-based coordinate digitizing system. J Biomech, 2007. 40(14): p. 3223-9.
4. Ma, Y.J., et al., Whole knee joint T1 values measured in vivo at 3T by combined 3D ultrashort echo time cones actual flip angle and variable flip angle methods. Magn Reson Med, 2019. 81(3): p. 1634-1644.
5. Ma, Y.J., et al., 3D adiabatic T1ρ prepared ultrashort echo time cones sequence for whole knee imaging. Magn Reson Med, 2018. 80(4): p. 1429-1439.
6. Wan, L., et al., Evaluation of enzymatic proteoglycan loss and collagen degradation in human articular cartilage using ultrashort echo time-based biomarkers: A feasibility study. NMR Biomed, 2022. 35(5): p. e4664.
7. Wu, M., et al., Quantitative assessment of articular cartilage degeneration using 3D ultrashort echo time cones adiabatic T1ρ (3D UTE-Cones-AdiabT1ρ) imaging. Eur Radiol, 2022. 32(9): p. 6178-6186.
8. Xue, Y.P., et al., Quantitative 3D Ultrashort Echo Time Magnetization Transfer Imaging for Evaluation of Knee Cartilage Degeneration In Vivo. J Magn Reson Imaging, 2021. 54(4): p. 1294-1302.
9. Wan, L., et al., Fast quantitative three-dimensional ultrashort echo time (UTE) Cones magnetic resonance imaging of major tissues in the knee joint using extended sprial sampling. NMR Biomed, 2020. 33(10): p. e4376.
10. Chu, C.R., et al., Quantitative Magnetic Resonance Imaging UTE-T2* Mapping of Cartilage and Meniscus Healing After Anatomic Anterior Cruciate Ligament Reconstruction. Am J Sports Med, 2014. 42(8): p. 1847-56.
11. Ma, Y.J., et al., Quantitative magnetization transfer ultrashort echo time imaging using a time-efficient 3D multispoke Cones sequence. Magn Reson Med, 2018. 79(2): p. 692-700.
12. Ma, Y.J., et al., Accurate T1 mapping of short T2 tissues using a three-dimensional ultrashort echo time cones actual flip angle imaging-variable repetition time (3D UTE-Cones AFI-VTR) method. Magn Reson Med, 2018. 80(2): p. 598-608.
13. Meyer, J.P., K.E. McAvoy, and J. Jiang, Rehydration capacities and rates for various porcine tissues after dehydration. PLoS One, 2013. 8(9): p. e72573.
Figures