4373
Evaluating the relationship of proximal femoral bone shape asymmetry with cartilage health and biomechanics in patients with hip OA1Radiology and Biomedical Imaging, University of California San Francisco, San Francisco, CA, United States, 2Department of Physical Therapy and Rehabilitation Science, University of California San Francisco, San Francisco, CA, United States
Synopsis
Keywords: Bone, Osteoarthritis
This current study evaluated the role of bone shape asymmetry with other biomarkers of hip OA such as T1rho/T2 relaxation time and gait biomechanics data. We observed similar relationship trend in higher bone asymmetry values in the AMS region correlates with lesser number of repetitions performed 30s chair rise test, validating the common understanding of performance. This is one of the first feasibility studies to be explored which conveys the potential of bone asymmetry to be considered as a strong biomarker for understanding hip OAIntroduction
Hip Osteoarthritis (OA) is a highly prevalent joint disease in the United States1, degenerative in nature and associated primary with cartilage loss and irreversible damage to the joint. It has been reported earlier that the proximal femoral 3D bone shape modes were associated with biochemical and morphological changes of articular cartilage2. Biochemical (T1rho/T2) and and biomechanical characteristics of hip OA progression were reported to be correlated in previous works3. The aim of the current study was to investigate the shape asymmetry of the proximal femoral bone shape and explore the associations with the biochemical changes of cartilage as well as gait biomechanics in hip OA subjects.Methods
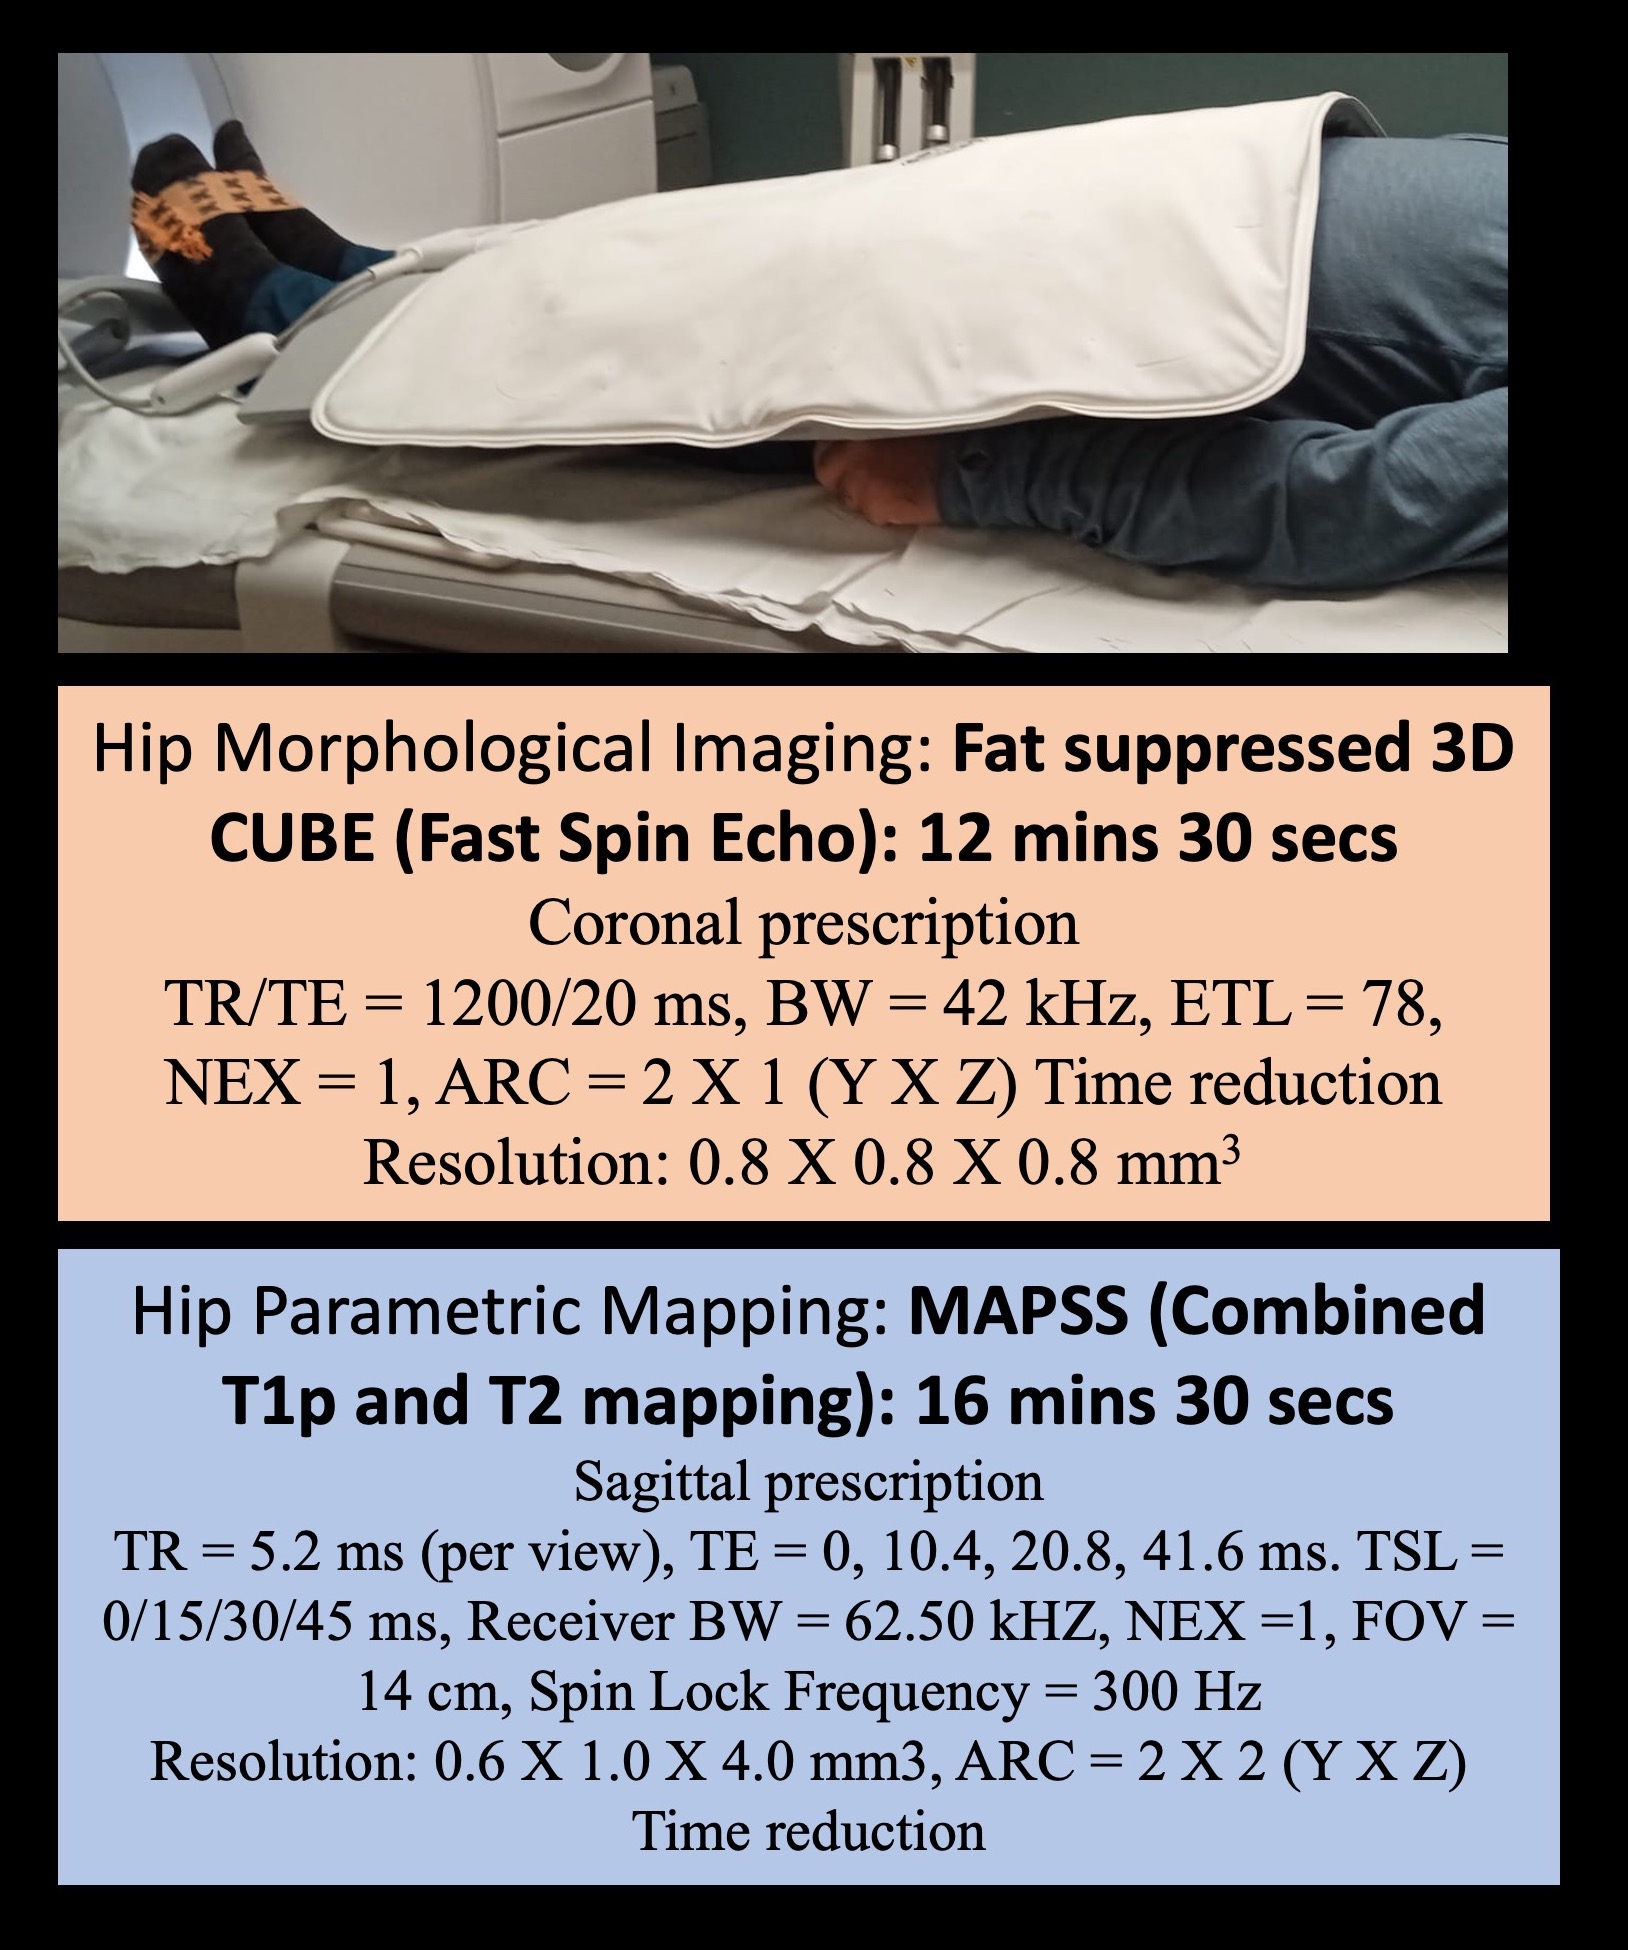
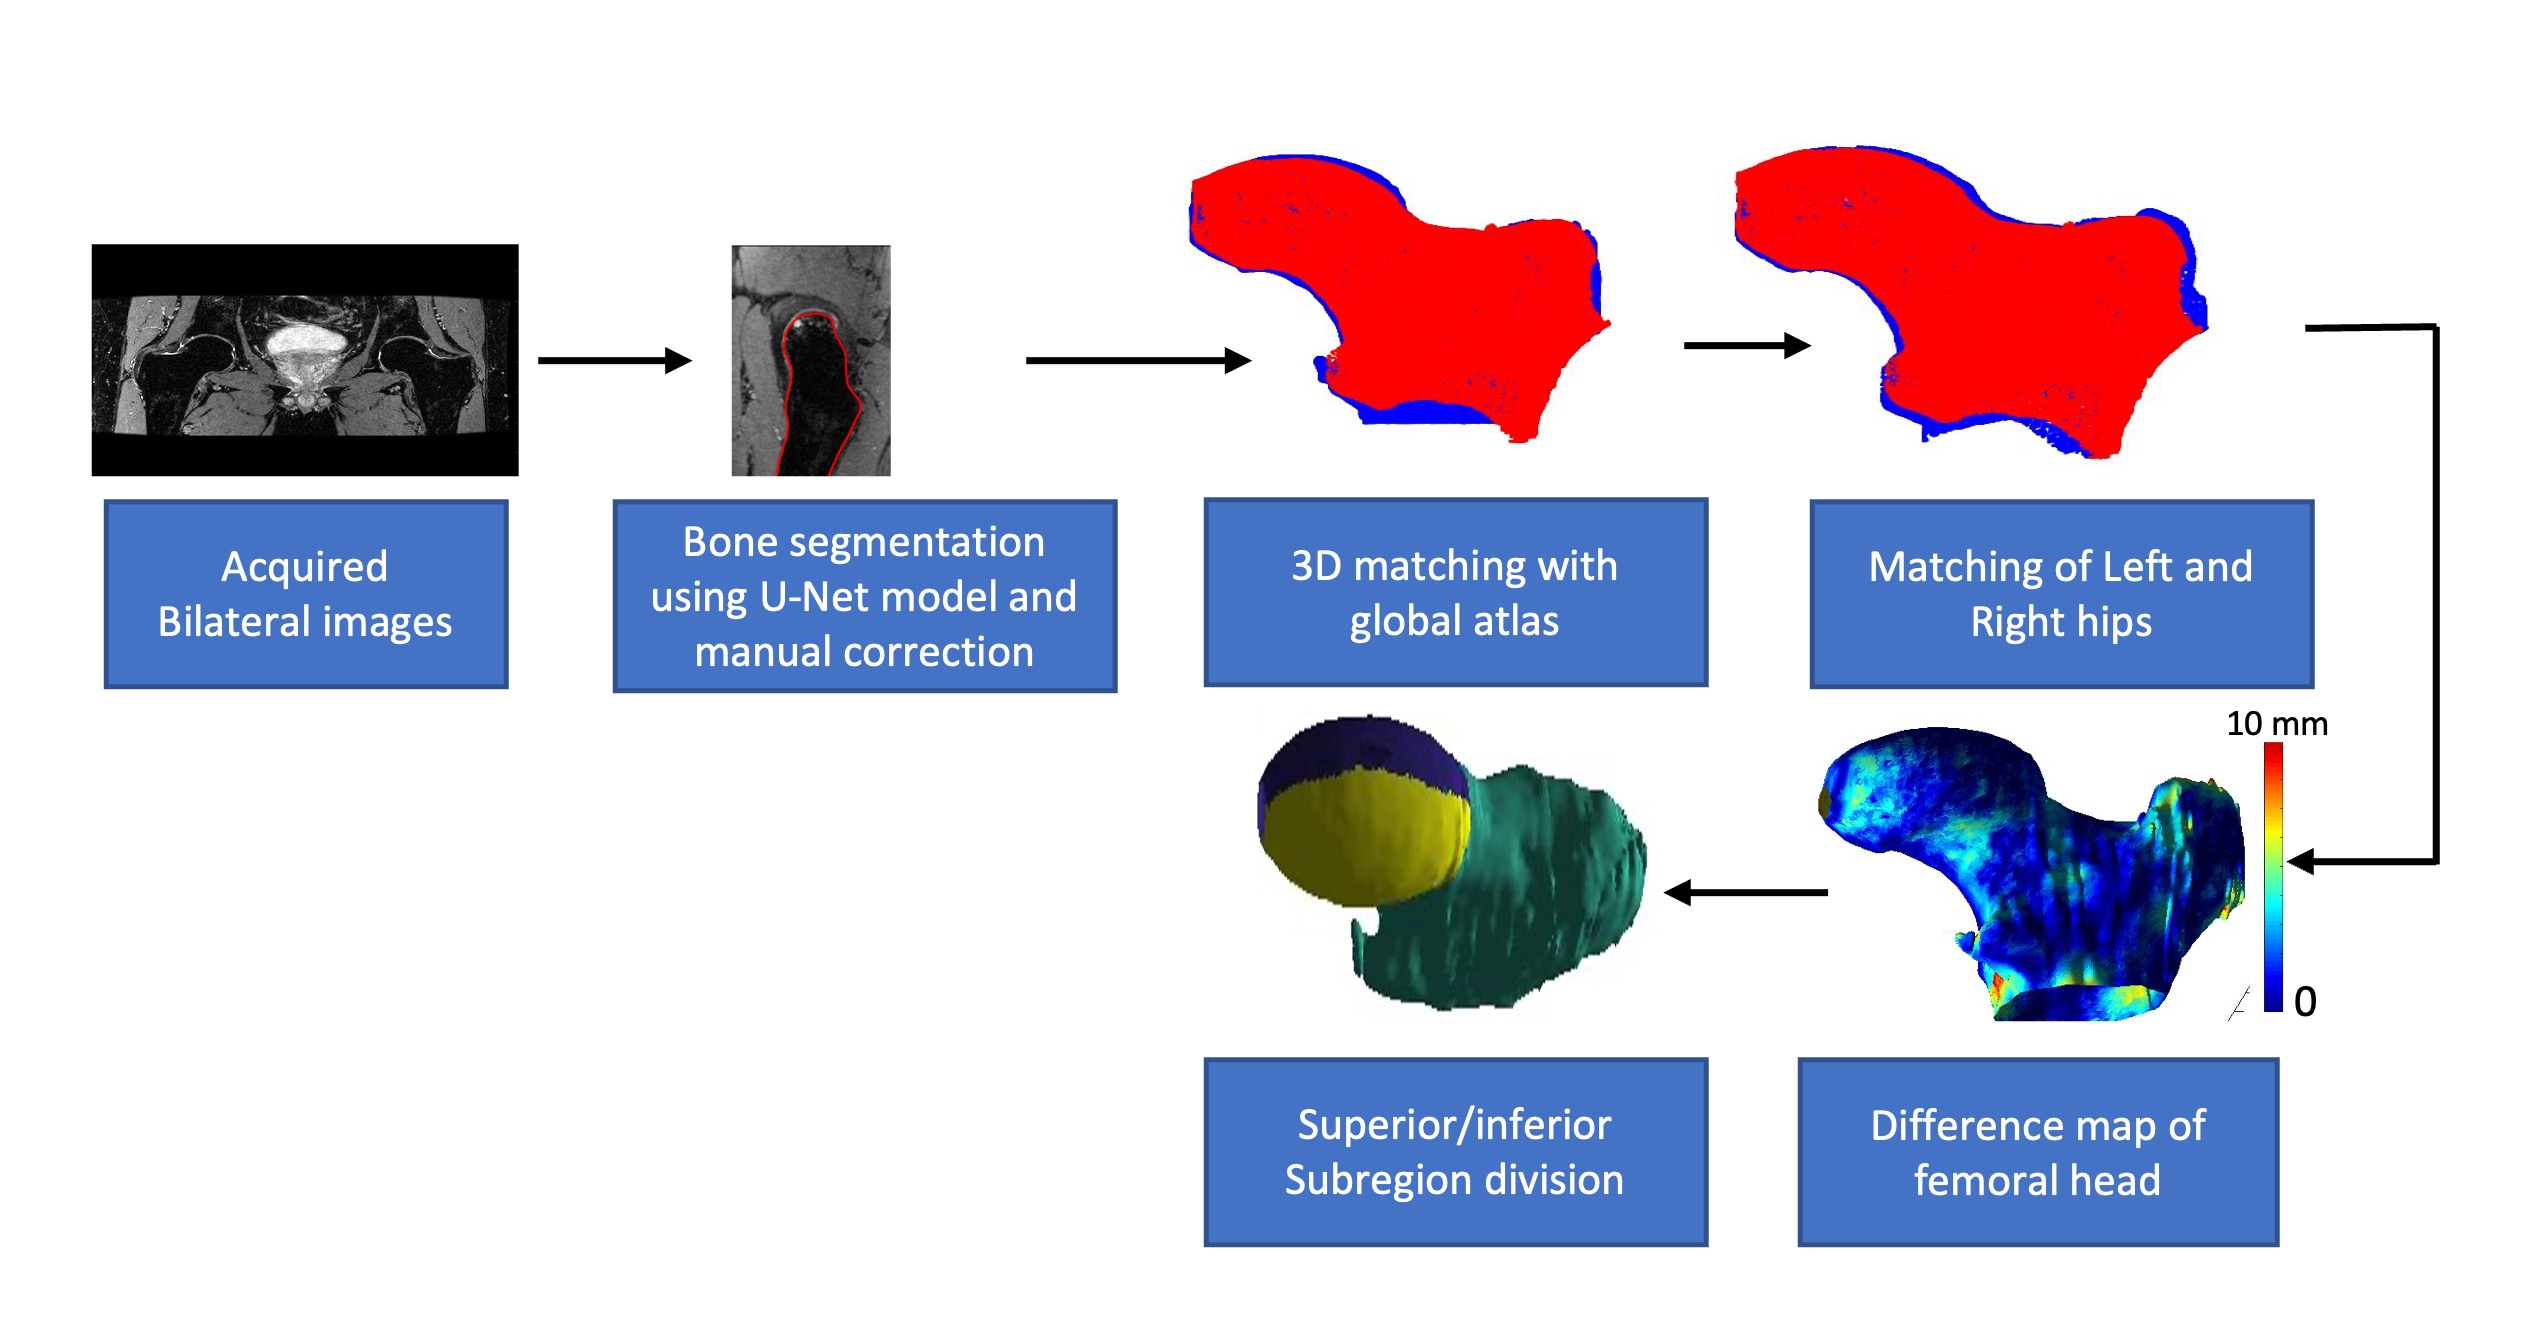
Twelve patients with radiographic Hip OA (7 female, 5 male) provided written consents and participated in this IRB-approved study (age 56.41±10.31 years, BMI 22.88 ± 2.25 kg/m2). Scoring Hip-OA with MRI guidelines were followed and SHOMRI4 scores of both side of the hip were determined by a MSK trained Radiologist. The bilateral hip image acquisition was performed and the detailed MR acquisition parameters were presented in Figure 1. The bone segmentation was performed using in-house developed automatic segmentation technique using U-Net architecture. The performance of the segmentation algorithm was evaluated and corrected manually by two experienced MSK radiologists. The bone shapes 3D meshes of each femoral bone were generated using the Marching Cubes algorithm4. Right hips were flipped to match the orientation of the left hip. One subject with Kellgren-Lawrence (KL) grade 1(left hip) was selected as the reference atlas for the bone mesh analysis (detailed methodology illustrated in Figure 2). Bone shapes of all subjects were aligned with the reference atlas using iterative closest point (ICP) and a matching algorithm 4. Another level of ICP registration was performed for intra-subject-alignment between left and right hip per patient basis. Finally, the difference map between left and right bones of each subject were generated. An automated algorithm was formulated to subdivide the femoral head region equally into eight subregions such as anterior medial superior (AMS), anterior lateral superior (ALS), anterior medial inferior (AMI), anterior lateral inferior), posterior medial superior (PMS), posterior lateral superior (PLS), posterior medial inferior (PMI) and posterior lateral inferior (PLI) using the distance of points to the plane algorithm. The cartilage T1rho and T2 values of femoral cartilage was generated using previously reported Voxel-based-relaxometry and atlas based segmentation method5. The stair climbing test, 40m walk test, the normalized strength test and the chair rise task measures were selected from the biomechanics data. Also, the gait kinematic and kinetics data (sagittal plane hip, knee and ankle angles) were acquired using a 10 camera near-infrared system (Vicon Nexus, Oxford Metrics Ltd) and the data was processed using Visual3D platform and later analyzed in Matlab. This data was used for representative purposes in this study (Figure 3(d),(h) and (l)). All image processing was performed using in-house programs developed in Matlab (The Mathworks, Natick, MA). The Pearson’s correlation was used for the assessment of correlation between different parameters. A p-value of 0.05 was selected as the significant level threshold.Results
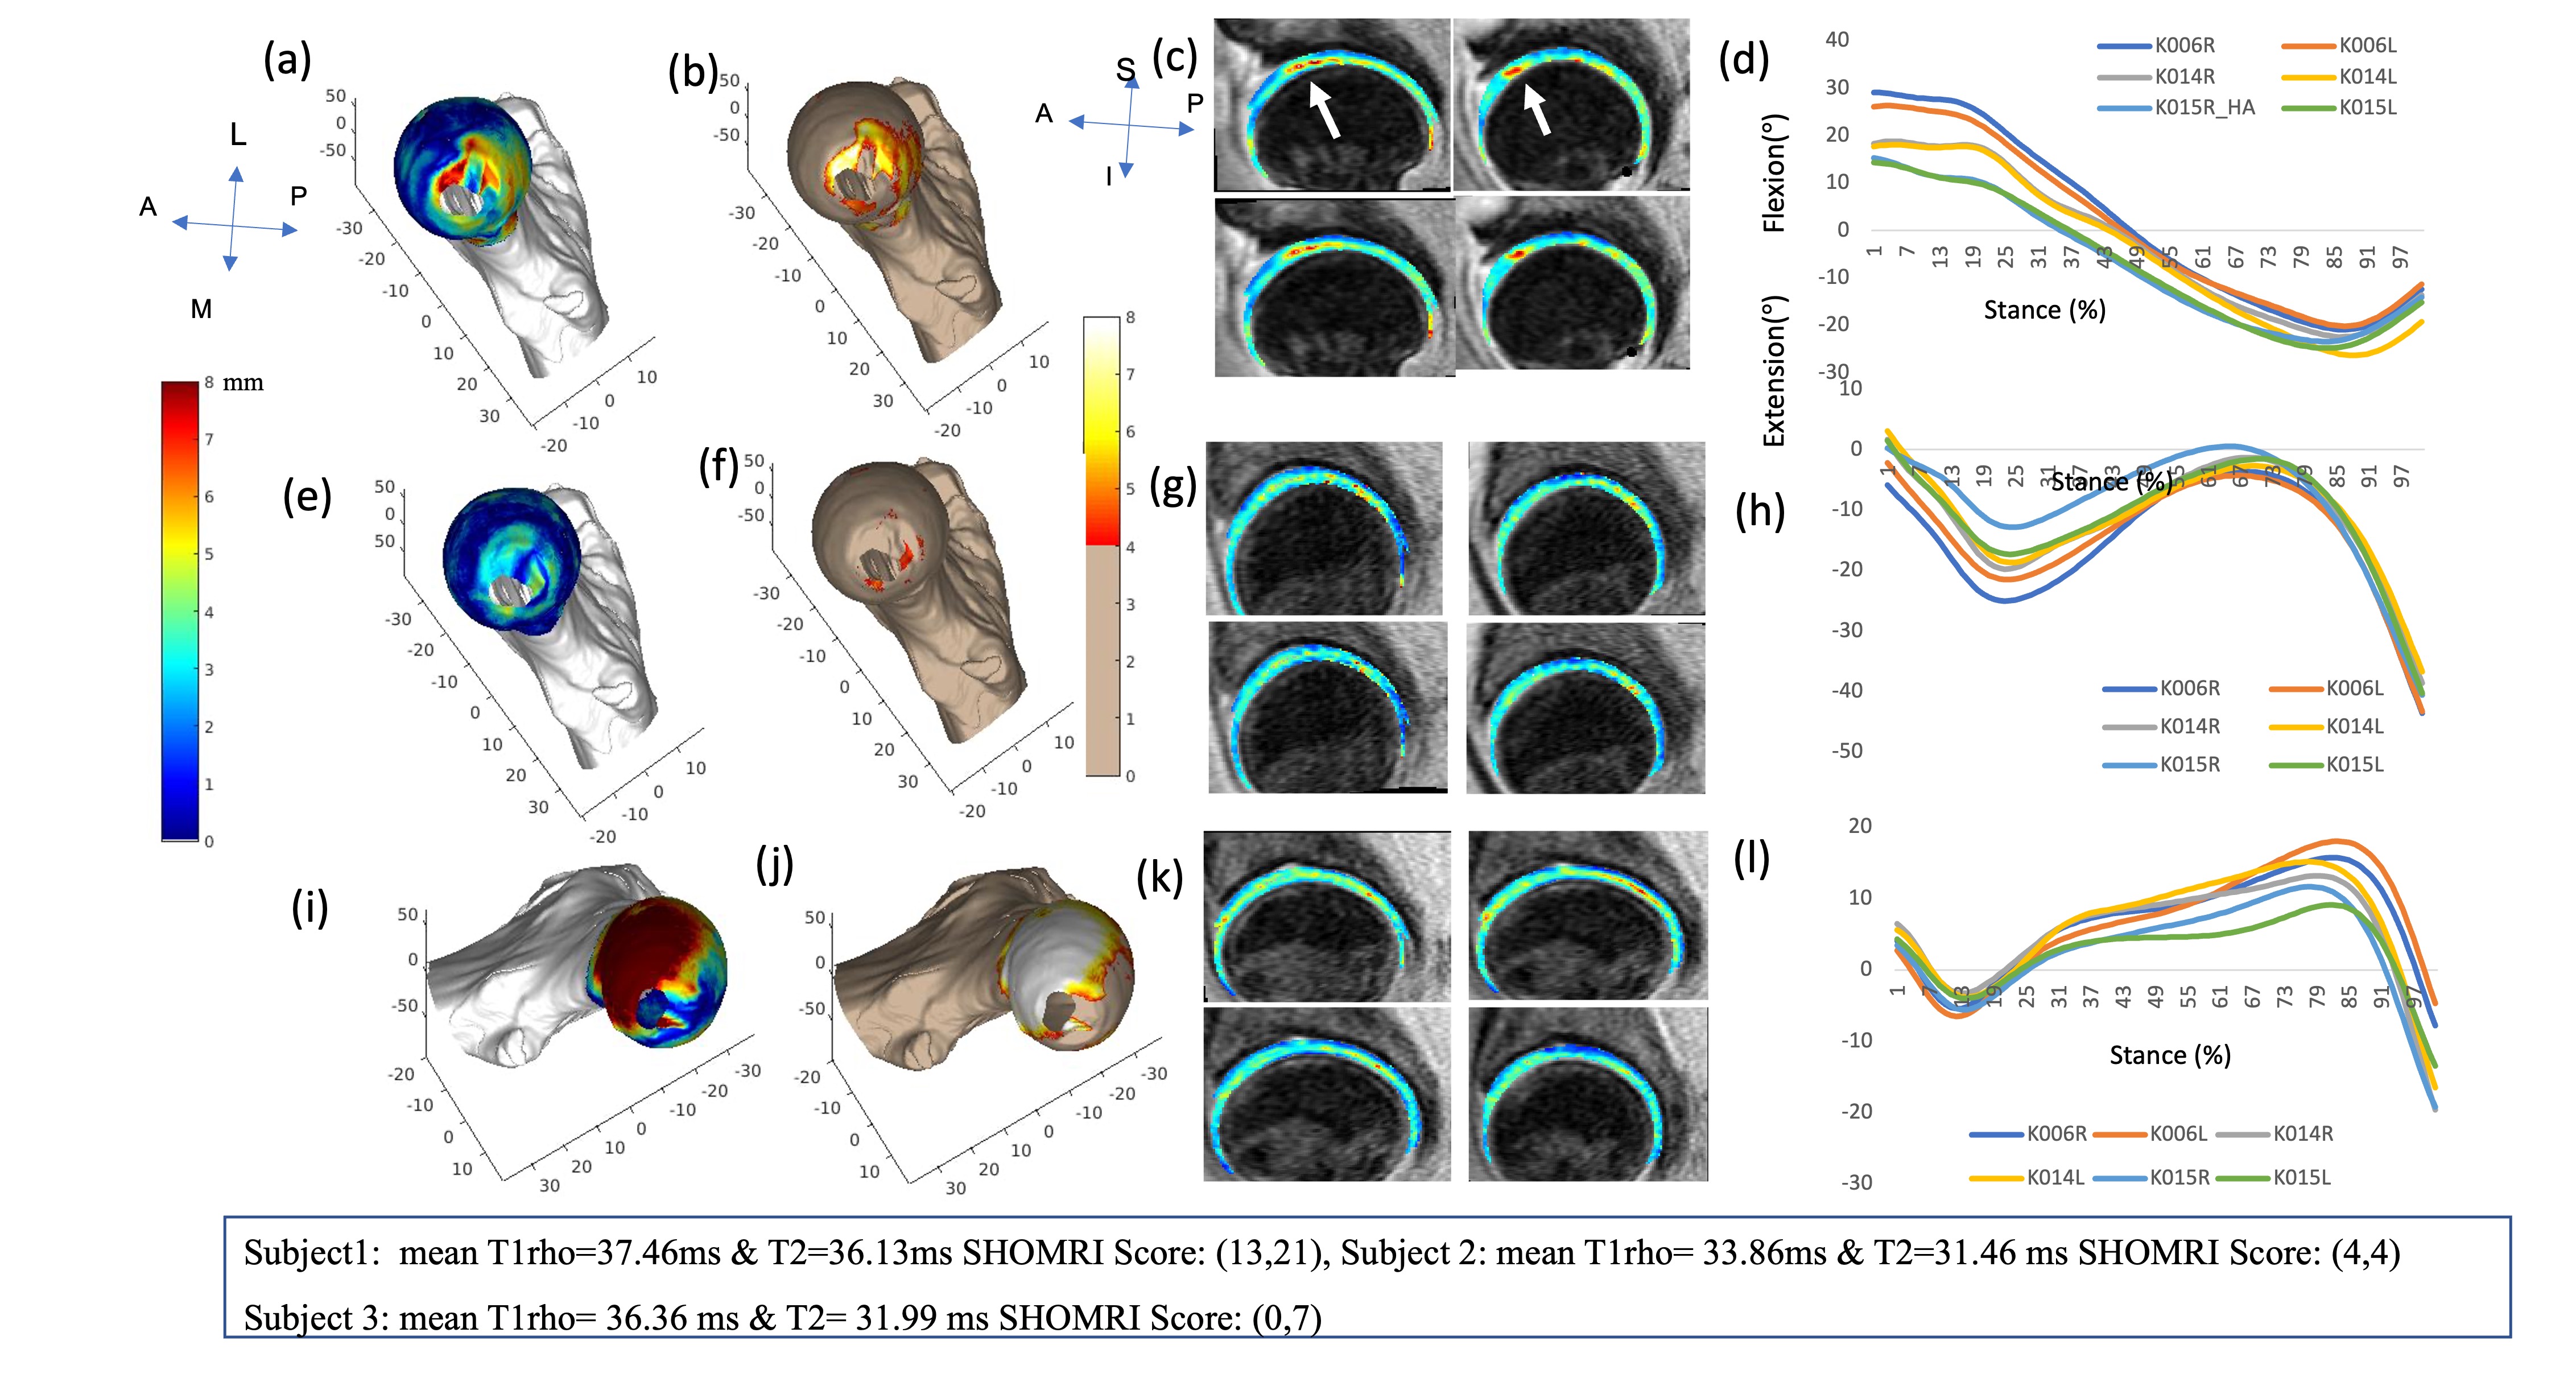
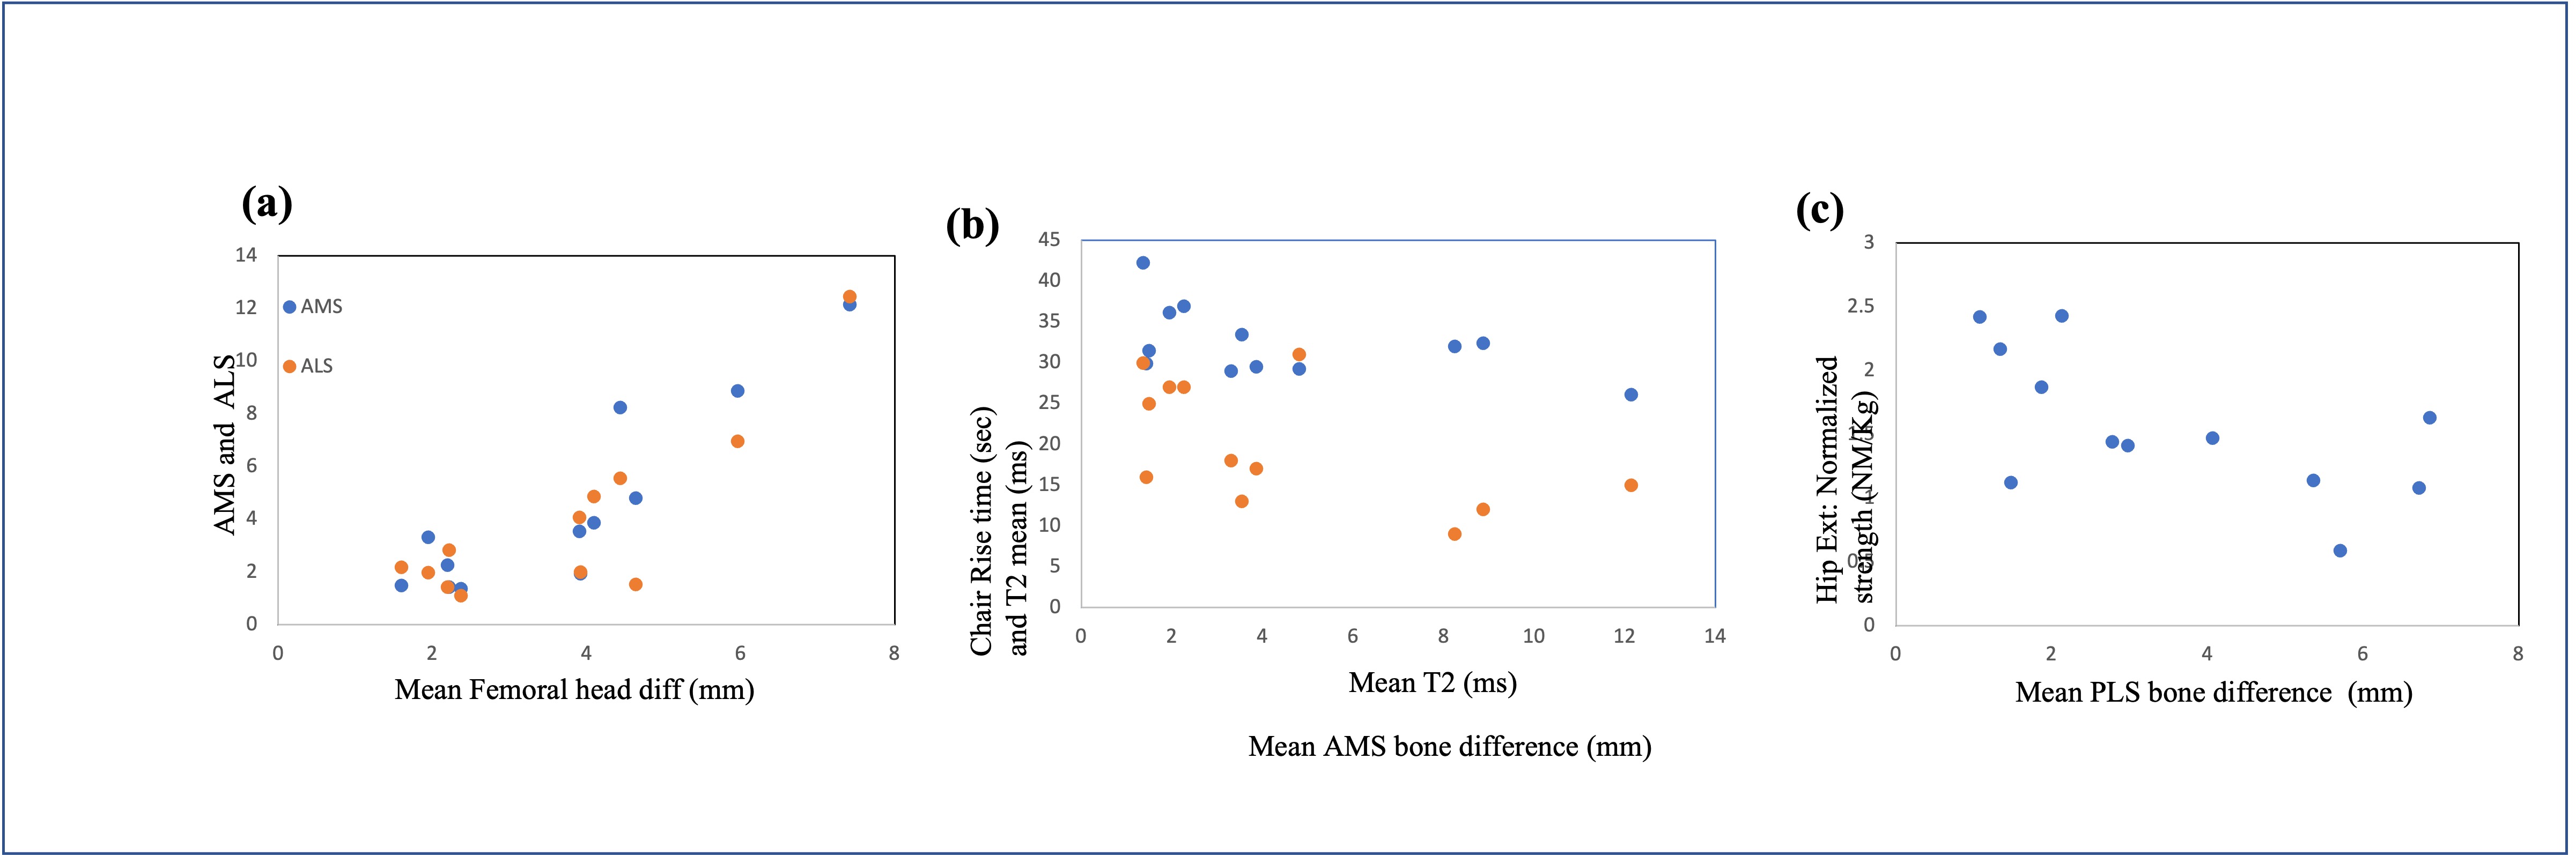
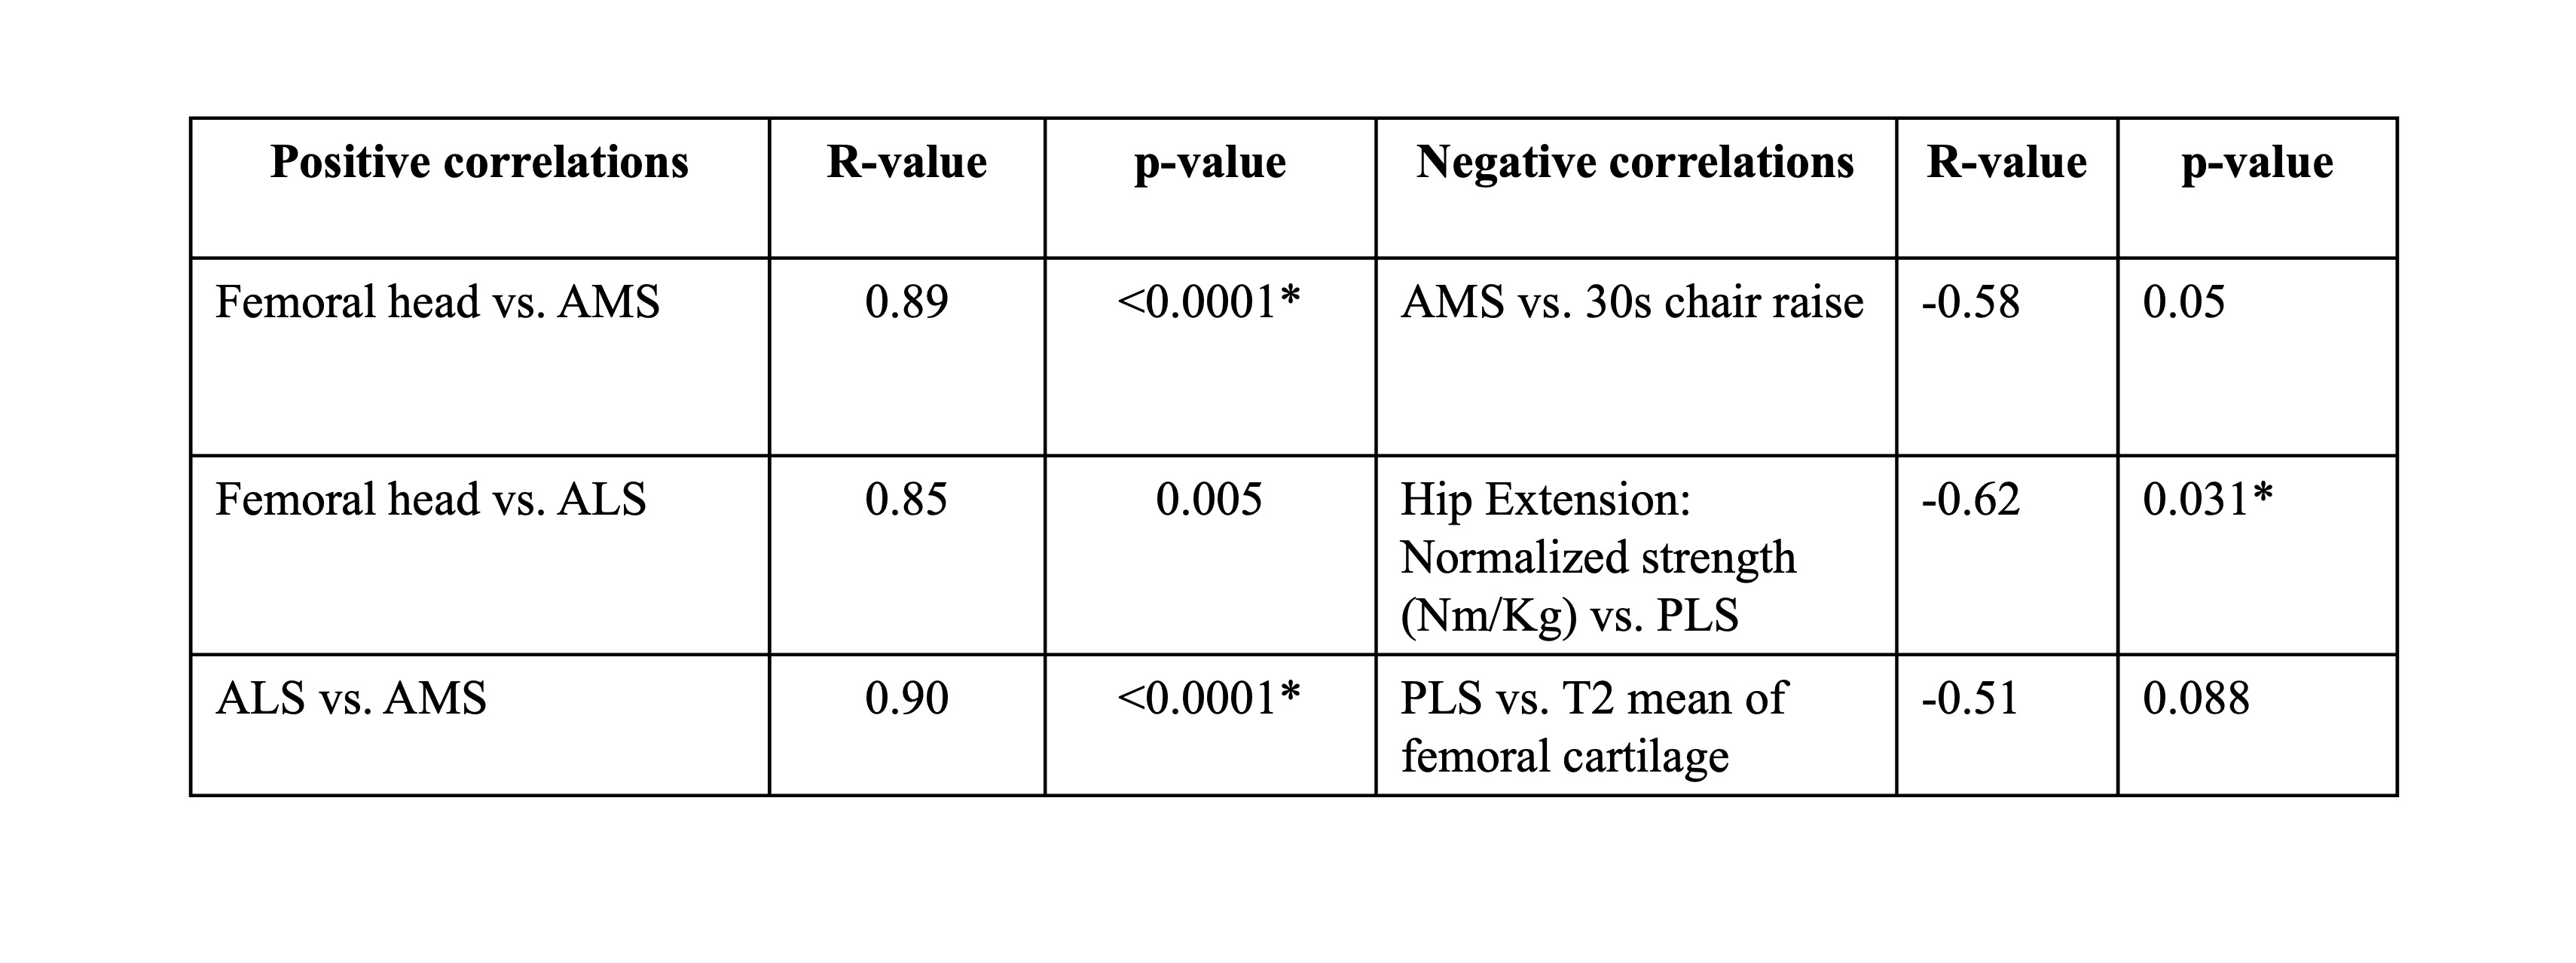
The mean value of the difference between left and right hip femoral head of all subjects was 3.73 ±1.77 mm. The scatterplot of positive and negative correlations between bone asymmetry and biomechanics data were illustrated in Figure 4. The R-value and p-value of some of the significant positive and negative correlation was presented in Figure 5. The result of three example subjects having SHOMRI score was high (13 vs. 21) medium (4 vs. 4) and low (0 vs. 7) range between left and right hip were presented in Figure 3. The overall correlation between bone shape asymmetry values not showing significant correlation with T1rho and T2 values however the three representative example showed elevated T1rhoT2 values corresponding to the increase in SHOMRI score.Discussion
In this feasibility study, we observed similar relationship trend in higher bone asymmetry values in the AMS region correlates with lesser number of repetitions performed 30s chair rise test, validating the common understanding of performance. Also, patient with the hips having high SHOMRI score on both side (Example subject1) displayed high flexion and low extension angle (Figure 2(d)) during gait and elevated T1rho/T2 relaxation time. This is in line with previous publications2. The most noted relationship would be the higher degree of bone asymmetry in the PLS region correlates with having less hip extension isometric strength. In totality, the findings highlight the potential of bone asymmetry to be explored as an independent biomarker in understanding hip OA progression.Conclusion
In this study, bone shape asymmetry was observed to correlate significantly with time taken in 30 second Chair rise test, hip extension isometric normalized strength. This is one of the first feasibility studies to be explored which conveys the potential of bone asymmetry to be considered as a strong biomarker for understanding hip OA.Acknowledgements
This project was supported by R01AR069006 (NIH)References
1. Berenbaum F, Eymard F, Houard X. Osteoarthritis, inflammation and obesity. Curr Opin Rheumatol. 2013;25:114–118.
2. Roach KE, Pedoia V, Lee JJ, et al. Multivariate functional principal component analysis identifies waveform features of gait biomechanics related to early-to-moderate hip osteoarthritis. J Orthop Res. 2021 Aug;39(8):1722-1731. doi: 10.1002/jor.24901.
3. Valentina Pedoia, Michael A. Samaan,Gaurav Inamdar, et al. Study of the interactions between proximal femur 3d bone shape, cartilage health, and biomechanics in patients with hip Osteoarthis. J Orthop Res. 2018 January ; 36(1): 330–341. doi:10.1002/jor.23649.
4. Gao, KT, Pedoia, V, Young, KA, et al. Multiparametric MRI characterization of knee articular cartilage and subchondral bone shape in collegiate basketball players. J Orthop Res. 2021; 39: 1512– 1522. https://doi.org/10.1002/jor.24851
5. Koren Roach, Misung Han, Thomas Link, et al. Feasibility of Simultaneous Bilateral Hip Quantitative MRI, ISMRM 2022 proceedings.
6. V. Pedoia, X. Li, F. Su, et al. Fully automatic analysis of the knee articular cartilage T1rho relaxation time using voxel-based relaxometry, J Magn Reson Imaging, 2016, 43(4), 970-980, doi: 10.1002/jmri.25065
Figures