4372
T2 and T1rho mapping of equine metacarpophalangeal joint cartilage1Stephens Family Clinical Research Institute, Carle Clinical Imaging Research Program, Carle Health, Urbana, IL, United States, 2The Grainger College of Engineering, University of Illinois at Urbana-Champaign, Urbana, IL, United States, 3Lerner Research Institute, Cleveland Clinic, Cleveland, OH, United States, 4Department of Veterinary Clinical Medicine (College of Veterinary Medicine), University of Illinois, Urbana, IL, United States
Synopsis
Keywords: Cartilage, Quantitative Imaging
Horses are an excellent translational model of orthopedic disease with high relevance to human disease. T2 and T1rho mapping can provide information about early cartilage changes in a horse post-traumatic osteoarthritis model. We investigated the feasibility of using MAPSS-based T2 and T1rho mapping in the horse metacarpophalangeal joint cartilage in cadaver specimens and live horses with and without joint pathology. MAPSS-based T2 and T1rho mapping of equine metacarpophalangeal joint cartilage is feasible and provides realistic cartilage relaxometry values.Introduction
Due to their large size and athleticism, horses are a uniquely suited translational model of orthopedic disease with high relevance to human disease. Equine articular cartilage is similar to human cartilage in terms of cellular structure, biochemical makeup, and biomechanical properties1,3,10, and horses naturally experience conditions such as post-traumatic osteoarthritis (PTOA). The metacarpophalangeal joint (“fetlock”) of the horse is subject to the highest joint forces of the distal forelimb5 and is a common site for catastrophic fractures and degenerative joint disease. As in humans, PTOA is a leading cause of morbidity in horses, but is often diagnosed only after permanent cartilage damage has occurred. T2 and T1rho mapping MRI can provide information about changes in collagen organization and proteoglycan content that occur early in the cartilage degeneration process, prior to morphological changes visible on conventional MRI8. Magnetization-prepared angle-modulated partitioned-k-space spoiled gradient echo snapshots (MAPSS) enables acquisition of each of these quantitative measures via T2 or spin-lock preparation9,11. This sequence has been used in healthy and osteoarthritic human cartilage4,9,11 but has not been applied in the horse fetlock joint, which is particularly challenging due to articular surface curvature and thin cartilage (~0.9 mm)7. In this work we evaluate MAPSS-based T2 and T1rho mapping in the fetlock joint cartilage in cadaver and live horses with and without joint pathology.Methods
Cadaveric horse joints: 3 frozen limbs from skeletally mature horses aged 5-15 years with no known severe joint pathology in the imaged limb were thawed to room temperature and the fetlock joints were scanned at 3T (MAGNETOM Skyra, Siemens) using the body coil for excitation and a flexible 18-channel coil wrapped around the fetlock joint to receive signal. Sagittal and dorsal plane MAPSS T2 and T1rho mapping (T2 preparation, TE values = 1.42, 20.08, 40.16, 60.24 ms; T1rho preparation, 4 spin-lock times (TSL) = 0, 10, 30, 70 ms, spin lock frequency = 500 Hz) was performed (TR = 7.25 ms, slice thickness = 3-4 mm, in-plane resolution = 0.44 mm (0.22 mm interpolated), fat suppression on). Sagittal and dorsal plane high-resolution anatomic images were also acquired (T2 TSE, slice thickness = 2 mm, in-plane resolution = 0.3x0.3 mm, TE = 102 ms, TR = 4040 ms). An osteochondral defect was created arthroscopically in one cadaver joint on the dorsomedial aspect of the first phalanx (P1) prior to imaging to mimic cartilage injury model appearance; this cadaver joint was found during the arthroscopic procedure to have visible cartilage damage (wear lines) to the medial condyle of the third metacarpus and corresponding lesions on the medial aspect of proximal P1. One cadaver leg was scanned at two timepoints to evaluate between-scan repeatability.In vivo horse joints:
Two living horses (subject 1: 8-year-old male castrated Warmblood, right front fetlock; subject 2: 25-year-old female Standardbred, left front fetlock) were scanned using the same protocol as the cadaver joints. Subject 1 showed no clinical signs of joint pain/dysfunction and morphologic MRI findings included mild adaptive metacarpal sagittal ridge sclerosis and mild lateral suspensory ligament enlargement/moderate signal increase. Subject 2 had mild forelimb lameness, not specifically localized to the fetlock; morphologic MRI findings were consistent with mild-moderate osteoarthritis with stress sclerosis of the phalangeal sagittal groove and medial fovea and likely articular cartilage damage of the medial aspect of the joint. Both horses were scanned twice (14-24 days apart) to evaluate between-scan repeatability.
Processing and analysis
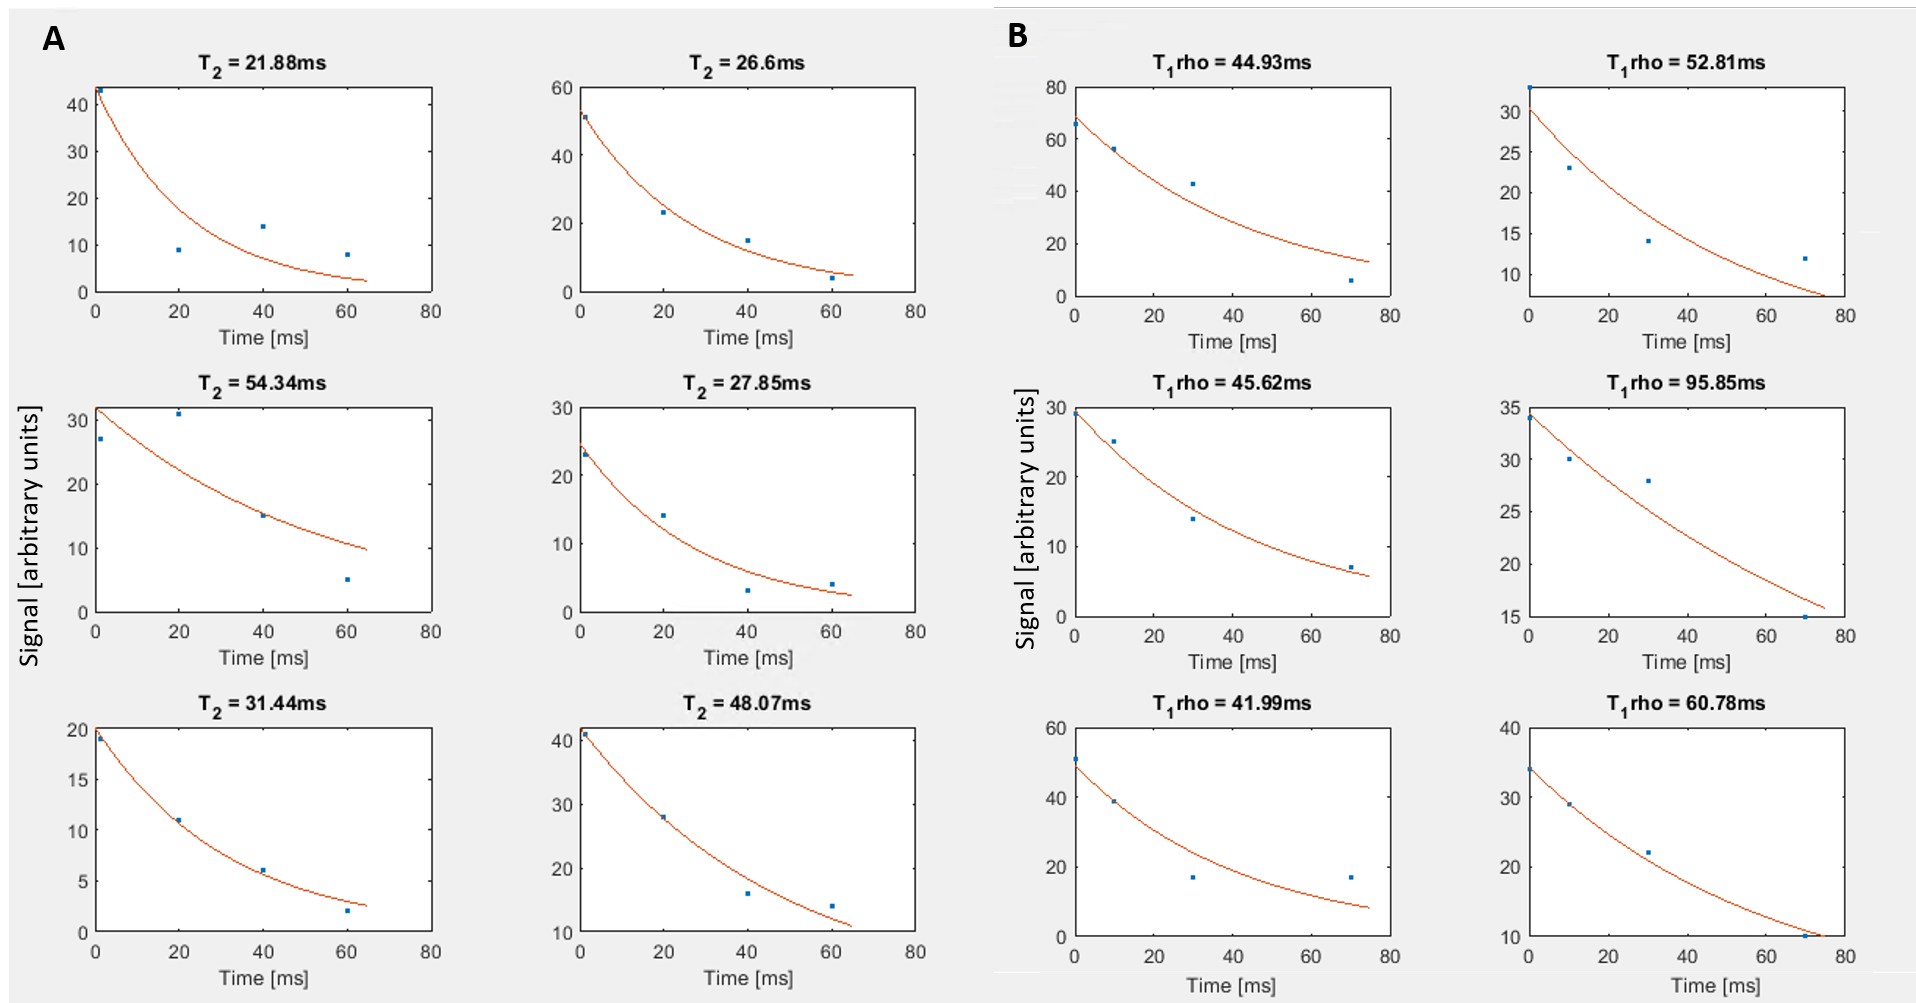
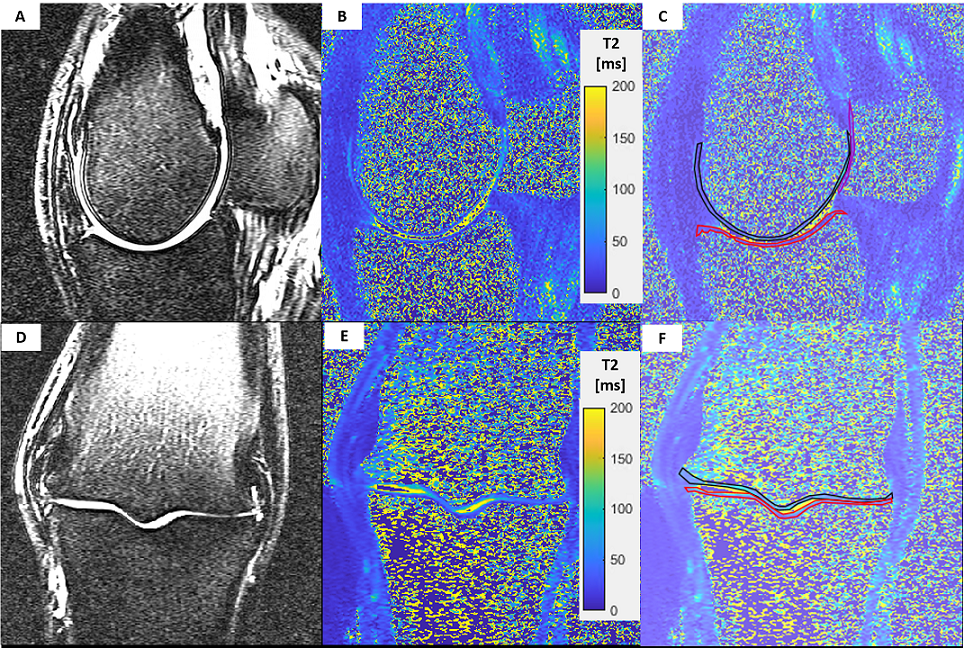
T2 and T1rho map calculation was performed using monoexponential fitting in MATLAB (Figure 1). One rater segmented the sesamoid, metacarpal, and phalangeal cartilage on the T2 or T1rho map series with visual reference to the corresponding high-resolution T2 TSE series (Figure 2). T2 and T1rho values were thresholded to 0-200 ms to remove outliers due to noise and partial volume averaging, and median values and interquartile ranges were calculated for all cartilage and 3 regions of interest (ROIs). The average signal-to-noise ratio over each mapping series was calculated.
Results
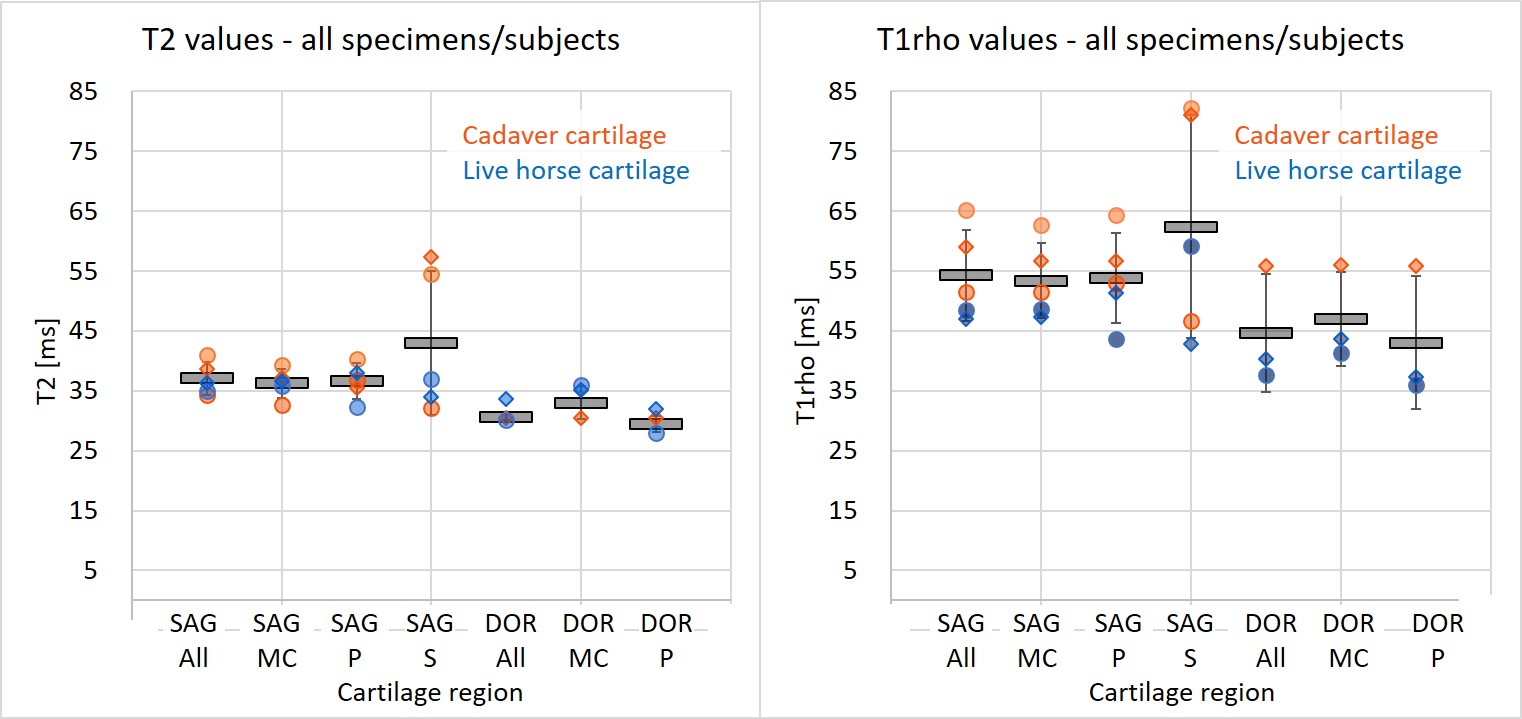
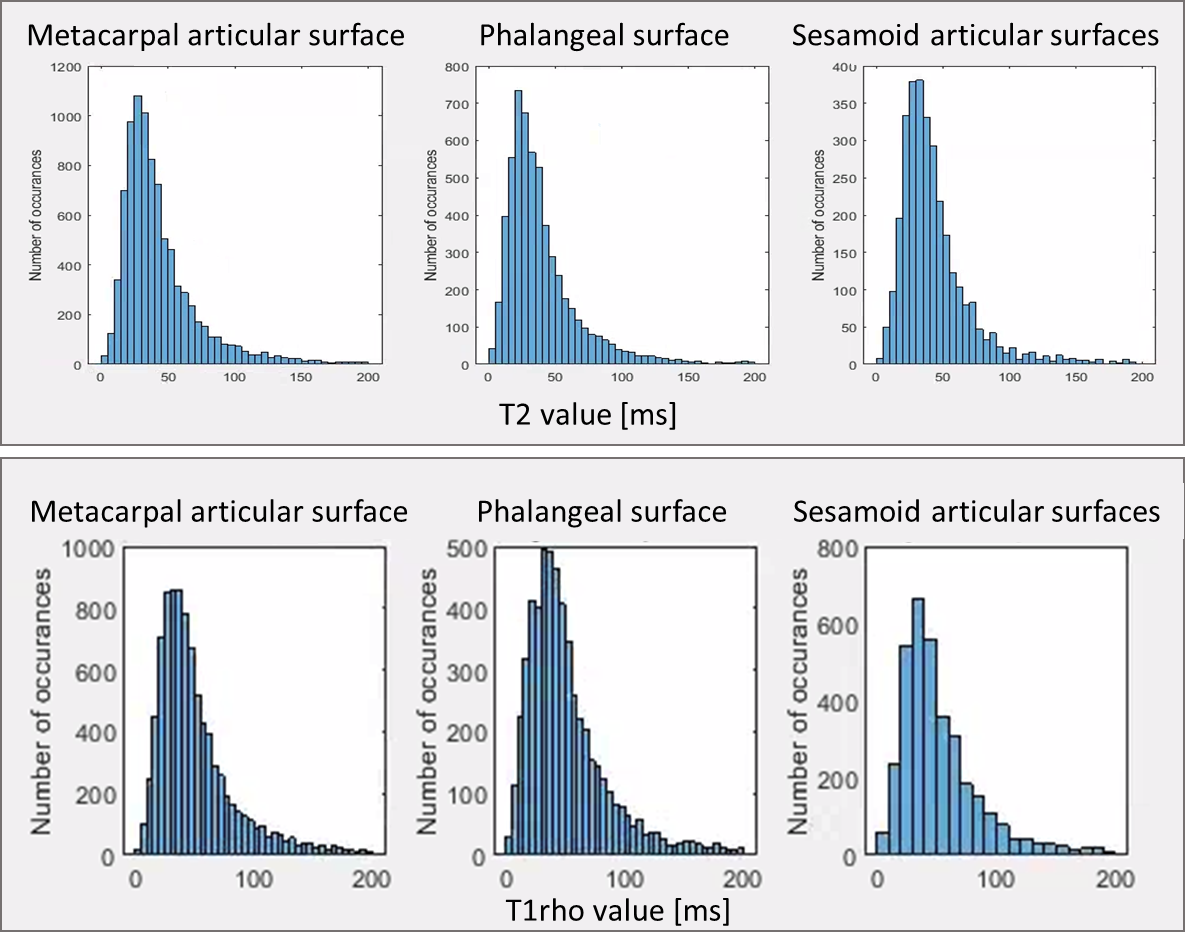
Cartilage median T2 and T1rho values averaged over all specimens/subjects were 34±2 ms and 49±9 ms (all cartilage) and were generally higher in the cadavers (Figure 3). Subregion T2 and T1rho values were 35±3/50±7 (metacarpal), 33±2/48±9 (phalangeal), and 43±12/62±19 ms (sesamoids). Figure 4 shows an example distribution of T2 and T1rho values within each subregion for subject 1. Mean cartilage signal-to-noise ratio (SNR) was 10±5 averaged over all TE or TSL (4±1 lowest, at longest TE) for T2 and 14±6 (5±1 lowest, at longest TSL) for T1rho mapping series. Mean absolute change in region median T2 and T1rho between repeat scans was 2 ms (0-7 ms)/4 ms (0-12 ms). The sesamoid measurements were least repeatable for T2 and T1rho.Discussion
MAPSS-based T2 and T1rho values for all metacarpophalangeal joint cartilage surfaces were successfully measured for all specimens and live subjects without and with joint pathology. Relatively low average SNR values suggest that optimizing acquisition techniques or post-processing denoising may be necessary at the required image resolution. Nevertheless, the T2 and T1rho values obtained are in line with values reported in the literature for human and equine cartilage2,6,8,12,13.Conclusions
This work demonstrates the feasibility of applying MAPSS-based T2 and T1rho mapping to equine metacarpophalangeal joint cartilage.Acknowledgements
This work was supported by funding from USDA Hatch Funds ILLU-888-939.References
1. Ahern BJ, Parvizi J, Boston R, Schaer TP. Preclinical animal models in single site cartilage defect testing: a systematic review. Osteoarthritis Cartilage. 2009;17(6):705-713. doi:10.1016/j.joca.2008.11.008
2. Bischofberger AS. Early detection of degeneration of the equine joint cartilage using quantitative MRI techniques. Published online 2017. doi:10.5167/UZH-146705
3. Frisbie DD, Cross MW, McIlwraith CW. A comparative study of articular cartilage thickness in the stifle of animal species used in human pre-clinical studies compared to articular cartilage thickness in the human knee. Vet Comp Orthop Traumatol VCOT. 2006;19(3):142-146.
4. Han M, Tibrewala R, Bahroos E, Pedoia V, Majumdar S. Magnetization‐prepared spoiled gradient‐echo snapshot imaging for efficient measurement of R2 ‐R1ρ in knee cartilage. Magn Reson Med. 2022;87(2):733-745. doi:10.1002/mrm.29024
5. Harrison SM, Whitton RC, Kawcak CE, Stover SM, Pandy MG. Relationship between muscle forces, joint loading and utilization of elastic strain energy in equine locomotion. J Exp Biol. 2010;213(Pt 23):3998-4009. doi:10.1242/jeb.044545
6. Ho CP, Surowiec RK, Frisbie DD, et al. Prospective In Vivo Comparison of Damaged and Healthy-Appearing Articular Cartilage Specimens in Patients With Femoroacetabular Impingement: Comparison of T2 Mapping, Histologic Endpoints, and Arthroscopic Grading. Arthrosc J Arthrosc Relat Surg Off Publ Arthrosc Assoc N Am Int Arthrosc Assoc. 2016;32(8):1601-1611. doi:10.1016/j.arthro.2016.01.066
7. Lee H, Kirkland WG, Whitmore RN, et al. Comparison of equine articular cartilage thickness in various joints. Connect Tissue Res. 2014;55(5-6):339-347. doi:10.3109/03008207.2014.949698
8. Li X, Benjamin Ma C, Link TM, et al. In vivo T1ρ and T2 mapping of articular cartilage in osteoarthritis of the knee using 3T MRI. Osteoarthritis Cartilage. 2007;15(7):789-797. doi:10.1016/j.joca.2007.01.011
9. Li X, Han ET, Busse RF, Majumdar S. In vivoT1ρ mapping in cartilage using 3D magnetization-prepared angle-modulated partitionedk-space spoiled gradient echo snapshots (3D MAPSS). Magn Reson Med. 2008;59(2):298-307. doi:10.1002/mrm.21414
10. Malda J, Benders KEM, Klein TJ, et al. Comparative study of depth-dependent characteristics of equine and human osteochondral tissue from the medial and lateral femoral condyles. Osteoarthritis Cartilage. 2012;20(10):1147-1151. doi:10.1016/j.joca.2012.06.005
11. Matzat SJ, McWalter EJ, Kogan F, Chen W, Gold GE. T2 Relaxation time quantitation differs between pulse sequences in articular cartilage: T2 Relaxation Time Sequence Comparison. J Magn Reson Imaging. 2015;42(1):105-113. doi:10.1002/jmri.24757
12. Su F, Hilton JF, Nardo L, et al. Cartilage morphology and T1ρ and T2 quantification in ACL-reconstructed knees: a 2-year follow-up. Osteoarthritis Cartilage. 2013;21(8):1058-1067. doi:10.1016/j.joca.2013.05.010
13. Surowiec RK, Lucas EP, Fitzcharles EK, et al. T2 values of articular cartilage in clinically relevant subregions of the asymptomatic knee. Knee Surg Sports Traumatol Arthrosc. 2014;22(6):1404-1414. doi:10.1007/s00167-013-2779-2Figures