4370
Orientation-independent T2 relaxation parameters and biomechanics of healthy and degenerated human articular cartilage1Department of Applied Physics, University of Eastern Finland, Kuopio, Finland, 2Mikkeli Central Hospital, Mikkeli, Finland, 3Kuopio University Hospital, Kuopio, Finland
Synopsis
Keywords: Cartilage, Osteoarthritis
Variation in T2 relaxation has been linked to changes in articular cartilage degenerative status. Most prominently to the collagen network integrity. However, T2 is greatly anisotropic in highly organized tissues, e.g. articular cartilage. Previous results show that using re-orientation experiments, orientation-independent T2 components can be defined. This study assesses the potential of these parameters to serve as biomarkers for osteoarthritis via comparing the orientation-independent T2 parameters to biomechanical testing results in human articular cartilage. Changes in the anisotropic component of T2 in the superficial and transitional zones are observed along with the biomechanical degeneration of the articular cartilage.Introduction
If osteoarthritis (OA) is detected early enough, its progress can be slowed down by weight management and conservative therapeutic intervention1. In the early stages of OA, cartilage undergoes molecular, chemical, and enzymatic changes2. Proteoglycan (PG) loss and decreased integrity of the collagenous network are among the most prominent changes2,3. Sensitivity to these early changes is a vital criterion for a potential diagnostic method. Structural changes in cartilage lead to altered function and can be quantified using biomechanical testing. The capacity of cartilage to withstand compressive forces, after free water has ceased to flow out, depends on its PG content, and can be described with the equilibrium modulus (Eeq)4. Correspondingly, instantaneous modulus (Einst) describes the response of pressurized cartilage immediately under load, and depends critically on the collagen network integrity.T2 relaxation time has been extensively studied in cartilage, and has been linked to the properties of the collagen network and thus to the biomechanical properties5–8. Elevated T2 relaxation times have been reported in mild and severe OA9,10. T2 has been demonstrated sensitive to the collagen integrity, but fairly insensitive to changes in the proteoglycan content7. However, T2 relaxation is greatly dependent on the orientation of highly organized structures or tissues in the magnetic field. Thus, it can be prone to misinterpretation and unreliable without either rotation measurements or precise a priori knowledge of the properties of the oriented structures within the tissues5,6,11–14. Since T2 relaxation is very sensitive to these changes, an orientation-independent method for T2 mapping would be highly useful. The purpose of this preliminary study is to determine whether orientation-independent T2 parameters (isotropic R2 (=1/T2), anisotropic R2, and T2 relaxation anisotropy) can serve as biomarkers for cartilage degeneration by comparing them to cartilage biomechanics.
Methods
Osteochondral plugs (d=4mm, currently n=10; 20 more samples scheduled) from cadaveric human distal femur were prepared (PSSHP Ethical board decision 134/2015), and stored at -22°C prior to experiments. For MRI, after thawing in room temperature, the samples were immersed in perfluoropolyether (Galden HS 240, Solvay Solexis, Italy) to provide clean 1H signal-free background, and were placed in 3-D printed Arduino-controlled sample holder capable of reorienting the samples automatically during the scan. The scanning was conducted at 9.4T using VnmrJ 3.1 Varian/Agilent DirectDrive console (Varian Associates Inc., Pala Alto, CA, USA) and a 19-mm quadrature RF volume transceiver (RAPID Biomedical GmbH, Rimpar, Germany). With the automated rotation device, the samples were scanned at 13 orientations along a single plane, spanning 180° with respect to B0. Samples were scanned with T2-MESE sequence with a matrix size of 256*256 and FOV of 13*13mm (Nechos=10, echo spacing=5.516ms). All the T2 maps scanned at different orientations were co-registered to the same geometry using Elastix15 software. A model of anisotropic T2 relaxation was fit to the data: 1/T2 = R2i + R2a*[(3cos^2(θ + c) -1)/2]^2, where R2i refers to isotropic and R2a to anisotropic component of T2, θ is the initial 3-D-angle and c is phase shift16. Voxel-wise T2 anisotropy maps of each sample were calculated using Michelson contrast12 and were further used to determine ROIs for the three different zones of articular cartilage. Hayes-corrected17 Eeq and Einst were determined via biomechanical indentation (d=0.5mm) stress-relaxation (4x5% strain) testing18. Spearman rank correlations were calculated between the estimated MRI parameters and biomechanical results for each ROI with a statistical significance defined as p<0.05.Results
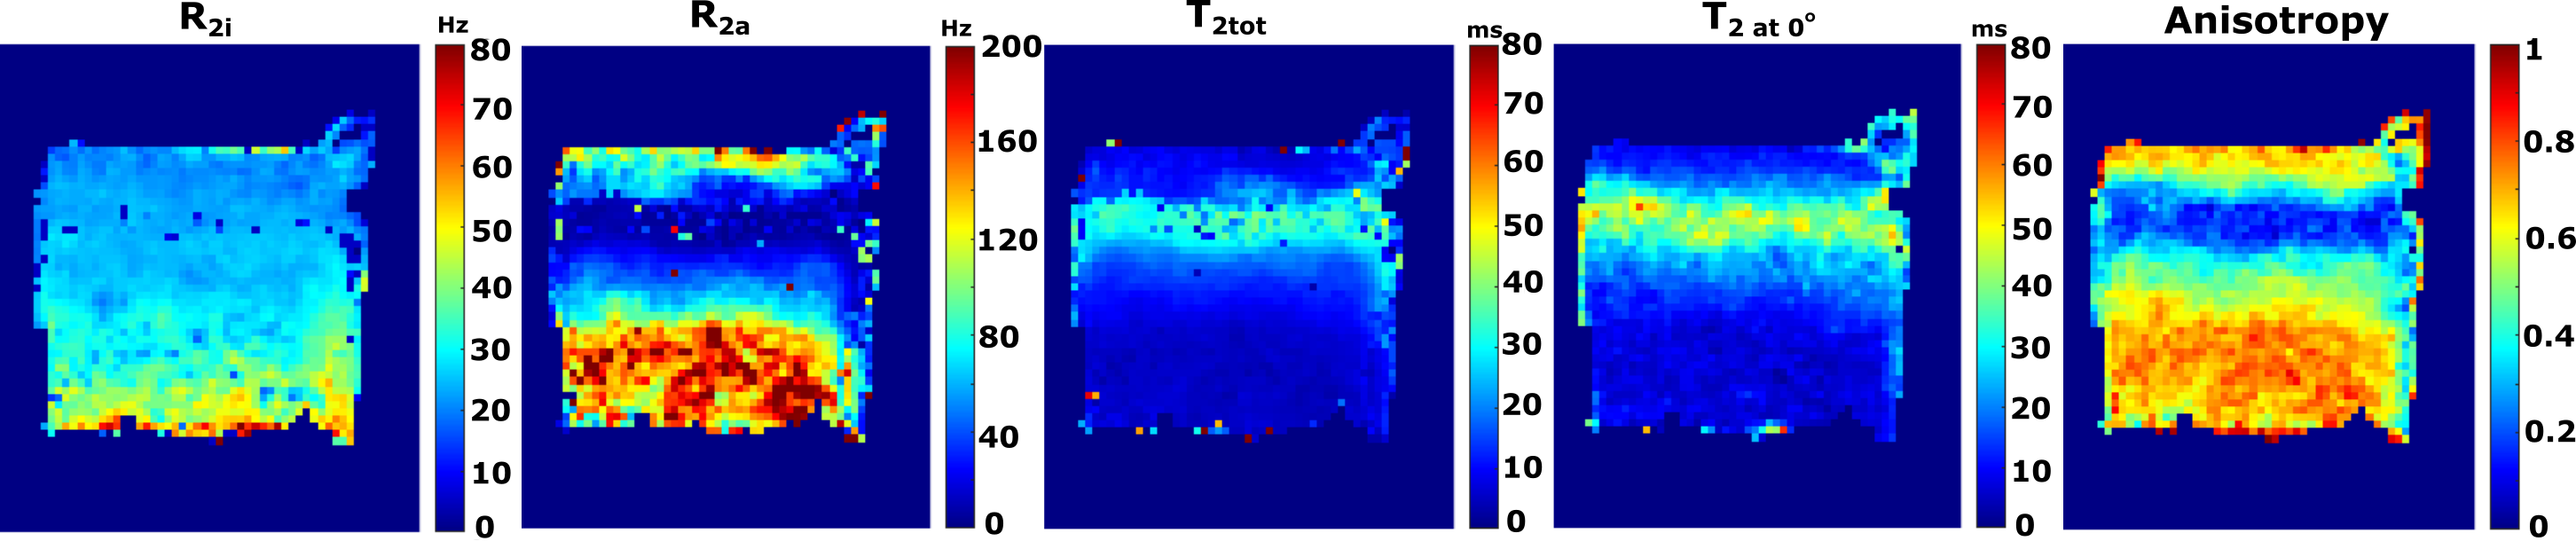
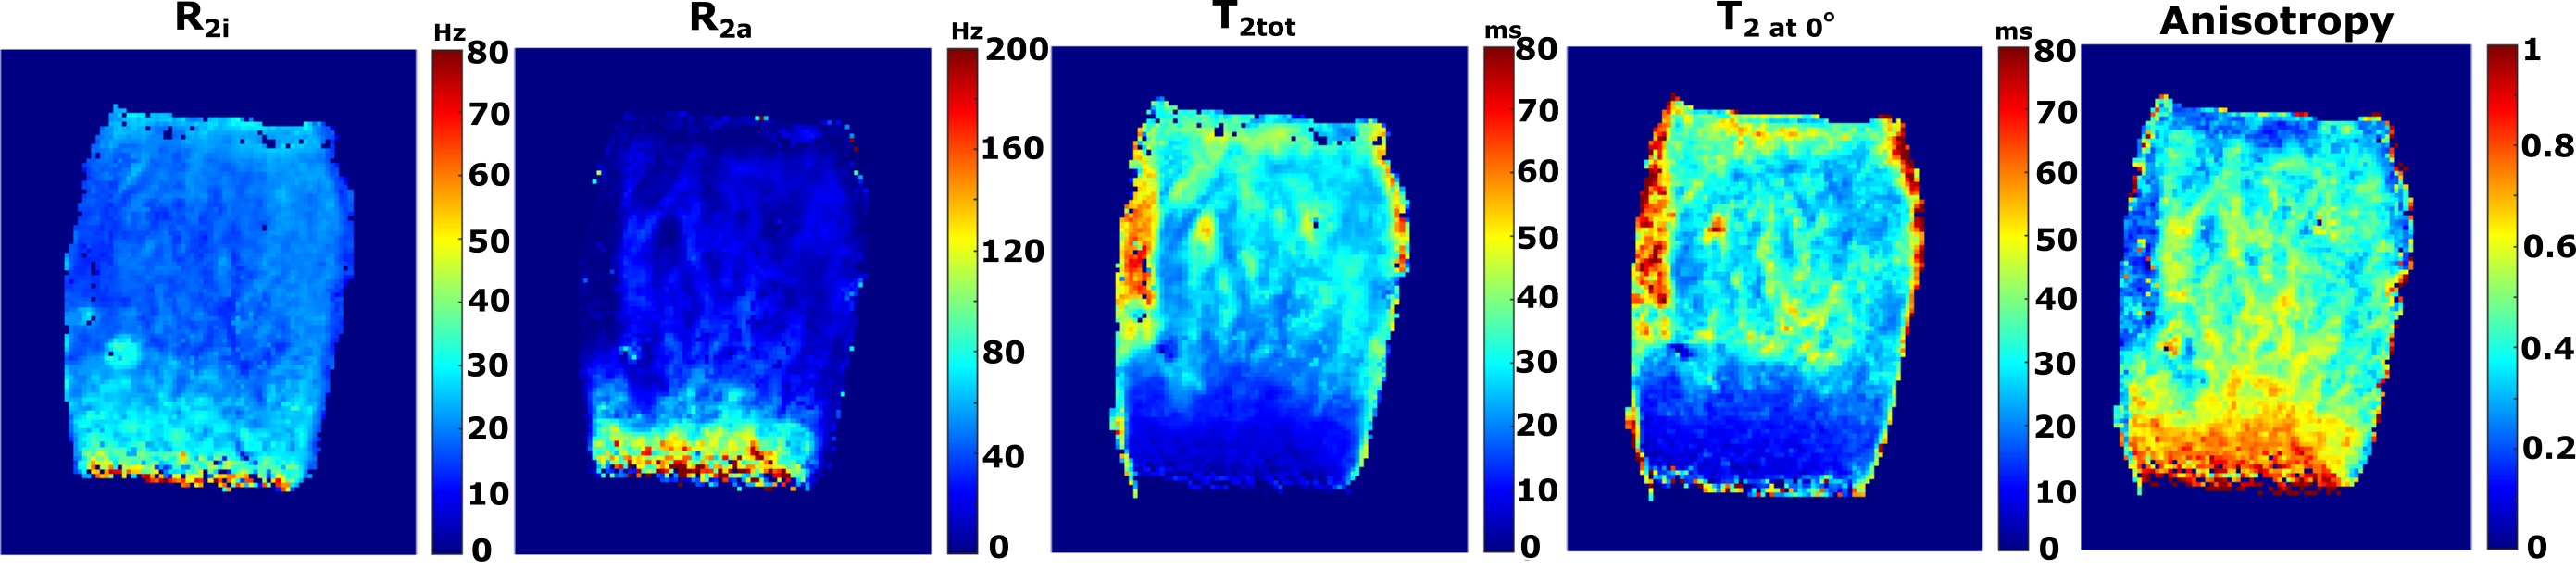
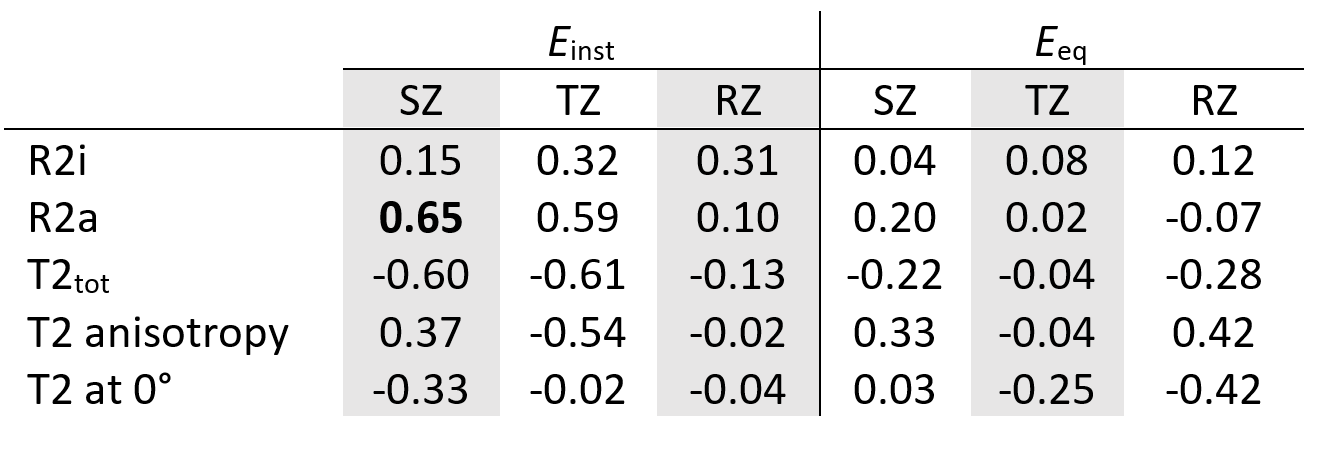
Einst showed correlation with R2a and T2tot (= [R2i + R2a]^-1) (ρ=0.59-0.65, p= 0.049-0.080) in the superficial and transitional zones of cartilage (Table 1). A correlation was found also between the T2 anisotropy and Einst. Low correlation with Einst was observed in the deep radial zone of cartilage. In general, low correlations were found for the isotropic component R2i (Table 1). No significant correlations were found between the MRI parameters and Eeq. Greater anisotropic relaxation rate (R2a=11Hz in TZ and 83Hz in SZ) was observed in a biomechanically intact sample (Figure 1) compared to a biomechanically degenerated specimen (Figure 2) (R2a=3.3Hz in TZ and 8.9Hz in SZ).Discussion and conclusion
The aim of this preliminary study was to determine if the orientation-independent T2 componens (R2a, R2i, T2tot, and T2 anisotropy) have potential to serve as biomarkers for OA. The results are promising since correlations were found between the Einst, which depends significantly on the integrity of the collagen network. Surprisingly, a low correlation of T20deg with Einst was observed. This might be due to the magic angle effect, making the single-orientation T2 data unreliable5. We suspect that the previously reported elevation of T2 values in degenerated articular cartilage is due to the changes in the anisotropic component of T2. Further insights into the importance of the orientation-independent T2 measures will be gained once the remaining 20 samples have been measured and analyzed, including histological scorings. The present results already indicated that the orientation-independent anisotropic component of T2 relaxation may be more significantly connected to the biomechanical properties of cartilage than a single-orientation T2 relaxation time, and hence demonstrates a potential to serve as a biomarker for OA in the future, particularly upon establishing a clinically feasible measurement protocol.Acknowledgements
Support from the Academy of Finland (grant #325146) is gratefully acknowledged.
References
1 Chu CR, Williams AA, Coyle CH, Bowers ME. Early diagnosis to enable early treatment of pre-osteoarthritis. Arthritis Res. Ther. 2012;14 doi: 10.1186/ar3845.
2 Buckwalter JA, Mankin HJ. Articular cartilage. Part II: Degeneration and osteoarthrosis, repair, regeneration, and transplantation. J. Bone Jt. Surg. - Ser. A 1997;47:612–632 doi: 10.2106/00004623-199704000-00022.
3 Oei EHG, Van Tiel J, Robinson WH, Gold GE. Quantitative radiologic imaging techniques for articular cartilage composition: Toward early diagnosis and development of disease-modifying therapeutics for osteoarthritis. Arthritis Care Res. 2014;66:1129–1141 doi: 10.1002/acr.22316.
4 Ebrahimi M, Ojanen S, Mohammadi A, et al. Elastic, Viscoelastic and Fibril-Reinforced Poroelastic Material Properties of Healthy and Osteoarthritic Human Tibial Cartilage. Ann. Biomed. Eng. 2019;47:953–966 doi: 10.1007/s10439-019-02213-4.
5 Mosher TJ, Dardzinski BJ. Cartilage MRI T2 relaxation time mapping: Overview and applications. Semin. Musculoskelet. Radiol. 2004;8:366–369 doi: 10.1055/s-2004-861764.
6 Xia Y, Moody JB, Alhadlaq H. Orientational dependence of T2 relaxation in articular cartilage: A microscopic MRI (μMRI) study. Magn. Reson. Med. 2002;48:460–469 doi: 10.1002/mrm.10216.
7 Nieminen MT, Töyräs J, Rieppo J, et al. Quantitative MR microscopy of enzymatically degraded articular cartilage. Magn. Reson. Med. 2000;43:676–681 doi: 10.1002/(SICI)1522-2594(200005)43:5<676::AID-MRM9>3.0.CO;2-X.
8 Nissi MJ, Rieppo J, Töyräs J, et al. T2 relaxation time mapping reveals age- and species-related diversity of collagen network architecture in articular cartilage. Osteoarthr. Cartil. 2006;14:1265–1271 doi: 10.1016/j.joca.2006.06.002.
9 Li X, Benjamin Ma C, Link TM, et al. In vivo T1ρ and T2 mapping of articular cartilage in osteoarthritis of the knee using 3 T MRI. Osteoarthr. Cartil. 2007;15:789–797 doi: 10.1016/j.joca.2007.01.011.
10 Dunn TC, Lu Y, Jin H, Ries MD, Majumdar S. T2 relaxation time of cartilage at MR imaging: Comparison with severity of knee osteoarthritis. Radiology 2004;232:595–598 doi: 10.1148/radiol.2322030976.
11 Momot KI, Pope JM, Wellard RM. Anisotropy of spin relaxation of water protons in cartilage and tendon. NMR Biomed. 2010;23:313–324 doi: 10.1002/nbm.1466.
12 Hänninen N, Rautiainen J, Rieppo L, Saarakkala S, Nissi MJ. Orientation anisotropy of quantitative MRI relaxation parameters in ordered tissue. Sci. Rep. 2017;7:1–11 doi: 10.1038/s41598-017-10053-2.
13 Furman GB, Meerovich VM, Sokolovsky VL. Correlation of transverse relaxation time with structure of biological tissue. J. Magn. Reson. 2016;270:7–11 doi: 10.1016/j.jmr.2016.06.018.
14 Pang Y, Palmieri-Smith RM, Malyarenko DI, Swanson SD, Chenevert TL. A unique anisotropic R2 of collagen degeneration (ARCADE) mapping as an efficient alternative to composite relaxation metric (R2-R1ρ) in human knee cartilage study. Magn. Reson. Med. 2019;81:3763–3774 doi: 10.1002/mrm.27621.
15 Klein S, Staring M, Murphy K, Viergever MA, Pluim JPW. Elastix: A toolbox for intensity-based medical image registration. IEEE Trans. Med. Imaging 2010;29:196–205 doi: 10.1109/TMI.2009.2035616.
16 Leskinen HPP, Hänninen N, Nissi MJ. Collagen fiber orientation and anisotropy mapping of articular cartilage via T2 relaxation anisotropy. Proc. Int. Soc. Magn. Reson. Med. 2020.
17 Hayes WC, Keer LM, Herrmann G, Mockros LF. A mathematical analysis for indentation tests of articular cartilage. J. Biomech. 1972;5:541–551 doi: 10.1016/0021-9290(72)90010-3. 18 Huttu MRJ, Puhakka J, Mäkelä JTA, et al. Cell-tissue interactions in osteoarthritic human hip joint articular cartilage. Connect. Tissue Res. 2014;55:282–291 doi: 10.3109/03008207.2014.912645.
Figures