4368
Relaxation Anisotropy Mapping of Articular Cartilage at 3 T1Research Unit of Health Science and Technology, University of Oulu, Oulu, Finland, 2Medical Research Center, University of Oulu, Oulu, Finland, 3University of Eastern Finland, Kuopio, Finland, 4Department of Diagnostic Radiology, University of Oulu, Oulu, Finland
Synopsis
Keywords: Cartilage, Relaxometry, Relaxation anisotropy
The study of T2 and T1ρ anisotropy in musculoskeletal tissues, arising from the orientation of collagen fibrils in tissue, has so far been limited to experimental MRI systems. Here we present a method for measuring relaxation anisotropy ex vivo on a clinical MRI system. Furthermore, we aimed to quantify and compare the degrees of orientation dependence in bovine articular cartilage through anisotropy mapping. T2 and T1ρ mapping was performed on bovine stifle joint samples at multiple sample orientations. After coregistration anisotropy maps were created using Michelson contrast. The results showed large variations in anisotropy across cartilage thickness and topographical locations.Introduction
The anisotropy of different relaxation parameters, such as T1ρ and T2, in articular cartilage has been reported previously [1,2,3]. While often considered a source of measurement artifact, relaxation anisotropy can also be used to obtain relevant information on tissue ultrastructure [4]. With a broad sampling of cartilage orientations, the degree of anisotropy can be estimated and mapped within the scanned sample. So far this type of quantitative analysis has been limited to small osteochondral samples in pre-clinical MRI environments [3]. This study aims to both quantify and compare the anisotropy of T2 and T1ρ in bovine articular cartilage measured with a clinical MRI device.Methods
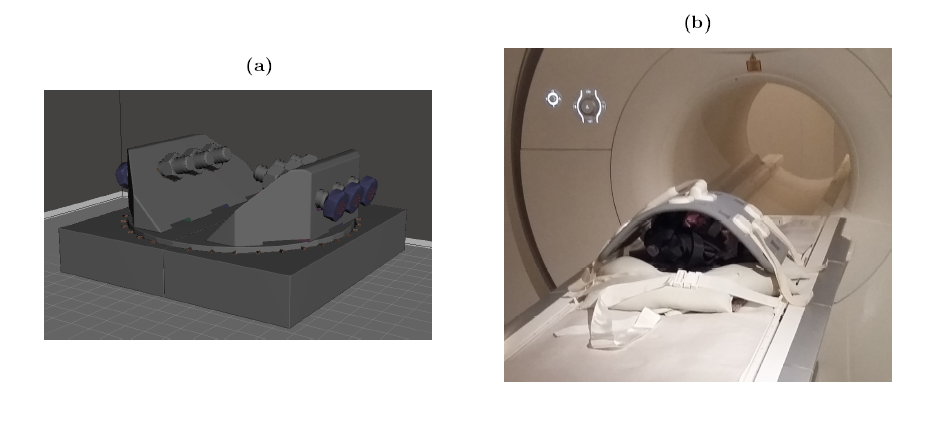
Eight bovine stifle joint samples were imaged using a 3 T whole body MRI scanner (MAGNETOM Skyra, Siemens Healthcare) with an 18-channel transceiver coil. Initial sample orientation was chosen to simulate a patient lying feet first on a sagittal plane on the patient bed. A single 3-mm thick imaging slice with an in-plane resolution of 0.52 × 0.52 mm2 was scanned from either medial or lateral condyle of each sample. The study used four imaging protocols: T2-weighted multi-echo spin-echo (MESE-T2) sequence with ETL = 12 and echo spacing of 10.7 ms; two continuous-wave T1ρ (CW-T1ρ) sequences with spin lock frequencies of 300 and 500 Hz, and 5 spin-lock durations of 0, 20, 40, 60 and 80 ms; adiabatic T1ρ (Ad-T1ρ) with hyperbolic secant pulses (HS4, with maximum spin-lock frequency of 600 Hz) and 5 spin-lock durations of 0, 24, 48, 76 and 96 ms, utilizing a gradient echo readout (TE = 3.43 ms, flip angle = 15°, segments = 11) [5]. Each measurement sequence used 3 averages per scan and TR = 3.5 s. Each sample was scanned using a single measurement protocol at 22 different orientations from 0 to 200°. Sample reorientation between measurements was performed manually using a 3D-printed sample rotation platform (Figure 1 a). The rotation platform itself was fixed onto the patient bed of the MRI device during measurements (Figure 2 b). The scan time of a single orientation varied between 5 and 10 minutes depending on the sequence, and the total scan time of a single sample was on average 4 hours. The obtained image sets from each sample were coregistered using Elastix [6,7]. After coregistration, relaxation time maps were calculated at each sample orientation by fitting the corresponding monoexponential relaxation function pixel-wise to the echo or spin-lock sequences. Anisotropy maps were then created from these maps through the calculation of pixel-by-pixel anisotropy values (A) using the Michelson contrast [2,8] $$ A = (T_{max}-T_{min})/(T_{max}+T_{min}), $$ where Tmax and Tmin describe the maximum and minimum relaxation time values from the series of relaxation time maps measured at different orientations.Results
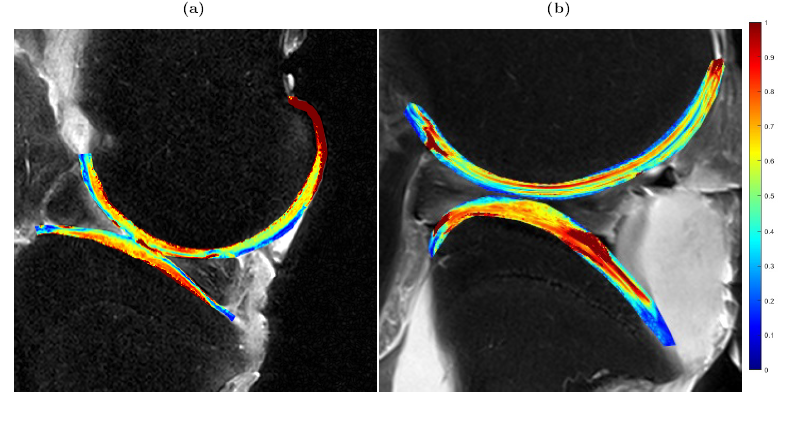
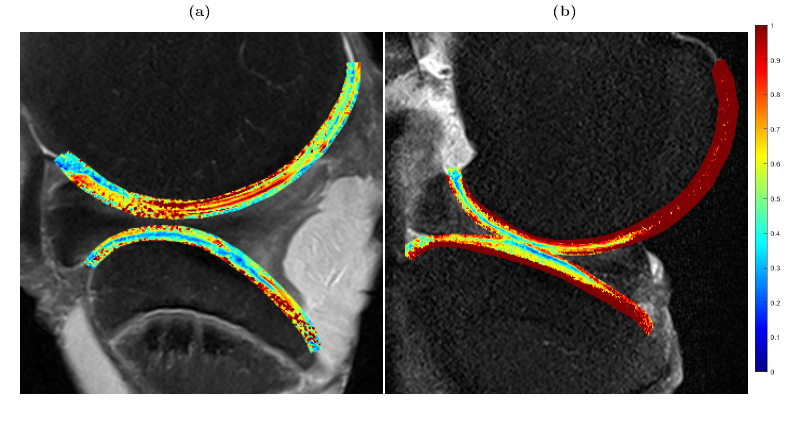
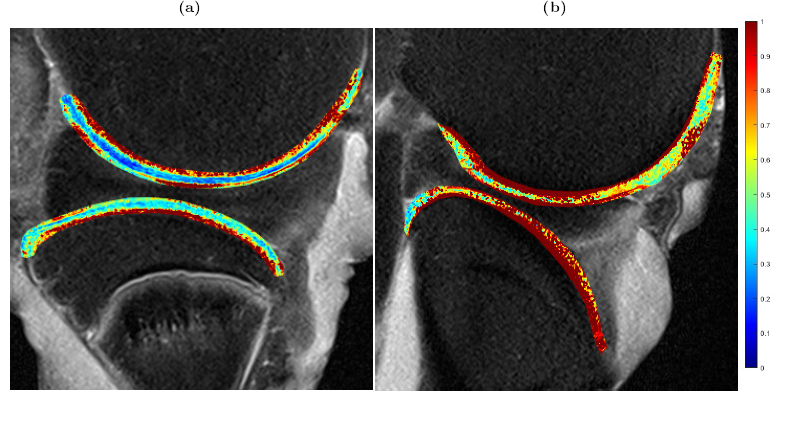
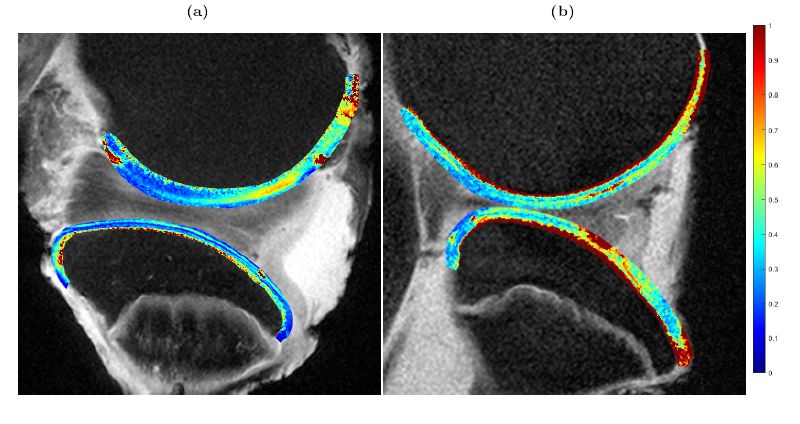
The eight anisotropy maps (Figures 2-5) demonstrate large intra- and inter-sample differences in the anisotropy values of the studied cartilage. The largest and most consistent depth-dependent variations in anisotropy values were found in T2 (Figure 2). In these maps, the anisotropy was consistently higher in deep cartilage layers compared those near the surfaces. The anisotropy maps based on CW-T1ρ (300 Hz) and CW-T1ρ (500 Hz) (Figures 3 and 4) demonstrated depth-dependent variations in only a subset of cartilage surfaces (femoral cartilage of Figure 3 a, and tibial cartilage of 3 b). Lower spin-lock frequency maps (Figure 3) displayed both larger average values and more prominent depth-dependence of anisotropy. Maps 3b and 4b also displayed large portions of cartilage with relaxation parameters being 100% anisotropic. The anisotropy maps based on Ad-T1ρ (Figure 5) display low amounts of anisotropy across all layers of both femoral and tibial cartilage.Discussion
The variation in relaxation parameter anisotropy corresponds to the expected collagen anisotropy in the joint across cartilage depth and topographical location. T2 was found to demonstrate stronger anisotropy compared to T1ρ. Furthermore, the anisotropy values of CW-T1ρ were higher using a spin-lock frequency 300 Hz compared to 500 Hz. Adiabatic T1ρ preparation displayed the lowest anisotropy and was found to be invariant to cartilage location. These finding coincide well with the existing literature [3,9,10]. Coregistration of relaxation time maps was suboptimal in some cases, leading to the unexpectedly large anisotropy values in certain maps, underlining the importance of sample positioning during measurement. Whole joint anisotropy mapping at 3 T, as demonstrated in this study, can provide valuable insight into the spatial and topographical variation of collagen-related relaxation anisotropy in excised joints. While this study focused solely on ex vivo samples, the performed measurements offered valuable experience in handling and positioning of large samples in a clinical MRI scanner. Translating this method to in vivo studies is, in the author's opinion, possible although further research is required to ensure accurate sample orientation and coregistration during said measurements.Acknowledgements
No acknowledgement found.References
[1] R. M. Henkelman, G. J. Stanisz, J. K. Kim, and M. J. Bronskill. "Anisotropy of NMR properties of tissues". eng. Magnetic Resonance in Medicine 32.5 (Nov. 1994), pp. 592-601. issn: 0740-3194.
[2] N. Hänninen, J. Rautiainen, L. Rieppo, S. Saarakkala, and M. J. Nissi. "Orientation anisotropy ofquantitative MRI relaxation parameters in ordered tissue". en. Scientific Reports 7.1 (Dec. 2017), p. 9606. issn: 2045-2322.
[3] N. E. Hänninen, T. Liimatainen, M. Hanni, O. Gröhn, M. T. Nieminen, and M. J. Nissi. "Relaxation anisotropy of quantitative MRI parameters in biological tissues". Scientific Reports 12.1 (July 2022).Publisher: Springer Nature, pp. 1-11. issn: 20452322.
[4] M. Bydder, A. Rahal, G. D. Fullerton, and G. M. Bydder. "The magic angle effect: A source of artifact, determinant of image contrast, and technique for imaging". en. 25.2 (Feb. 2007), pp. 290-300. issn: 10531807, 15222586.
[5] M. Garwood and L. DelaBarre. "The Return of the Frequency Sweep: Designing Adiabatic Pulses for Contemporary NMR". en. Journal of Magnetic Resonance 153.2 (Dec. 2001), pp. 155-177. issn:10907807.
[6] S. Klein, M. Staring, K. Murphy, M. Viergever, and J. Pluim. "elastix: A Toolbox for Intensity-Based Medical Image Registration". en. IEEE Transactions on Medical Imaging 29.1 (Jan. 2010), pp. 196-205.issn: 0278-0062, 1558-254X.
[7] D. Shamonin. "Fast parallel image registration on CPU and GPU for diagnostic classification ofAlzheimer's disease". en. Frontiers in Neuroinformatics 7 (2013). issn: 16625196.2
[8] J. Rieppo, J. Hallikainen, J. S. Jurvelin, I. Kiviranta, H. J. Helminen, and M. M. Hyttinen. "Practical considerations in the use of polarized light microscopy in the analysis of the collagen network in articularcartilage". en. Microscopy Research and Technique 71.4 (2008), pp. 279-287. issn: 1097-0029.
[9] Y. Xia and K. I. Momot. Biophysics and Biochemistry of Cartilage by NMR and MRI. eng. 2016.
[10] M. T. Nieminen, J. Töyräs, M. S. Laasanen, J. Silvennoinen, H. J. Helminen, and J. S. Jurvelin."Prediction of biomechanical properties of articular cartilage with quantitative magnetic resonanceimaging". en. Journal of Biomechanics 37.3 (Mar. 2004), pp. 321-328. issn: 00219290.3
Figures