4367
Automated Principal Component Analysis of cartilage thickness, T2 times and bone shape as interpretable model for osteoarthritis progression1Radiology, Center for Intelligent Imaging, UCSF, San Francisco, CA, United States
Synopsis
Keywords: Osteoarthritis, Cartilage
In this study we used fully automatic segmentations of the bones and the cartilage of the knee to perform a principal component analysis of cartilage thickness, T2-relaxation times and bone shapes in the Osteoarthritis Initiative Dataset. We extracted and visualized the principal components which significantly contributed to a model for prediction of osteoarthritis progression to (i) show that besides mean values of these parameters also their distribution is crucial for osteoarthritis progression and (ii) prove the feasibility of visual interpretation of these components for better understanding factors associated with the disease.Introduction
Osteoarthritis (OA) of the knee is a highly prevalent chronic condition with marked implications for affected individuals and public health care. While some risk factors for OA are well known, it is still difficult to predict why certain individuals maintain healthy knees until high age, while others develop OA. MR imaging allowed for a more comprehensive understanding of structural OA and recent studies revealed associations between T2-relaxation times as well as cartilage thickness and incident cartilage lesions [1, 2]. Nevertheless, recent studies showed that not only mean values, but also distribution of cartilage thickness and T2-relaxation times within the knee might play an important role in OA [3]. Additionally, bone shape measured on radiographs seems to mediate the relationship between sex and incident knee osteoarthritis [4].In this study, we therefore aim to develop an interpretable fully automated model to predict the progression of OA based on MR images using principal component analysis of cartilage thickness, T2-relaxation times as well as bone shape, and to interpret the different principal components which significantly correlate with the progression of OA to better understand the development of the disease.Methods
This study is based on data from the Osteoarthritis Initiative (OAI), a longitudinal, multi-center cohort study including clinical information and knee MRIs at baseline (BL) as well as radiographs at BL, 12-, 24-, 36-, 48- 72- and 96-month follow-up of 4796 individuals. Automatic segmentations of the femur, the tibia and the patella in the knee as well as the cartilage of those bones was performed on the entire OAI dataset as reported previously by our group [5]. To reduce dimensions of those parameters, principal component analysis of cartilage thickness, cartilage T2-values and bone shape was performed [6]. Based on this method, 10 modes were developed for each of the 3 parameters and each bone/cartilage of the knee, resulting in a total of 90 different modes used for further statistical analysis. The first mode represents the mean increase/decrease of the parameter.Only right knees of participants including T2-relaxation time-measurements at BL were included. Participants from the OAI (n=4796) with progress of KL at any timepoint were assigned to the progression cohort (n=871; 8 year follow up radiograph was not required as OA is irreversible) and participant with an 8 year follow up scan and constant KL throughout the study period were assigned the control cohort (n=1274). The processing pipeline and the inclusion criteria are shown in Figure 1.Prediction of the progression of OA within 8 years was assessed using logistic regression. Therefore, the dataset was randomly split into training (75%) and test set (25%). Prediction of progression of OA was performed on the test set. Furthermore, parameters which significantly contribute to the model were determined for visual interpretation.Results
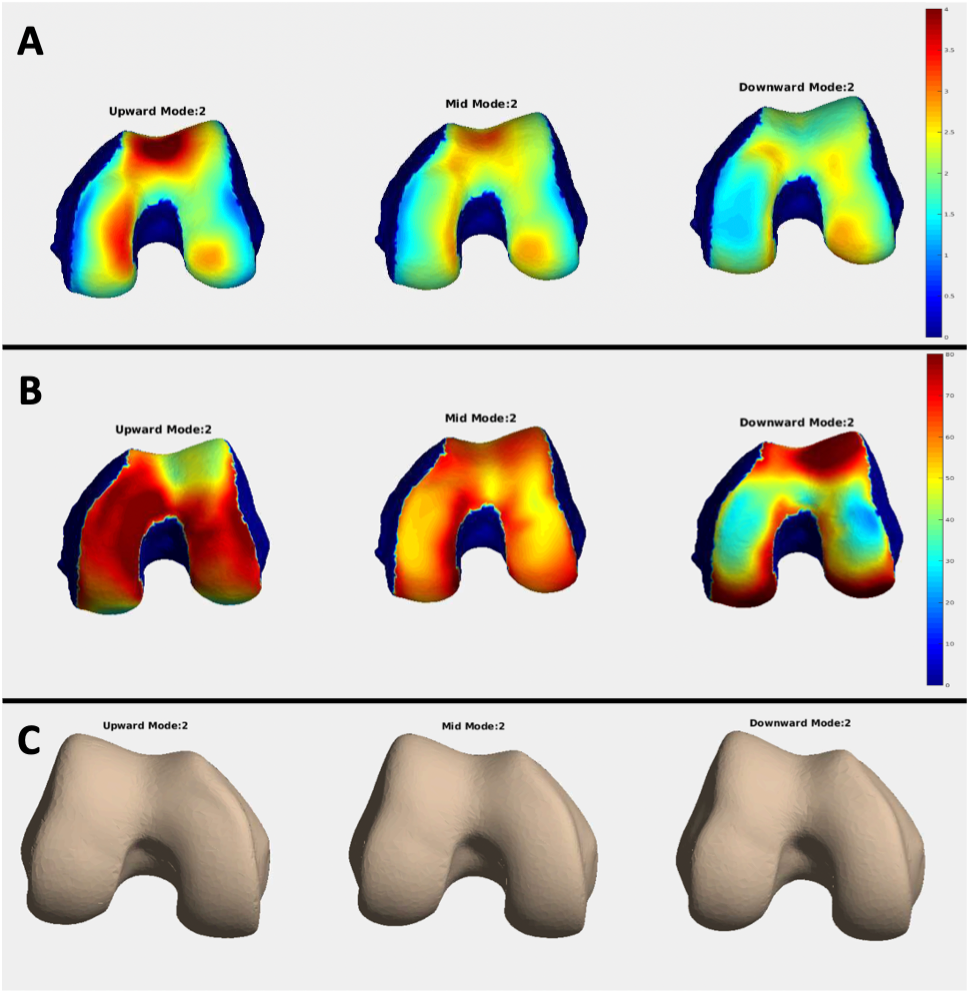
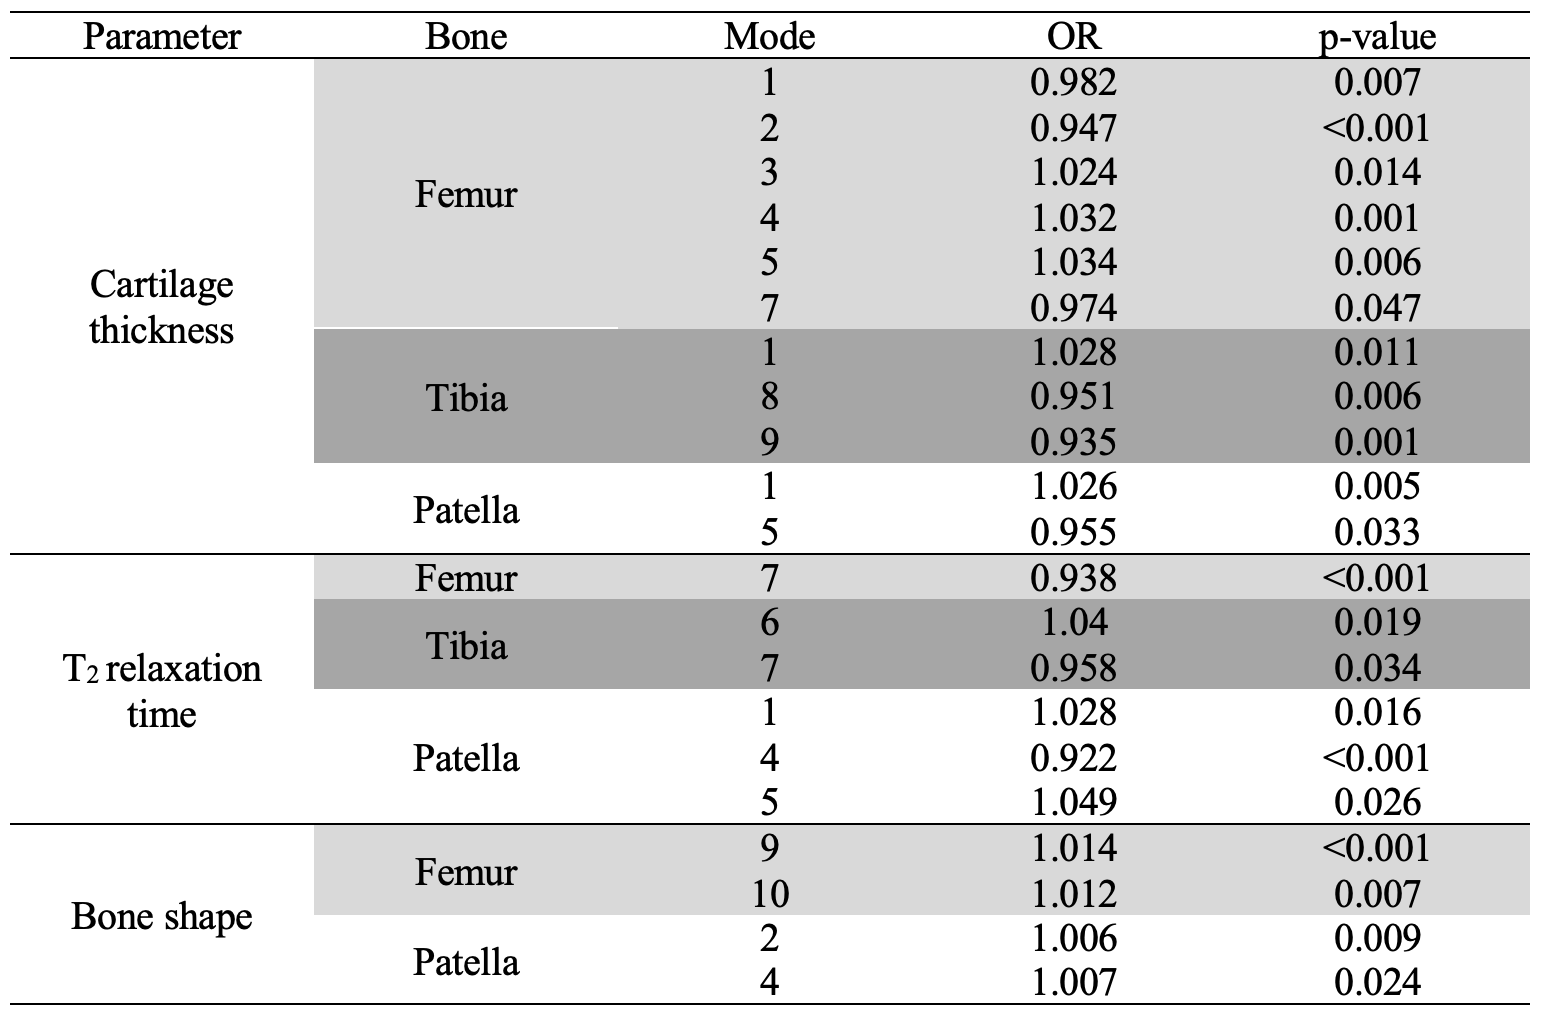
The test set included 512 subjects, 202 from the progression cohort and 310 from the control cohort. Using the 90 principal components of the cartilage thickness, T2-values and the bone shape, the model predicted the progression of OA with an accuracy of 0.69 (sens/spec/PPV/NPV=0.53/0.79/0.62/0.72). The confusion matrix of the model performance on the test set is shown in Figure 1E. Parameters which significantly contributed to the prediction model were extracted. In total 21 of the 90 principal components significantly contributed to the model with 11 components for cartilage thickness, 6 for T2-relaxation times and 4 for the bone shape. Odds ratios and level of significance of those parameters are summarized in Table 1. Visual analysis has shown that the trochlea and the weight-bearing region of the lateral condyle of the femur, the central regions of the tibia and a central horizontal stripe in the patella are important regions for predicting the progression of OA. Exemplary images of one mode for the principal components of each parameter are shown in Figure 2.Discussion
Overall, this study provides a fully automated model to analyze principal components of cartilage thickness, T2-relaxation times of the cartilage and bone shapes in the knee for a more comprehensive understanding and prediction of the progression of OA in the knee. Furthermore, our results prove, that besides mean values of these parameters, distribution plays an important role in the progression of OA. In addition to that, we could show, that not only mean values of these parameters help predict the progression of OA, but also the distribution of these parameters is contributing to the progression of the disease. If using Task-Based UltraFast MRI for simultaneous image reconstruction and tissue segmentation, our model could be leveraged for contributing to a quick prediction-tool for OA [7]. This could serve as both, impulse for early preventive measurements in patients at risk of developing OA as well as inclusion criteria for clinical studies. Future research should further analyze contribution of different principal components to the model as well as the prediction of OA and give clinical interpretations of their characteristics to better understand morphological factors leading to OA in the knee.Conclusion
We have proven the feasibility of using a fully automated model based on Principial Component Analysis of cartilage thickness, T2-values and bone shape for visual interpretation of factors correlating to OA progression, which could also contribute to an OA prediction tool.Acknowledgements
This project was supported by the grants R01AR078762, R33AR073552 and R00AR070902 (NIH).References
1.) Kretzschmar, M., et al., Spatial distribution and temporal progression of T2 relaxation time values in knee cartilage prior to the onset of cartilage lesions - data from the Osteoarthritis Initiative (OAI). Osteoarthritis Cartilage, 2019. 27(5): p. 737-745.2.
2.) Deveza, L.A., et al., Trajectories of femorotibial cartilage thickness among persons with or at risk of knee osteoarthritis: development of a prediction model to identify progressors. Osteoarthritis Cartilage, 2019. 27(2): p. 257-265.3.
3.) Eckstein, F., et al., Magnitude and regional distribution of cartilage loss associated with grades of joint space narrowing in radiographic osteoarthritis--data from the Osteoarthritis Initiative (OAI). Osteoarthritis Cartilage, 2010. 18(6): p. 760-8.4.
4.) Wise, B.L., et al., Bone shape mediates the relationship between sex and incident knee osteoarthritis. BMC Musculoskelet Disord, 2018. 19(1): p. 331.5.
5.) Gao, K.T., et al., Multiparametric MRI characterization of knee articular cartilage and subchondral bone shape in collegiate basketball players. J Orthop Res, 2021. 39(7): p. 1512-1522.6.
6.) Calce, S.E., et al., Principal component analysis in the evaluation of osteoarthritis. Am J Phys Anthropol, 2017. 162(3): p. 476-490.7.
7.) Calivá, F., et al., Breaking Speed Limits with Simultaneous Ultra-Fast MRI Reconstruction and Tissue Segmentation, in Proceedings of the Third Conference on Medical Imaging with Deep Learning, A. Tal, et al., Editors. 2020, PMLR: Proceedings of Machine Learning Research. p. 94--110.
Figures
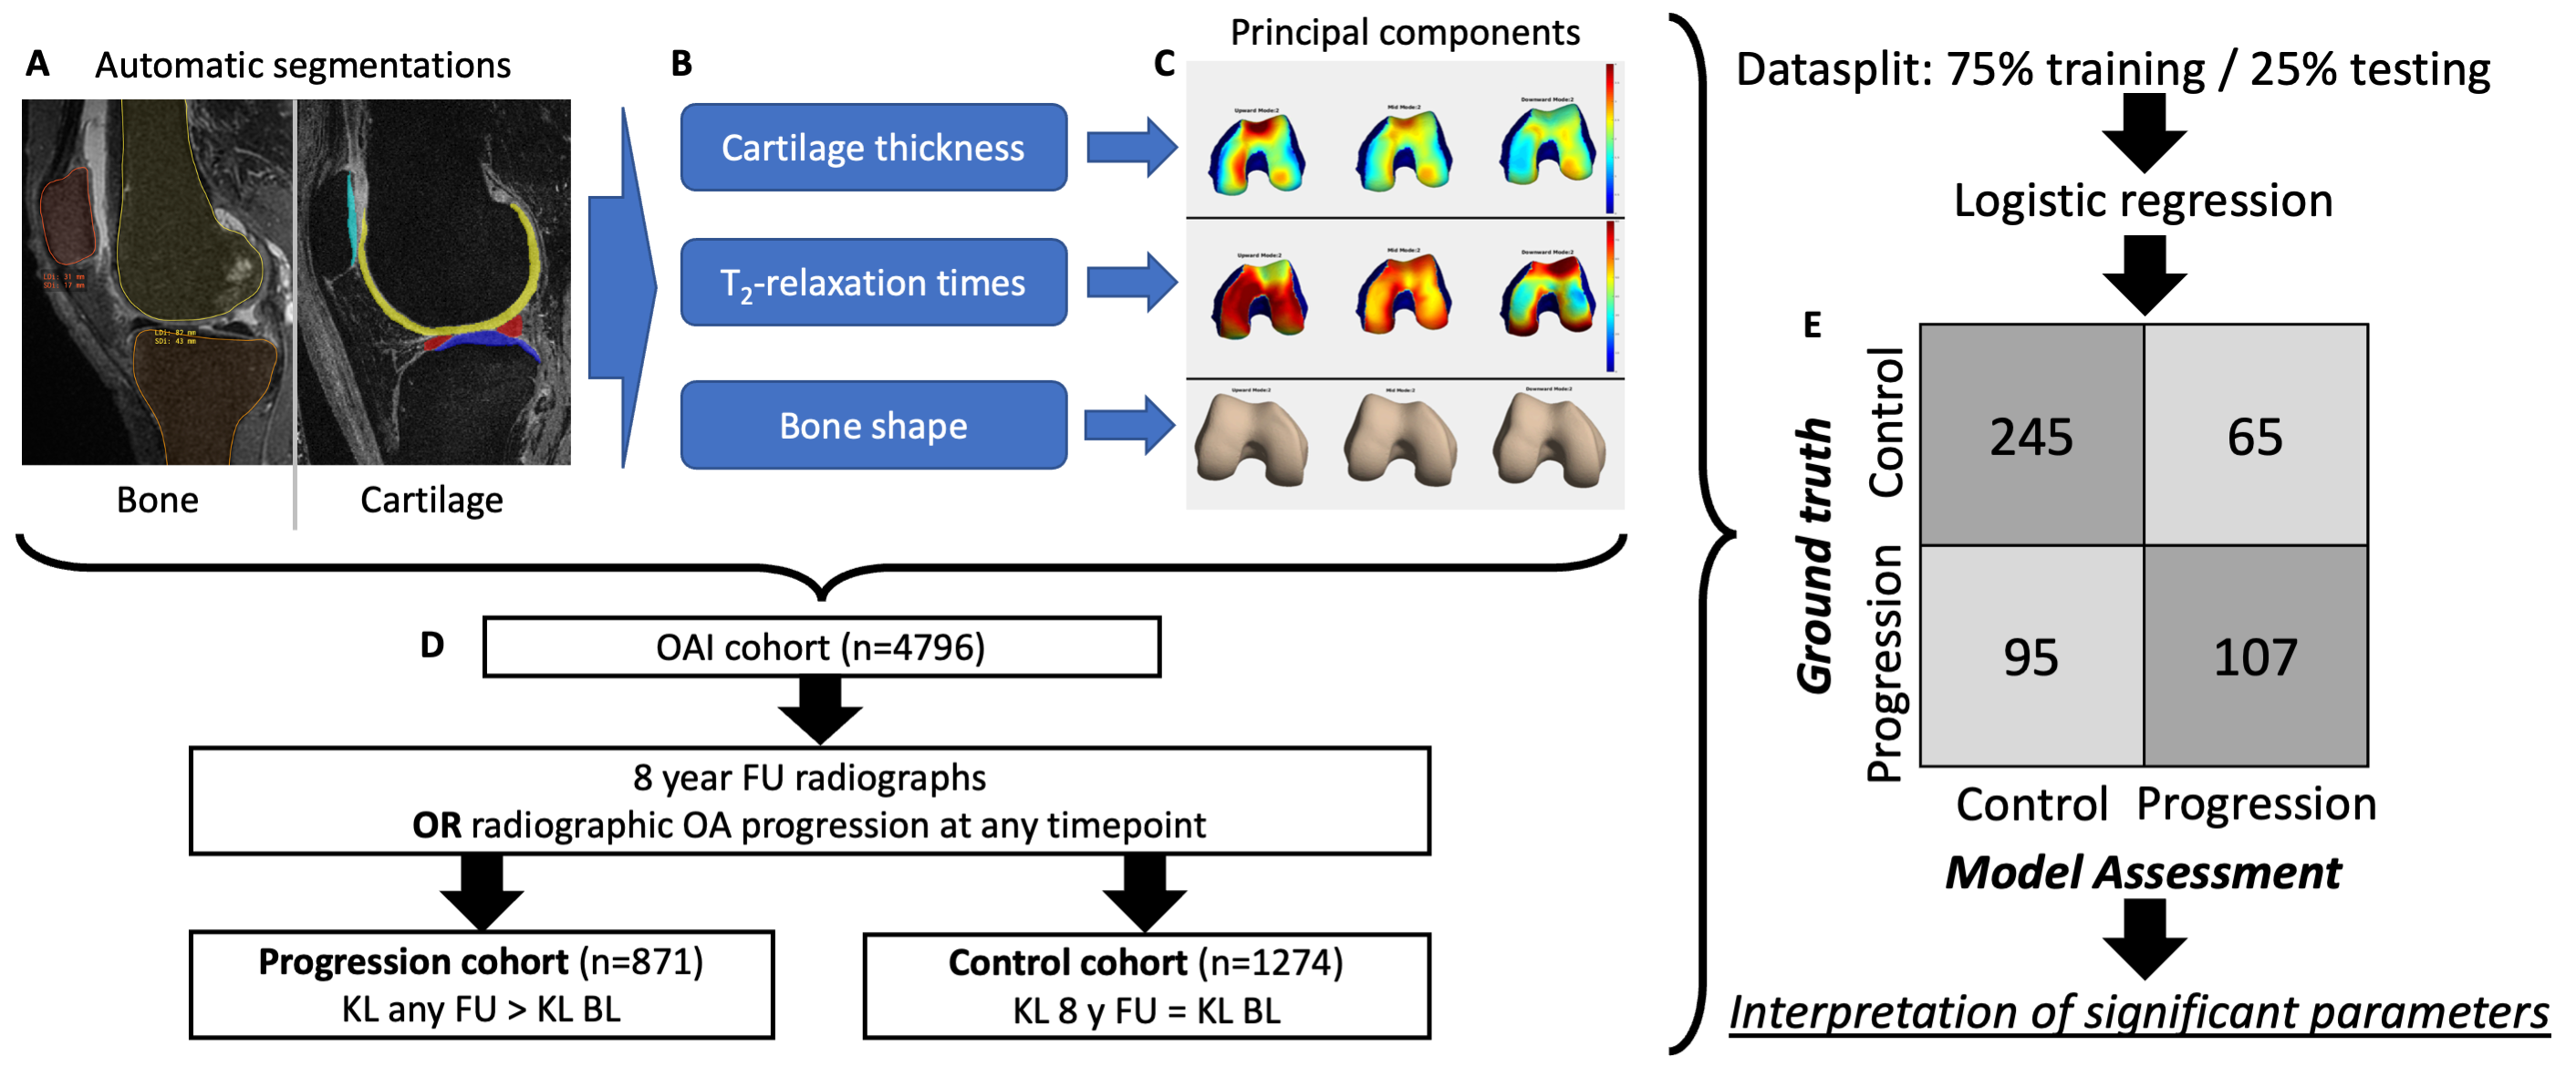
Automatic segmentations of the bones and the cartilage of the knee were performed on MR images of the knee (A). Values for the cartilage thickness, the T2-relaxation times and the bone shapes were extracted (B). Next, principal component analysis was performed resulting in a total of 90 modes (C). Participants with progress of KL were assigned to the progression cohort and participants with constant KL over 8 years were assigned to the control cohort (D). Logistic regression was performed and the significant principal components visually interpreted (E)