4363
An application of parallel imaging and deep-learning reconstructed T2 mapping in nasal cartilage1GE Healthcare, Beijing, China, 2Department of Radiology, Renmin Hospital of Wuhan University, Wuhan, China
Synopsis
Keywords: Cartilage, Cartilage
Rhinoplasty is a reversible surgery; MRI became a non-invasive post-surgery tracking approach to assess the influence of implant-compressed on nasal cartilage such as mechanical stress, cellular organization and tissue degeneration, etc. Widely-used T2 mapping in musculoskeletal imaging such as knee, shoulder and pelvics takes long acquisition time and thus deters clinical utility. With greater number of multi-channel coils and parallel imaging techniques, scan time shortens but noise enhances. With the additional deep-learning reconstruction, T2 mapping with parallel imaging was stable with small RMS CV% = 0.077% to parallel imaging only image data sets.Introduction
Rhinoplasty attracts people worldwide, but individuals often regret and receive implant removal surgery. Appearance is first thought to be care about; however, the function compressed nose cartilage and surrounding tissue such as tissue degeneration, microstructure organization and mechanical support is often unknown after decompression. Evaluation of mechanical characteristics of cartilage by magnetic resonance imaging (MRI) would provide a noninvasive measure of tissue quality both for tissue engineering and when monitoring clinical response to therapeutic interventions for cartilage degradation. A study using 12-minute Carr-Purcell-Meiboom-Gill imaging showed good accuracy in predicting nasal stiffness.[1] T2 mapping also has been widely applied in musculoskeletal imaging such as knee, shoulder and spine; [2-4] however, long acquisition time and low spatial resolution discourage clinical implement. Parallel imaging techniques such as image-based (i.e., ASSET, SENSE, mSENSE) and k-space-based (i.e., ARC, GRAPPA) reduces acquisition time but accompany increased residual aliasing and noise enhancement as acceleration factor is elevated. Our study aimed to explored the feasibility of combination of parallel imaging and deep learning based reconstructed T2 mapping in nasal cartilage.Materials and methods
We prospectively recruited 11 normal subjects in the hospital from May to September 2022. All subjects underwent one-time multi-echo spine echo sequence (TR=768 ms, TE =8.464-67.712 ms with an interval of 3.96 ms, in-plane resolution = 0.2734×0.2734, thickness =2 mm, acceleration factor = 2) on 3.0 T MRI (Signa Architect, GE Healthcare) with 19-channel head and neck coil. Original T2 maps (T2ori) and inline ARDL (AIRTM Recon DL, GE Healthcare) reconstructed T2 maps (T2DL) were generated. One ROIs were delineated in the selected slice itself and the upper and lower slices and averaged. All data were presented in mean±standard deviation (xˉ±s). The reproducibility of quantitative values between scans were analyzed using the root-mean-square coefficient-of-variation (RMS CV%). Paired sample t-test or Wilcoxon signed test was used for comparison between groups according normality and equality-of-variances respectively examined by Kolmogorov-Smirnov test and Levene's-Test. P<0.05 was considered statistically significant.Results
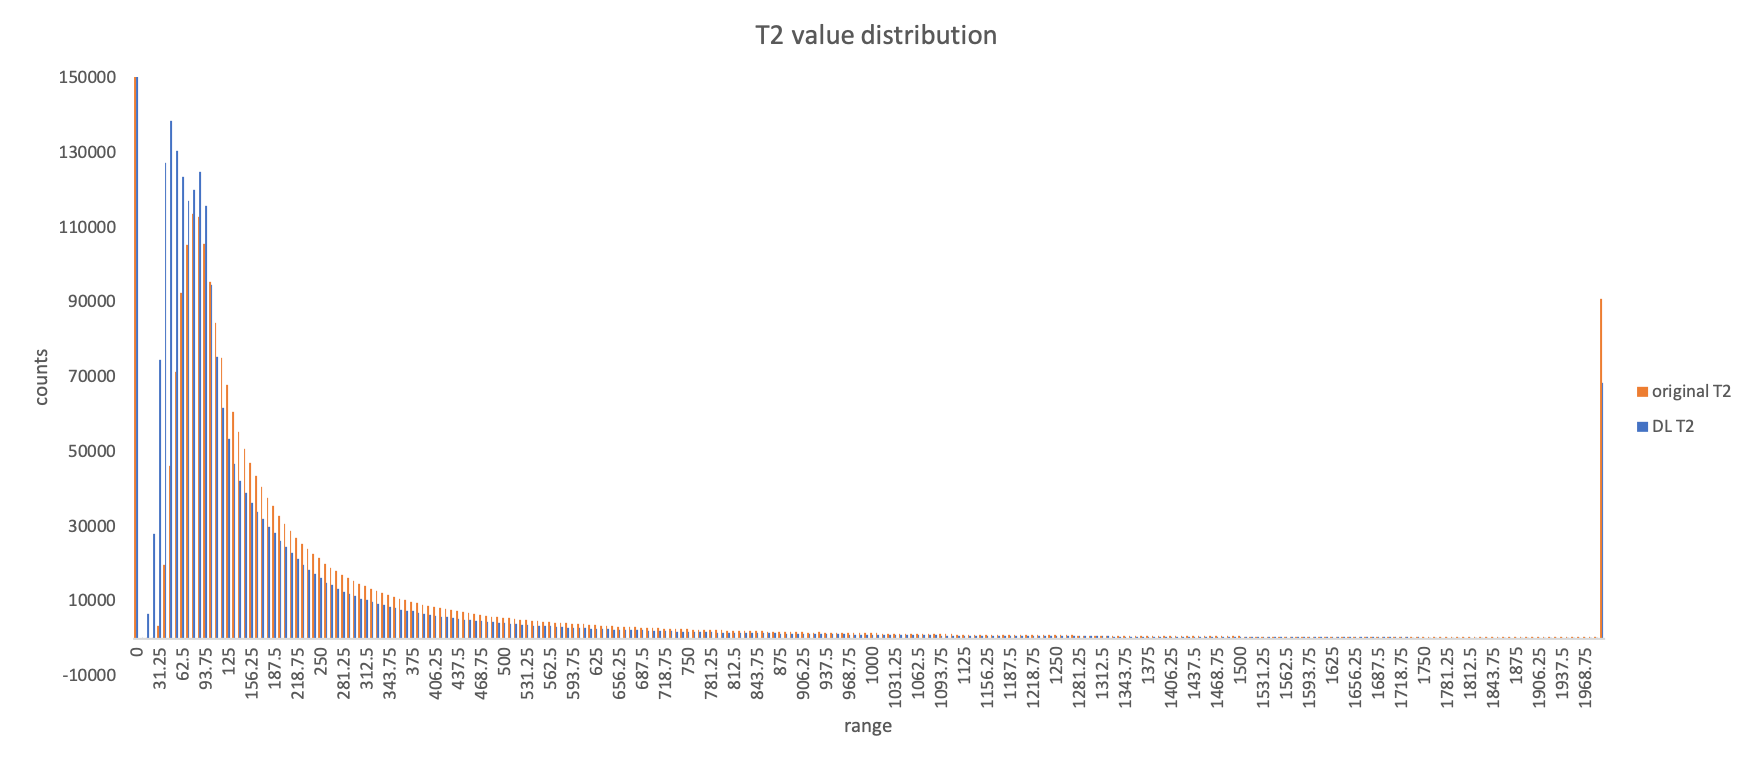
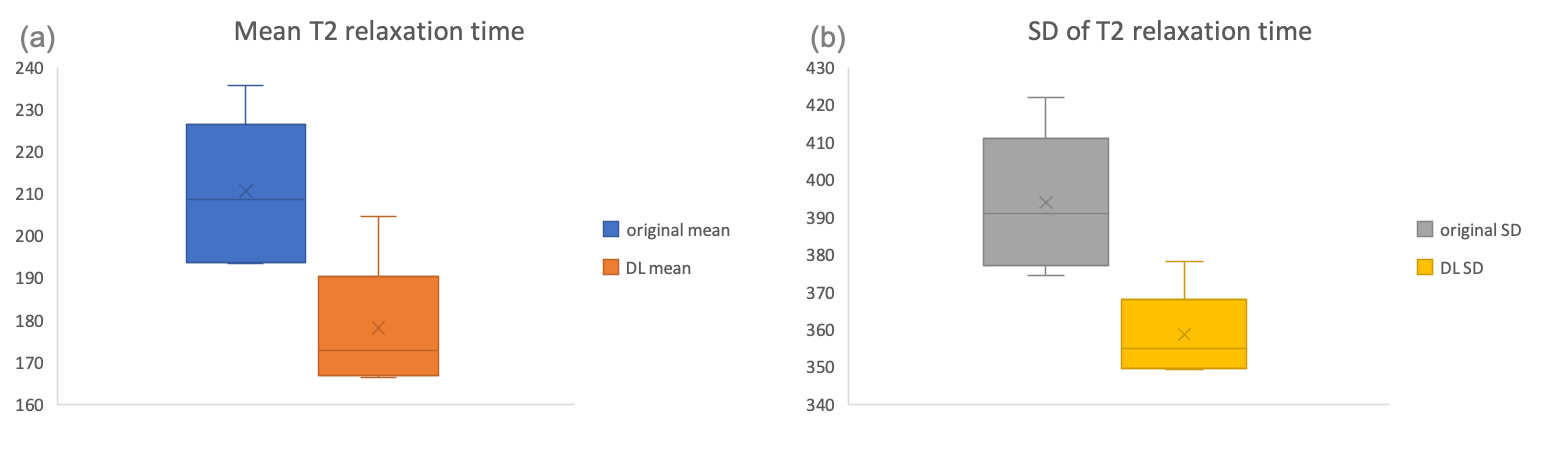
One data was excluded for analysis for obvious displacement during image acquisition. The distribution of T2 relaxation time between T2ori and T2DL maps was shown in Figure 1 and RMS CV% was 20.415%. For T2 values of the whole image data sets, the mean and standard deviation of the original ones were 210.57±16.988 ms and 393.864±18.385 ms while those of ARDL ones were 178.117±15.017 and 385.617±11.430 ms (Figure 2). The ROI-derived T2ori and T2DL values of nasal alar cartilage were 82.555±12.278ms and 75.877±5.681 ms and showed significantly different (P<0.05) and %CV of 33.696%.Discussion
We firstly presented parallel imaging and deep-learning reconstructed T2 mapping for a total acquisition time of 5'43'' with less artifact and noise. ARDL T2 maps showed smaller SD than original T2 maps but larger RMS CV%, indicating deep-learning reconstructed reduced parallel imaging-induced noise enhancement and shorter image acquisition time reduced possibility of a patient's involuntary movement. To some extent, deep-learning can compensate missing information for under sampling k space as other study. [5] However, it is necessary to adopt conventional T2 mapping without any acceleration techniques or with different acceleration factors of parallel imaging technique in validation of T2 values in nasal alar cartilage. An appropriate mapping cartilage using both parallel imaging and deep-learning reconstruction needs to be established for clinical utility at ease and convenience.Conclusions
Deep-learning reconstruction elevated image quality of T2 mapping using parallel imaging technique (i.e., ARC, GRAPPA) and highly-potentially produced reliable T2 values for clinic utility in reflection of cartilage mechanical properties (i.e., stiffness).Acknowledgements
No acknowledgement found.References
1. Hu J, Zhang Y, Duan C, et al. Feasibility study for evaluating early lumbar facet joint degeneration using axial T1 ρ, T2 , and T2* mapping in cartilage. J Magn Reson Imaging. 2017 Aug;46(2):468-475. doi: 10.1002/jmri.25596.
2. Eijgenraam SM, Chaudhari AS, Reijman M,et al. Time-saving opportunities in knee osteoarthritis: T2 mapping and structural imaging of the knee using a single 5-min MRI scan. Eur Radiol. 2020 Apr;30(4):2231-2240. doi: 10.1007/s00330-019-06542-9.
3. Tao H, Qiao Y, Hu Y,et al. Quantitative T2-Mapping and T2⁎-Mapping Evaluation of Changes in Cartilage Matrix after Acute Anterior Cruciate Ligament Rupture and the Correlation between the Results of Both Methods. Biomed Res Int. 2018 May 17;2018:7985672. doi: 10.1155/2018/7985672.
4. Irrechukwu ON, Thaer SV, Frank EH,et al. Prediction of cartilage compressive modulus using multiexponential analysis of T(2) relaxation data and support vector regression. NMR Biomed. 2014 Apr;27(4):468-77. doi: 10.1002/nbm.3083.
5. Chen Y, Fang Z, Hung SC, et al. High-resolution 3D MR Fingerprinting using parallel imaging and deep learning. Neuroimage. 2020 Feb 1;206:116329. doi: 10.1016/j.neuroimage.2019.116329.
6. Canal Guterl C, Hung CT, Ateshian GA. Electrostatic and non-electrostatic contributions of proteoglycans to the compressive equilibrium modulus of bovine articular cartilage. J Biomech. 2010 May 7;43(7):1343-50. doi: 10.1016/j.jbiomech.2010.01.021.
Figures