4362
A single-sided NMR approach to study structural differences of the articular cartilage tissue1Department of Physics and Astronomy "Augusto Righi", University of Bologna, 40127 Bologna, Italy, 2Department of Civil, Chemical, Environmental, and Materials Engineering, University of Bologna, 40134 Bologna, Italy
Synopsis
Keywords: Cartilage, Relaxometry, Single-sided NMR
In the last decade, few preliminary low-field relaxometry studies were conducted on the articular cartilage using the single-sided NMR-MOUSE device that can be useful for osteoarthritis characterization. This study aims to develop a procedure capable of quantitatively evaluating the structure of the three cartilage layers.
Forty osteochondral cylindrical bovine knee specimens were analyzed obtaining four NMR parameters T1, T2, D, and α (extracted from a Double-Quantum-like sequence for solid/liquid estimation) for each cartilage layer.
Significant discrimination of the three layers was found by all the parameters, making the NMR dataset sensitive to structural differences and changes due to cartilage diseases.
Introduction
Many cartilage studies aim to establish the relationships between the composition, structure, and properties of healthy tissue, and to determine changes associated with pathologies and aging1. Osteoarthritis (OA), for example, is a common degenerative musculoskeletal disease characterized by the destruction of articular cartilage and pathophysiological changes in the underlying subchondral bone2. Low-field single-sided NMR provides an appealing approach for the assessment of both soft and mineralized tissue properties3. In the last decade, few preliminary studies4 have been conducted on the articular cartilage using the NMR-MOUSE device5. However, literature results on these topics are still limited, especially concerning the role of the dehydration phenomenon. Moreover, NMR procedures, from which quantitative NMR parameters for each cartilage layer (i.e., superficial, middle, and deep) can be obtained, have not yet been defined.This study aims to quantify the role of cartilage dehydration and develop a procedure capable of quantitatively evaluating the structure of the three cartilage layers.
Methods
Forty osteochondral cylindrical specimens (∅ = 10mm, h = 10mm) were extracted from knees articular surfaces of skeletally mature bovine. NMR measures were performed using the single-sided Profile NMR-MOUSE PM10 by Magritek (Figure 1a).Four NMR pulse sequences were explored: CPMG, Saturation Recovery, Stimulated Spin Echo, and build-up Double-Quantum-like sequences. This last has already been used to study elastomers6,7, and we optimized the sequence parameters for studying the cartilage tissue.
The preliminary part of NMR measures was devoted to the choice of the experimental setup. It has been tried to reduce the dehydration phenomenon as much as possible by passing through three different setup configurations: S1, S2, and S3 (Figure 1b).
Then, the pulse sequences have been collected in a unique NMR procedure (Figure 2). The depth and thickness of the three cartilage layers were identified and four NMR parameters T1, T2, D, and α were obtained. Since T1, T2 and D distributions had mono-exponential behaviour, a single value from the exponential fit was considered. As regards Double-Quantum data analysis, we evaluated the trend of the magnetization build-up curve considering the signal increase rate α. We expected α to be related to collagen cross-links density.
A Kruskal-Wallis (KW) statistical test was performed choosing the False Discovery Rate as a multiple-testing correction to check for any differences in parameters between layers.
Results
Regarding the choice of the experimental setup, measurements showed a general decrease in NMR signal intensity and T2 during the first 10 hours (Figure 3). S3 and S2 achieved the best performance for preserving the initial state of the two parameters with S3 ahead. By performing diffusion profile measures, S3 showed an increase in the absolute value of D (26%) compared with S2 (data not shown). So, S3 minimized the dehydration of the cartilage but significantly influenced the measured D values due to interactions of Phosphate Buffered Saline solution with the NMR signal. For these reasons, S2 was preferred.The most promising results are related to the discrimination of superficial, middle, and deep cartilage layers (Figure 4). KW test results show P < 0.0001 in the middle-deep comparison and P < 0.0009 in the superficial-deep comparison for all the parameters; P < 0.005, P < 0.03 and P < 0.0001 in the superficial-middle comparison for D, T2, and α, respectively. Only T1 does not show significant differences in the superficial-middle layers comparison. A Principal Component Analysis empowers KW results (Figure 5).
Discussion
Understanding the role of cartilage dehydration during the time can be considered crucial because it would be desirable to analyze the tissue as close as possible to the in vivo situation. The observed decrease in NMR signal intensity and T2 suggests that dehydration leads to structural changes in the cartilage. The reduction of this phenomenon is of primary importance for this type of analysis.Moreover, the fact that T2, T1, D and α parameters can discriminate the three cartilage layers is strictly correlated to their anatomical characteristics. T2, T1, and D trends mainly depend on the concentration of water inside the matrix of collagen and proteoglycans, and the geometry of the confining space. Higher values in the superficial and middle layers are connected to the highest anisotropy of collagen fibrils and the highest water concentration in these zones. Minimum values in the deep zone, near calcified cartilage, are due to the lowest water content and very low mobility. Finally, α is a parameter sensitive to low-mobility protons like those of the proteoglycans or collagen amide groups. The rapid increase of α values passing from the superficial to the deep layers is related to the increase of collagen and proteoglycans content.
Conclusion
This work lays solid foundations for determining NMR peculiarities related to cartilage chemical-physical and structural features. It has been widely demonstrated in the literature that the mobility and content of water, the content of proteoglycans, and the collagen structure in the cartilage tissue are suitable indicators for OA severity. So, identifying these components through NMR parameters could pave the way for a procedure to evaluate cartilage changes due to cartilage diseases.Acknowledgements
The authors thank the Medical Technology Laboratory of the IRCCS Rizzoli Orthopaedic Institute of Bologna in particular Massimiliano Baleani and Matteo Berni for their collaboration in sample preparation.
References
1. Fantazzini P, Galassi F, Bortolotti V, Brown RJS, Vittur F. The search for negative amplitude components in quasi-continuous distributions of relaxation times: The example of 1H magnetization exchange in articular cartilage and hydrated collagen. New J Phys. 2011;13. doi:10.1088/1367-2630/13/6/065007
2. Muratovic D, Findlay DM, Cicuttini FM, et al. Bone marrow lesions in knee osteoarthritis: regional differences in tibial subchondral bone microstructure and their association with cartilage degeneration. Osteoarthr Cartil. 2019;27(11):1653-1662. doi:10.1016/j.joca.2019.07.004
3. Barbieri M, Fantazzini P, Bortolotti V, et al. Single-sided NMR to estimate morphological parameters of the trabecular bone structure. Magn Reson Med. 2021;85(6):3353-3369. doi:10.1002/mrm.28648
4. Rössler E, Mattea C, Mollova A, Stapf S. Low-field one-dimensional and direction-dependent relaxation imaging of bovine articular cartilage. J Magn Reson. 2011;213(1):112-118. doi:10.1016/j.jmr.2011.09.014
5. Eidmann G, Savelsberg R, Blümler P, Blümich B. The NMR MOUSE, a mobile universal surface explorer. J Magn Reson - Ser A. 1996;122(1):104-109. doi:10.1006/jmra.1996.0185
6. Wiesmath A, Filip C, Demco DE, Blümich B. NMR of multipolar spin states excitated in strongly inhomogeneous magnetic fields. J Magn Reson. 2002;154(1):60-72. doi:10.1006/jmre.2001.2458
7. Blümich B, Haber-Pohlmeier S, Zia W. Compact NMR. (Berlin: De Gruyter;, ed.).; 2014. doi:10.1515/9783110266719.123
Figures
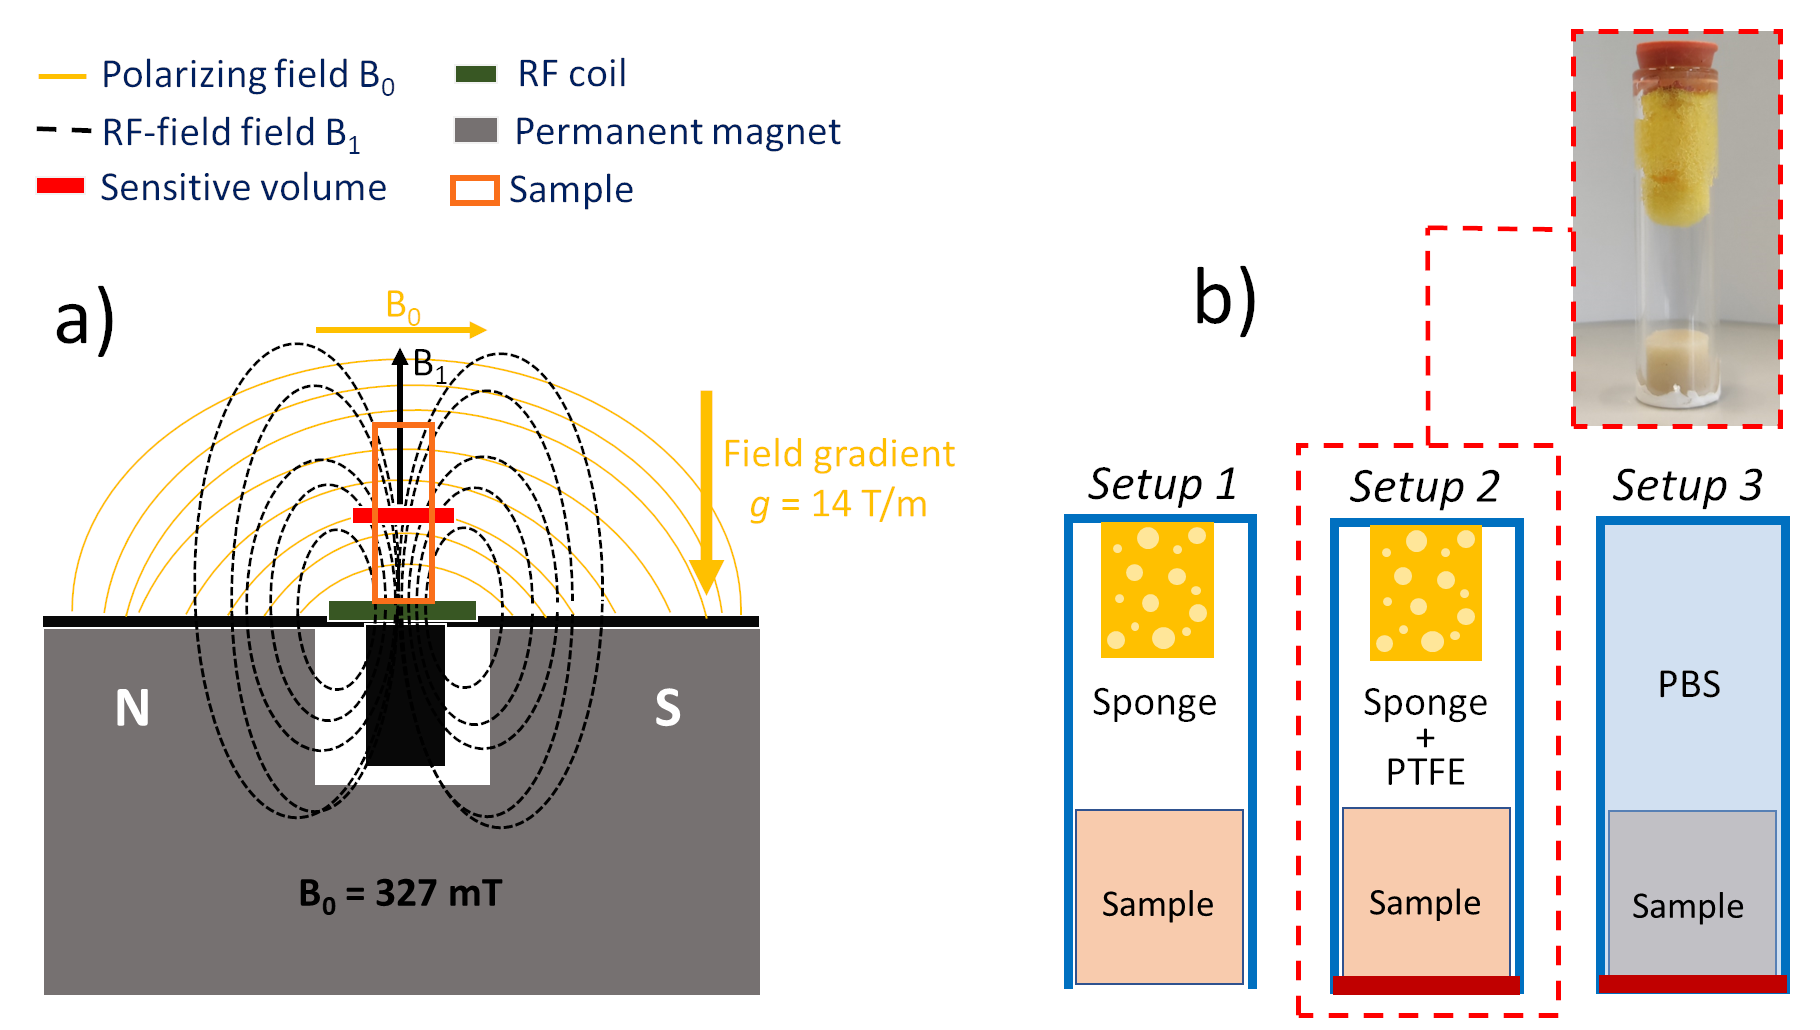
Figure 1: a) Representation of the U-shaped permanent magnet of the NMR-MOUSE that creates an intrinsic constant B0 magnetic field gradient along the main direction of the sample. b) From the left: S1, S2, and S3 experimental setups. To reduce the dehydration effect, some thin layers of Polytetrafluoroethylene (PTFE) were added to the glass tube extremity (red layers in S2 and S3) and it has been also tried to immerse the sample in Phosphate Buffered Saline solution (S3). Setup 2 was preferred.
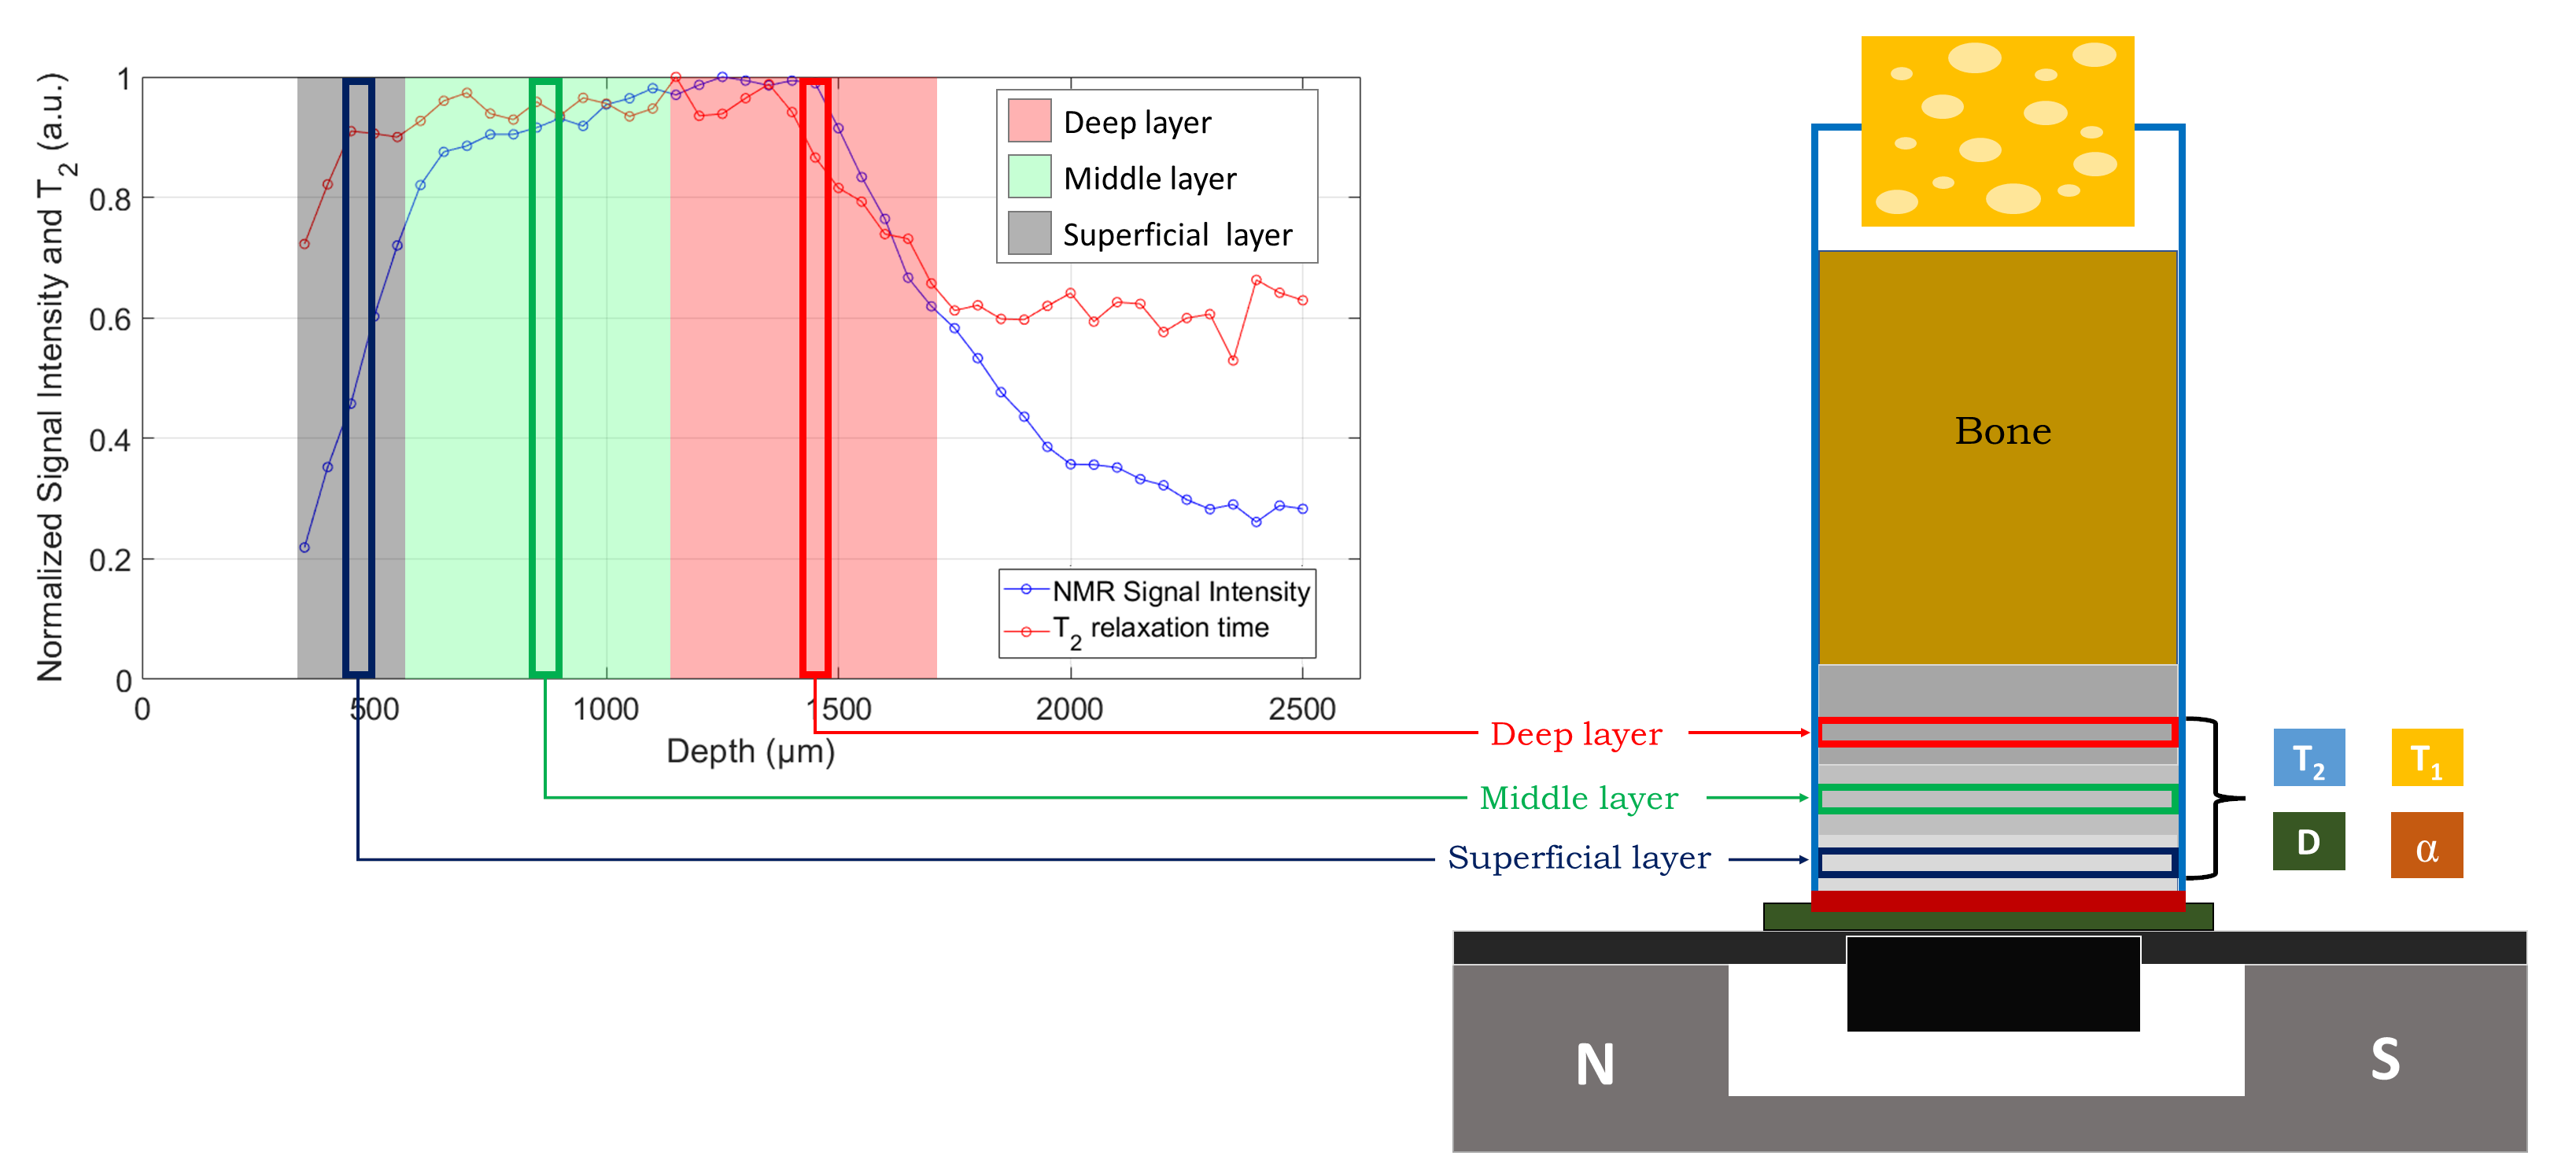
Figure 2: A sketch of the NMR procedure steps: (left) the fast CPMG profile analysis and (right) the ‘three-layer’ analysis. The first is intended to indicate the depths and thicknesses of the superficial (black), middle (green) and deep (red) cartilage layers of the sample. The second uses the information collected in the first to place the sensitive volume of the NMR-MOUSE in each cartilage layer performing CPMG, SR, SSE and DQ-like pulse sequences.
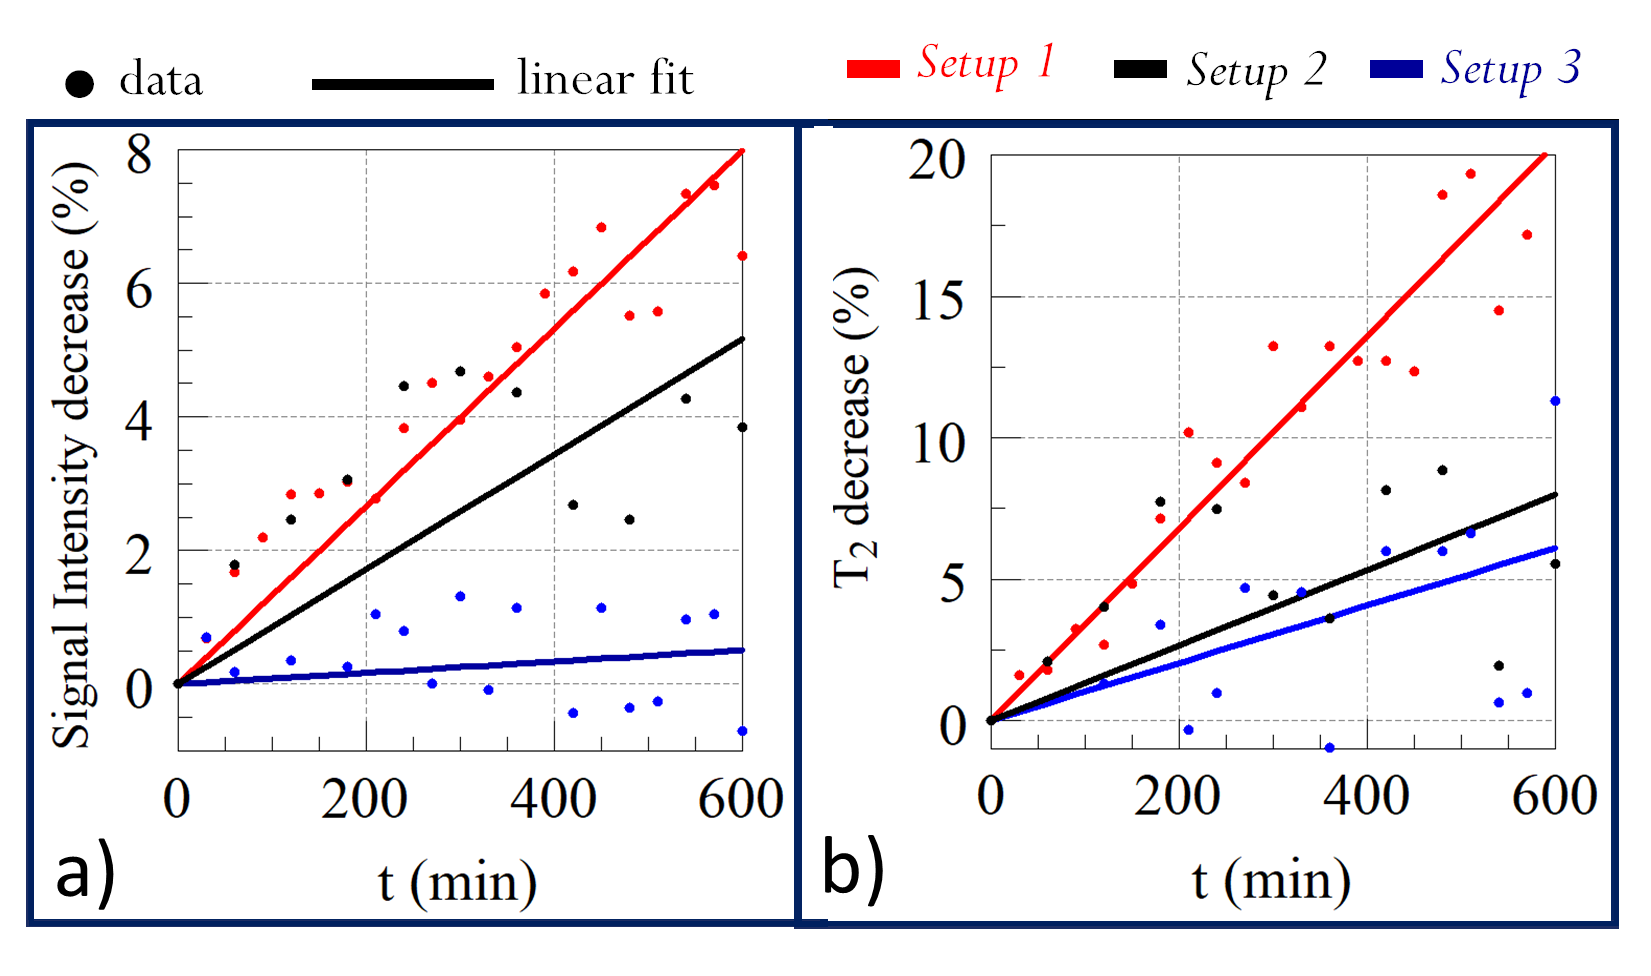
Figure 3: NMR signal intensity (a) and T2 (b) percentage decrease rates for S1, S2, and S3 during the first 10 hours. The highest decrease rate was for S1 (red) both for signal intensity and T2. As explained in the text, S2 (black) was preferred with respect to S3 (blue), even though the latter had the lowest decrease rate. Other NMR parameters were excluded from this analysis because signal intensity and T2 have been considered the most sensitive parameters to cartilage structural changes.
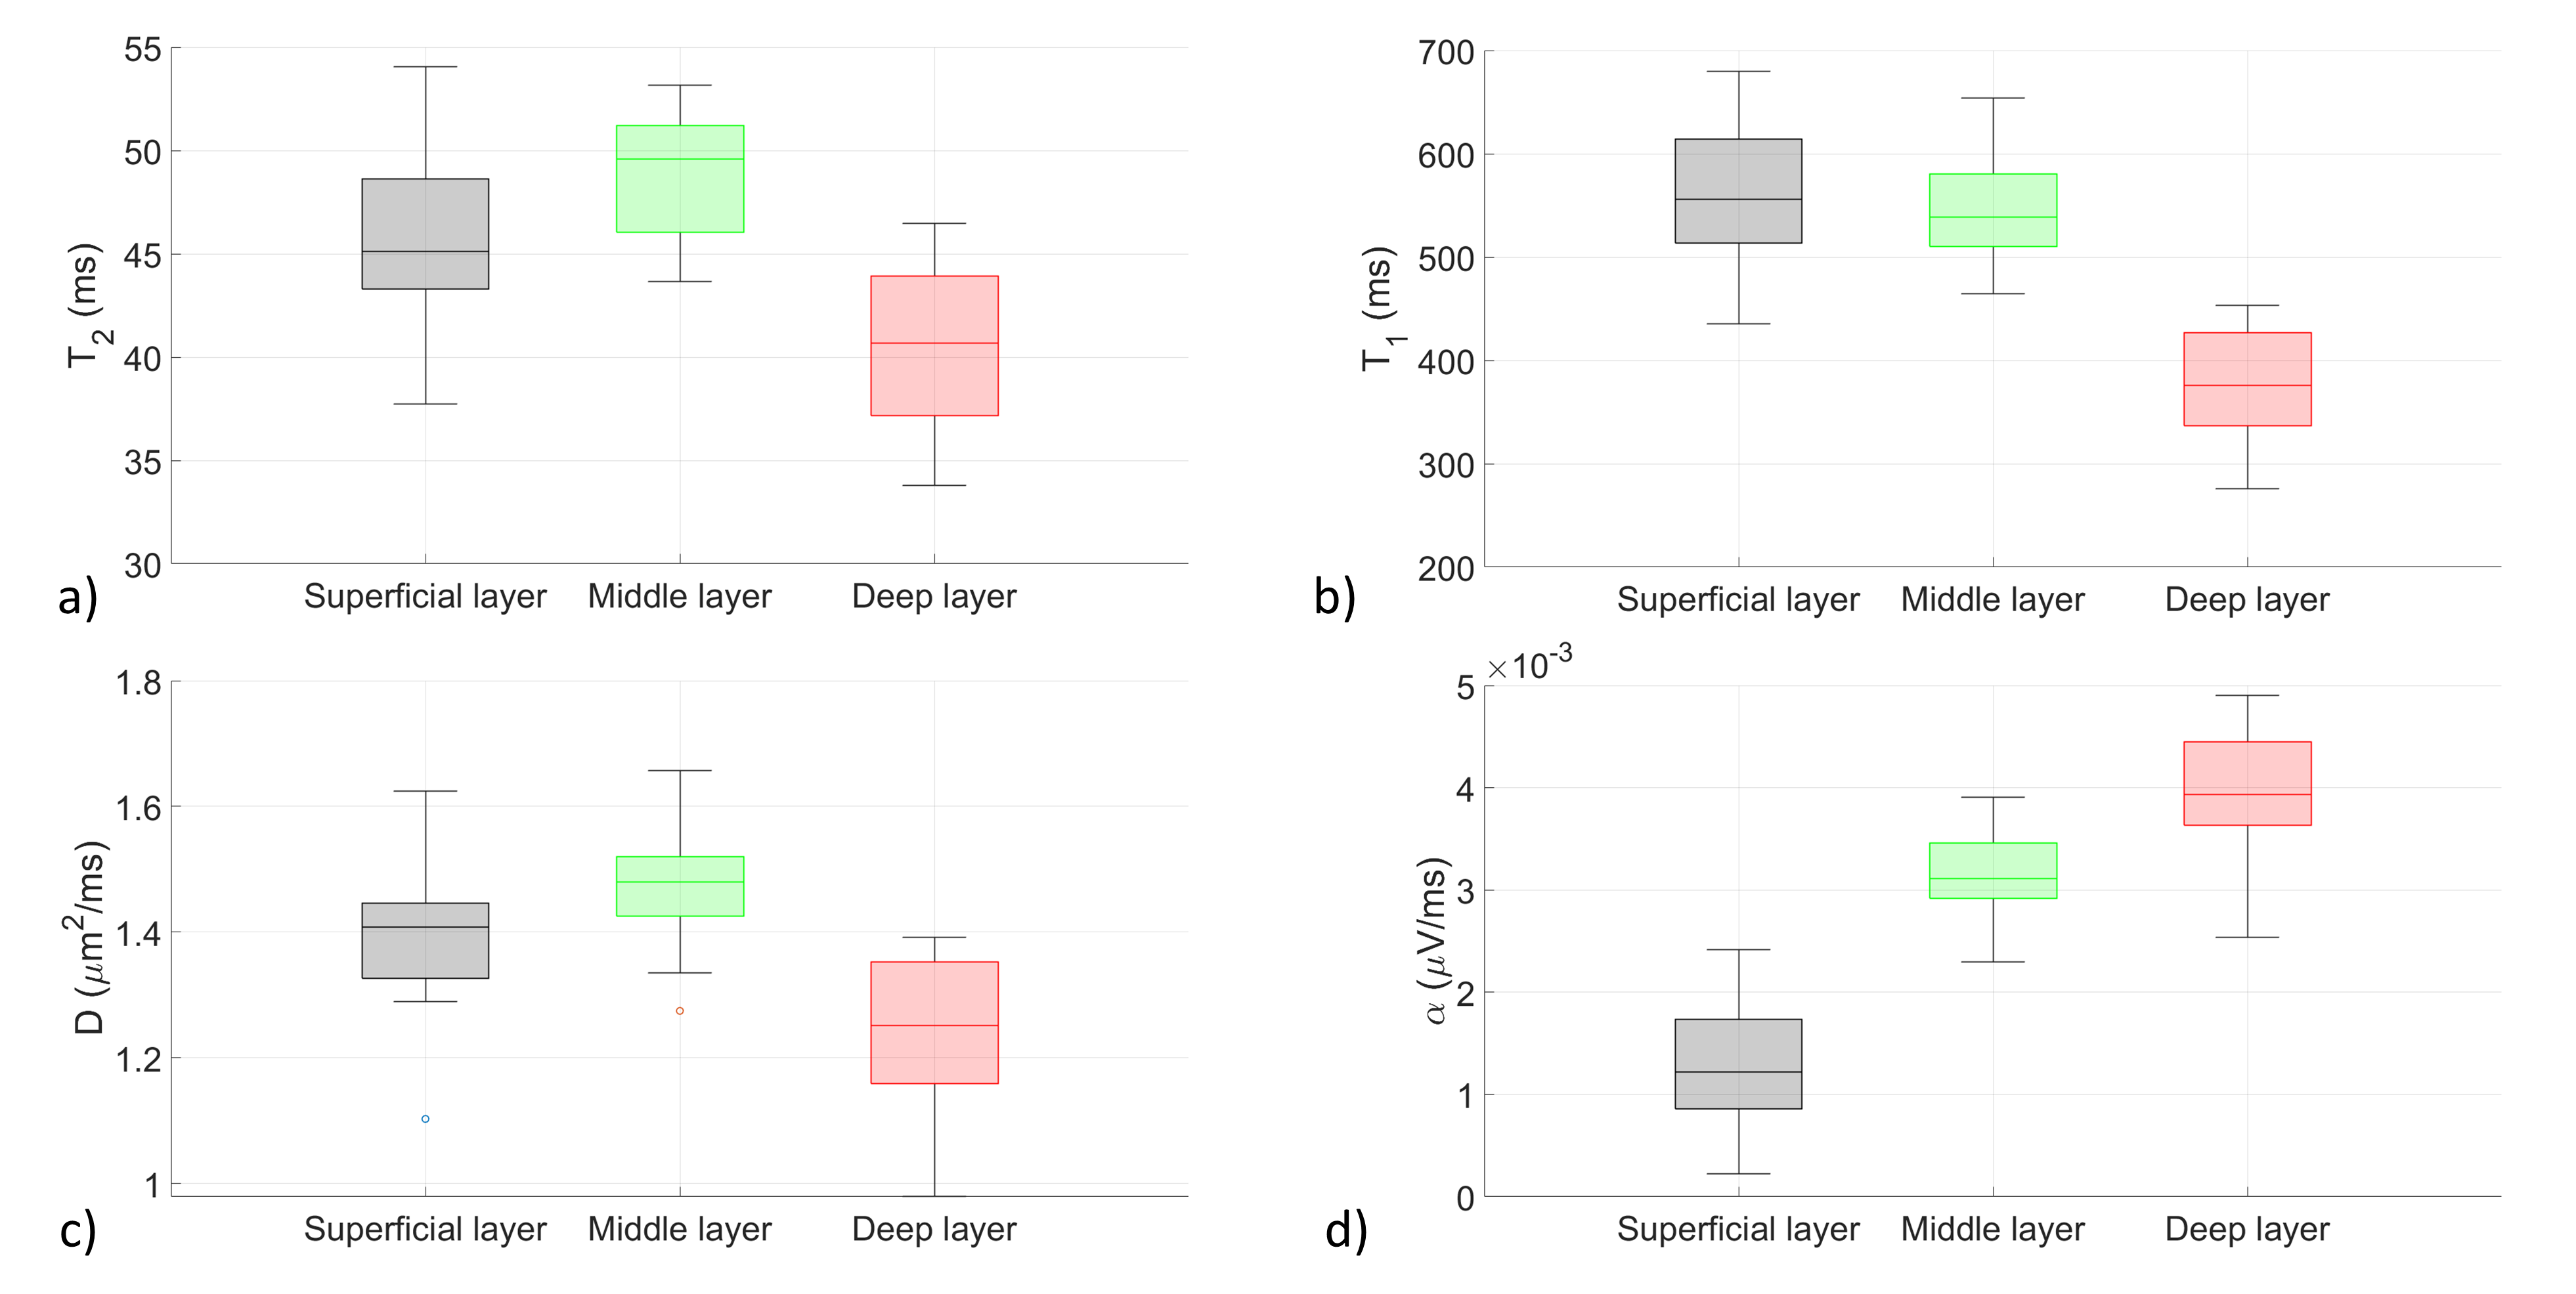
Figure 4: A box plot representation of (a) T2, (b) T1, (c) D and (d) α parameters trends among cartilage layers. In general, superficial, and middle layers medians are close to each other and both farther from the deep layer one for T2, D and T1 parameters. α is the only one in which the three medians are visibly separated. Results of quantitative comparisons are reported in the text.
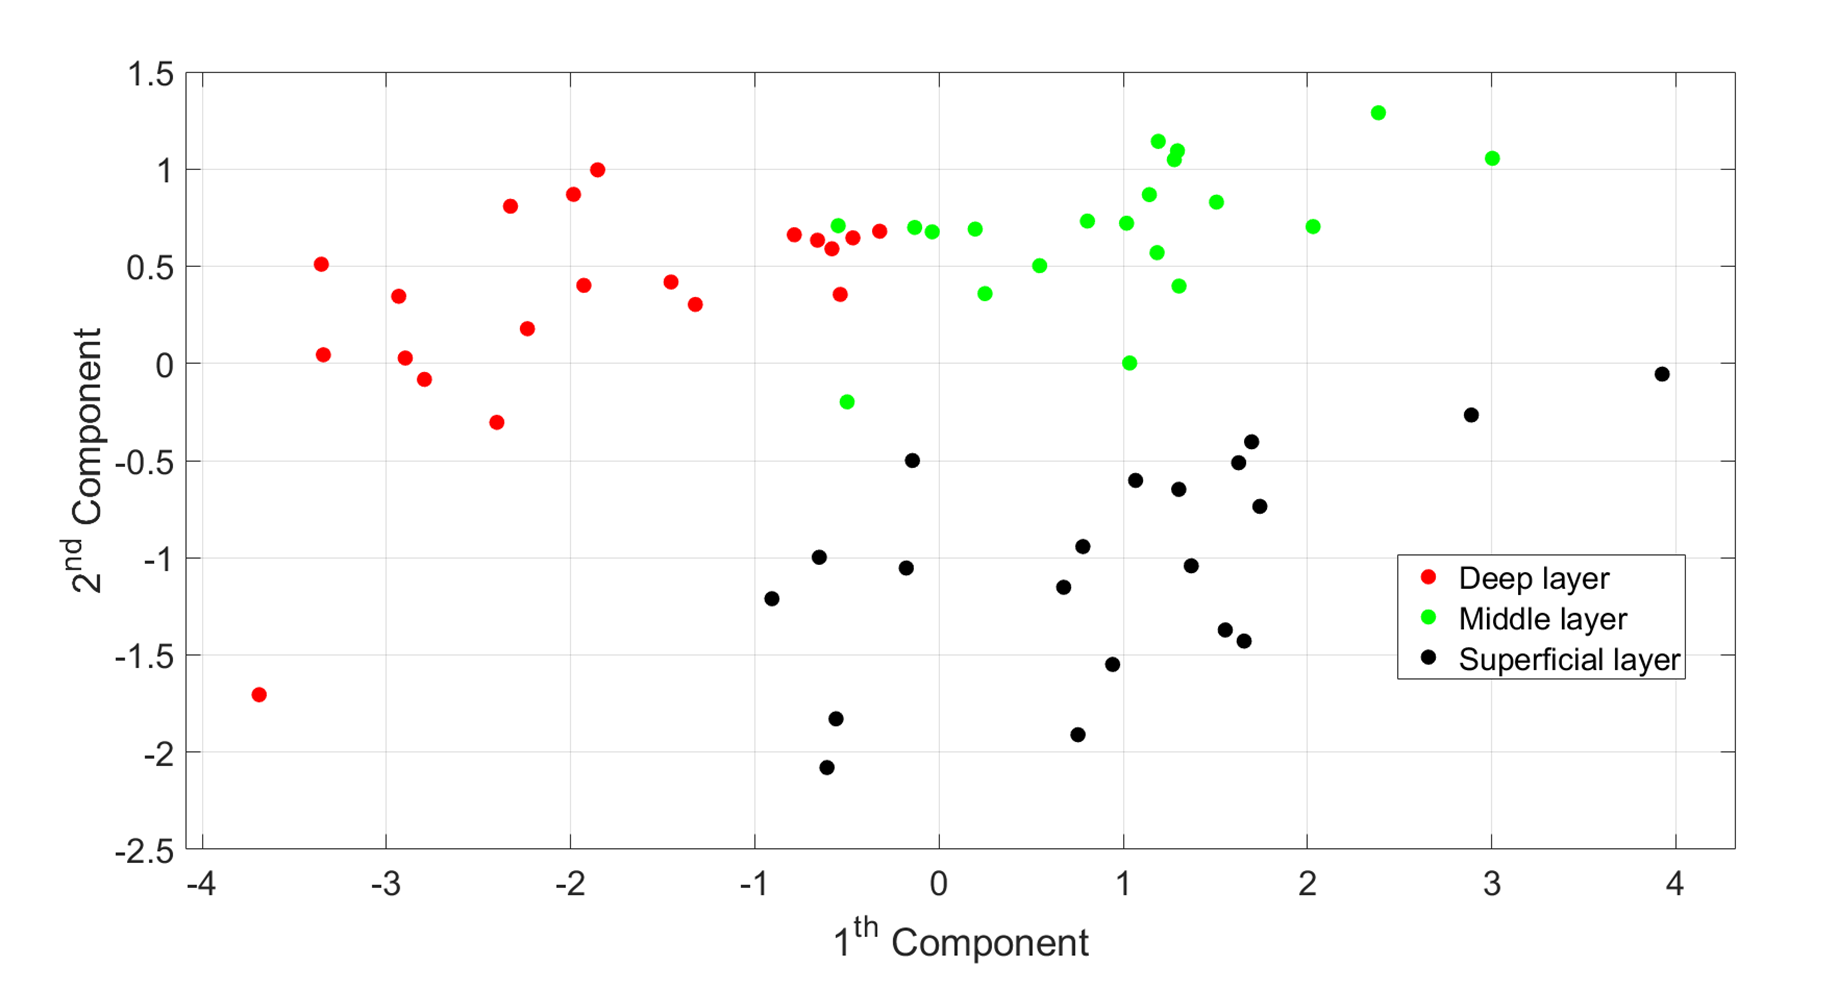
Figure 5: PCA results: the score plot of the first two components coloured according to the three cartilage layers. Since the three groups appear clustered together, the four NMR parameters can discriminate between the cartilage layers. High and similar contributions from T2, T1 and D variables in the first component, and a higher contribution from the α variable in the second component were observed.