4350
3D segmentation of MRI images of leg muscles using Convolutional Neural Networks1Neurology, University Clinic Bergmannsheil Bochum gGmbH, Bochum, Germany, 2Heimer Institute for Muscle Research, University Clinic Bergmannsheil Bochum gGmbH, Bochum, Germany, 3Neurology, Klinikum Dortmund, University Witten-Herdecke, Dortmund, Germany, 4Radiology, UMC Utrecht, Utrecht, Netherlands
Synopsis
Keywords: Machine Learning/Artificial Intelligence, Muscle, Segmentation
Quantitative magnetic resonance imaging offers promising surrogate biomarkers for the early diagnosis and monitoring of pathological changes in leg muscles in patients with neuromuscular disorders. To use this in a clinical routine, automatic segmentation of muscles is needed. To investigate precision and accuracy of various Computational neuronal networks for automated segmentation of upper leg muscles, different loss function were used and quantitative outcome compared to the gold-standard of manual segmentation. The best segmentation results were achieved, with the Fokal Tversky loss function and a single input approach.Introduction
Quantitative magnetic resonance imaging offers promising surrogate biomarkers for the early diagnosis and monitoring of pathological changes in leg muscles in patients with neuromuscular disorders 1,2. The basic requirement for determining such biomarkers is the muscle segmentation of 3D-MRI-Datasets. Because manual muscle segmentation is extremely time-consuming, automated solutions are required to establish the use of such biomarkers in clinical routines. In particular, deep learning-based methods such as convolutional neural networks (CNN) in combination with loss functions are considered state-of-the-art for automated semantic segmentation3. The aim of the current study was to investigate how different loss functions and different network architectures of CNNs influence the segmentation performance as compared to the “gold-standard” of manual segmentation of human thigh muscles.Methods
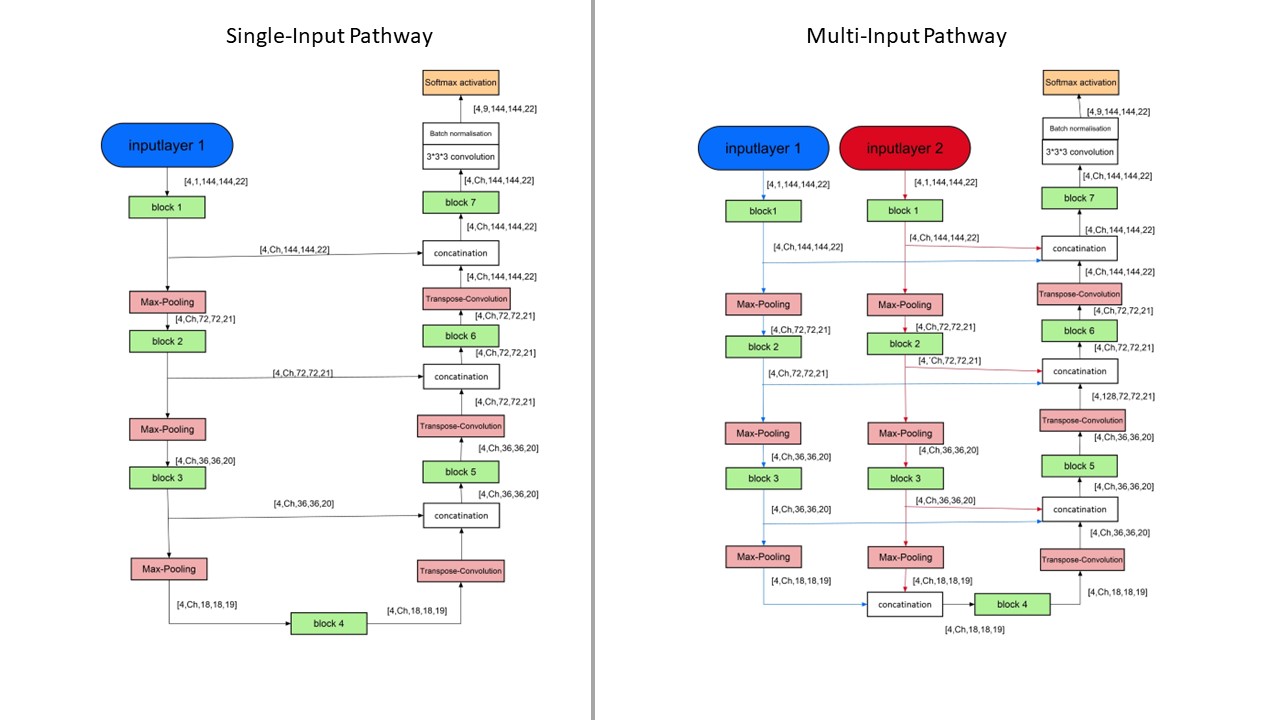
To train the CNNs a dataset of 76 3D-MR-images of thigh muscles, consisting of 55 healthy volunteers and 21 patients with Morbus Pompe or limb-girdle muscular dystrophy was used. 10 datasets remained to test the performance of the CNNs as compared to manual segmentations. All images were acquired using Dixon sequences at a Philips Achieva 3T MR system using a 16CH TorsoXL Coil with a 1.5x1.5x6mm³ resolution. Eight muscles were manually segmented in each leg of all datasets. To examine the performance of different loss functions of the group of distribution-based loss functions (categorical cross entropy, focal loss) and the group of region-based loss functions (Tversky, Fokal Tversky) as well as the group of composite loss functions (unified focal loss)4, a simple U-Net was trained for 200 epochs with each of these loss functions. The Tversky and focal Tversky loss functions were developed to improve training on datasets with unbalanced classes, but are more prone to exploding gradient problems than categorical cross-entropy and focal loss, hence a combination of focal loss and focal Tversky, the Unified Focal Loss was developed. Subsequently the Loss function, with which the predicted segmentations were most similar to the manual segmentation, was chosen to train eight different CNNs. The network architectures of the U-Nets5, ResUnets6, MultiResUnets7 and DenseUNets8 were each implemented as a Single-Input-Network and as a Multi-Input-Network (see Figure1).The Single-Input-Networks consist of an Encoder-Path and a Decoder-Path, which are linked together by Skip-Connections. In contrast to that, the multi-input networks learn different image information on two separate encoder paths, which are merged on the common decoder path to achieve more contrast information and therefore better performance in diseased and fatty infiltrated muscles. The Single-Input-Networks where trained using the Dixon water contrast images, while the Multi-Input-Networks where trained by Dixon-Water and by the in-phase images.
Results
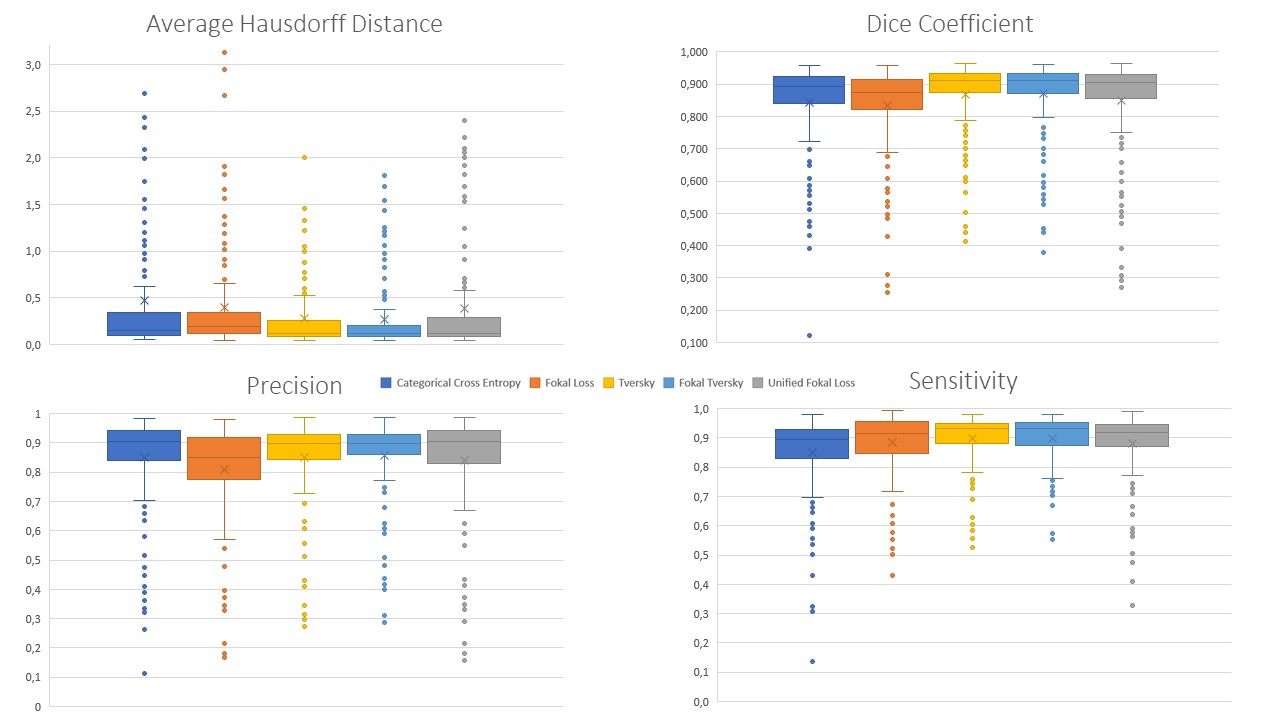
False negative predictions were weighted higher than false positive predictions for the Single-Input-U-Net and the Tversky Loss function and yielded higher Dice-Coefficients (DSC=0.868±0.115) and lower average Hausdorff distances (AHD=0.273±0.365) compared to Categorical Cross Entropy (DSC=0.842±0.141; AHD=0.474±0.922). Fokal Loss (DSC=0.835±0.130; AHD=0.395±0.609) or Unified Fokal Loss (DSC=0.850±0.147; AHD=0.390±0.627). Highest similarity was achieved with the Fokal Tversky loss function (DSC=0.872±0.111; AHD=0.267±0.360).Therefore, Fokal Tversky loss function was used to train all further CNNs. Comparing the segmentation performance of the Single-Input-Networks and the Multi-Input-Networks, the Multi-Input-Networks generally performed worse. Especially for patient muscles with fatty infiltration. The best segmentation performance was achieved by Single-Input-ResUnet (DSC=0.877±0.104; AHD = 0.280±0.386) or by Single-Input-MultiResUNet (DSC=0.867±0.101; AHD = 0.367±0.585).Therefore, Fokal Tversky loss function was used to train all further CNNs.
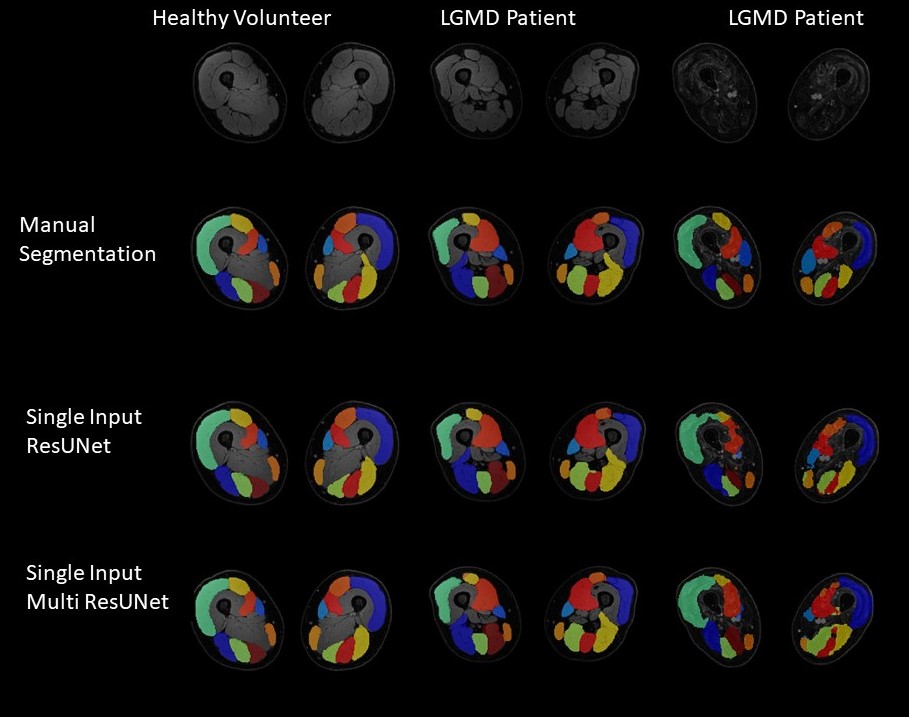
Comparing the segmentation performance of the Single-Input-Networks and the Multi-Input-Networks, the Multi-Input-Networks generally performed worse. Especially for patient muscles with fatty infiltration. The best segmentation performance was achieved by Single-Input-ResUnet (DSC=0.877±0.104; AHD = 0.280±0.386) or by Single-Input-MultiResUNet (DSC=0.867±0.101; AHD = 0.367±0.585).
Discussion
The Fokal Tversky loss function performed best. Here, false negative predictions of single voxels were weighted higher than false positives, resulting in a better balance of sensitivity and precision. Furthermore, the focus of this loss function can rely on hard-to-learn classes, resulting in better segmentation results for diseased muscles. For further performance improvement, various network architectures were trained using the Fokal Tversky loss function. In general, the Single-Input-Networks achieved better segmentation performance than the Multi-Input-Networks. A possible explanation would be, that multi-Input-Networks have difficulty to combine complementary information on a common decoder path. Another reason for the worse performance of Multi-Input-Networks is, that the encoder-path with the less relevant information has a higher impact on the loss function and thereby has a higher impact on the learning process. The best segmentation results and thereby the lowest deviations of qMRI-parameters were achieved when using Single-Input-MultiResUNets or Single-Input-ResUNets. In particular, diseased muscles were segmented more consistently and less cautiously by the Single-Input MultiResUNet than by the Single-Input ResUNet, which can lead to different measurement deviations in the calculation of quantitative MRI-biomarkers. Therefore, different CNN may be desired for different outcome measures. Inflammatory processes in neuromuscular diseases are mostly located deep in the muscle tissue and not in areas close to the subcutaneous fat. In conclusion, in automatic segmentation of muscle tissue, there is an inverse U-shape relationship between model-complexity and the quality of segmentation outcome, with Two-Input stream models performing worse in comparison to Single-Input stream models. Additionally, the optimal model may be dependent on the variable of interest, further research is needed to unravel this relationship.Acknowledgements
No acknowledgement found.References
1. Schlaffke L, Rehmann R, Rohm M, et al. Multicenter evaluation of stability and reproducibility of quantitative MRI measures in healthy calf muscles. NMR Biomed. 2019;32(9):1-14. doi:10.1002/nbm.4119
2. Schlaffke L, Rehmann R, Froeling M, et al. Diffusion Tensor Imaging of the Human Calf : Variation of Inter- and Intramuscle-Specific Diffusion Parameters. J Magn Reson Imaging. Published online 2017:1-12.
3. Mo Y, Wu Y, Yang X, Liu F, Liao Y. Review the state-of-the-art technologies of semantic segmentation based on deep learning. Neurocomputing. 2022;493(January):626-646. doi:10.1016/j.neucom.2022.01.005
4. Yeung M, Sala E, Schönlieb CB, Rundo L. Unified Focal loss: Generalising Dice and cross entropy-based losses to handle class imbalanced medical image segmentation. Comput Med Imaging Graph. 2022;95:0-52. doi:10.1016/j.compmedimag.2021.102026
5. Çiçek Ö, Abdulkadir A, Lienkamp SS, Brox T, Ronneberger O. 3D U-net: Learning dense volumetric segmentation from sparse annotation. Lect Notes Comput Sci (including Subser Lect Notes Artif Intell Lect Notes Bioinformatics). 2016;9901 LNCS:424-432. doi:10.1007/978-3-319-46723-8_49
6. Zhang Z, Liu Q, Wang Y. Road Extraction by Deep Residual U-Net. IEEE Geosci Remote Sens Lett. 2018;15(5):749-753. doi:10.1109/LGRS.2018.2802944
7. Ibtehaz N, Rahman MS. MultiResUNet: Rethinking the U-Net architecture for multimodal biomedical image segmentation. Neural Networks. 2020;121:74-87. doi:10.1016/j.neunet.2019.08.025
8. Jegou S, Drozdzal M, Vazquez D, Romero A, Bengio Y. The One Hundred Layers Tiramisu: Fully Convolutional DenseNets for Semantic Segmentation. IEEE Comput Soc Conf Comput Vis Pattern Recognit Work. 2017;2017-July:1175-1183. doi:10.1109/CVPRW.2017.156
Figures