4347
3D nnU-Net with Multi Loss Ensembles for Automated Segmentation of Intracranial Aneurysm1Department of Radiology, University of Washington, Seattle, WA, United States, 2Peking University Cancer Hospitals & Institution, Beijing, China
Synopsis
Keywords: Machine Learning/Artificial Intelligence, Machine Learning/Artificial Intelligence, Compound Loss function, Deep Neural Networks, nnU-Net
In the segmentation of intracranial aneurysm, deep neural networks are equipped with modified loss functions to penalize the training weights for aneurysm false predictions and conduct unbiased learning. In this paper, we used a new compound loss function to capture the different aspects of embedding as well as diverse features. The proposed loss was given to a 3D full resolution nnU-Net to segment imbalanced TOF-MRA images from ADAM dataset. The proposed loss outperformed commonly used losses in terms of Dice, Sensitivity, and Precision.
Introduction
Intracranial aneurysm is a common disease with a prevalence of 3-5% in the general population. TOF-MRA and CE-MRA are commonly used imaging methods for the evaluation of aneurysm morphology and size. For aneurysm segmentation, the dataset often suffers from unequal distribution of classes, where aneurysms occupy a very small volume relative to the background. One solution to this challenge is to modify the loss function of deep neural networks, which are the most successful models for the segmentation of medical images. While a single loss function deals only with some aspects of optimal similarity embedding, a combo loss is preferred due to its power in capturing diverse features. Although Cross entropy [1] and Dice [2] have become the most used losses in medical imaging segmentation [3], recently presented losses have shown improved performance. In this study, we propose a new compound loss which is a combination of distribution-based and region-based losses. The proposed loss minimizes the dissimilarity between two distributions of embeddings and maximizes the overlap regions between ground truth and predicted segmentation.Methods
We used the ADAM dataset composed of 113 TOF-MRA datasets (93 patients with 125 unruptured intracranial aneurysm [UIAs]) [4]. The voxel-wise annotations were drawn in the axial plane by two radiologists. All MRAs were scanned at UMC Utrecht, the Netherlands, on Philips scanners with 1.5 or 3T field strength. The TOF-MRAs had an in-plane resolution of 0.2 to 1 mm and slice thickness range of (0.4–0.7) mm, without a set acquisition protocol. A 3D full resolution of nnU-Net [5], a self-configuring method for deep learning-based biomedical image segmentation, was employed for aneurysm segmentation. We proposed a novel compound loss to capture different aspects of the embedding layer. We introduced eight combinations of different losses to be considered as the error function of the 3D nnU-Net for aneurysm segmentation:$$$1) Dice + CE$$$, $$$2) Dice + TopK$$$, $$$3) Dice + TopK + CE$$$, $$$4) Dice + Focal$$$, $$$5) Dice + TopK + Focal$$$, $$$6) Dice + TopK + Focal + Tversky + CE$$$, $$$7) Weighted Dice + TopK + CE$$$, $$$8) Weighted Dice + TopK + Focal + Tversky + CE$$$
The Cross entropy (CE) loss [1] measures the difference between two probability distributions, Dice loss [2] calculates the overlap between two sets, Top k loss [6] focuses on hard samples during training, Focal loss [7] addresses the issue of class imbalance by down-weighting the contribution of easy examples enabling learning of harder examples, and Tversky loss [8] is used to handle imbalanced data. The mathematical equations of the loss functions are shown in figure 1. The losses {Dice, Tversky} are examples of region-based loss functions while {CE, Top K, and Focal} are distribution-based loss. Meanwhile, we set the weighted compound loss functions as follows:
7) 0.5 × Dice + 0.25 × TopK + 0.25 × CE
8) 0.6 × Dice + 0.1 × TopK + 0.1 × CE + 0.1 × Tversky + 0.1 × Focal
The model used an encoding and decoding path where each path includes 5 convolution blocks, and each block is comprised of a 3*3*3 convolution layer. We also used the instance normalization layer and leaky rectified linear unit. The nnU-Net utilizes the cropping and Z-Score normalization for processing the images before feeding the model and then employs rotation and scaling (figure 2). The SGD is selected as the optimization algorithm with an initial learning rate of 0.01. We run the model for 250 epochs and apply five-fold cross validation. We train all the models on 3* RTX 3090 GPU with patch size of 256 × 224 × 56.
Results
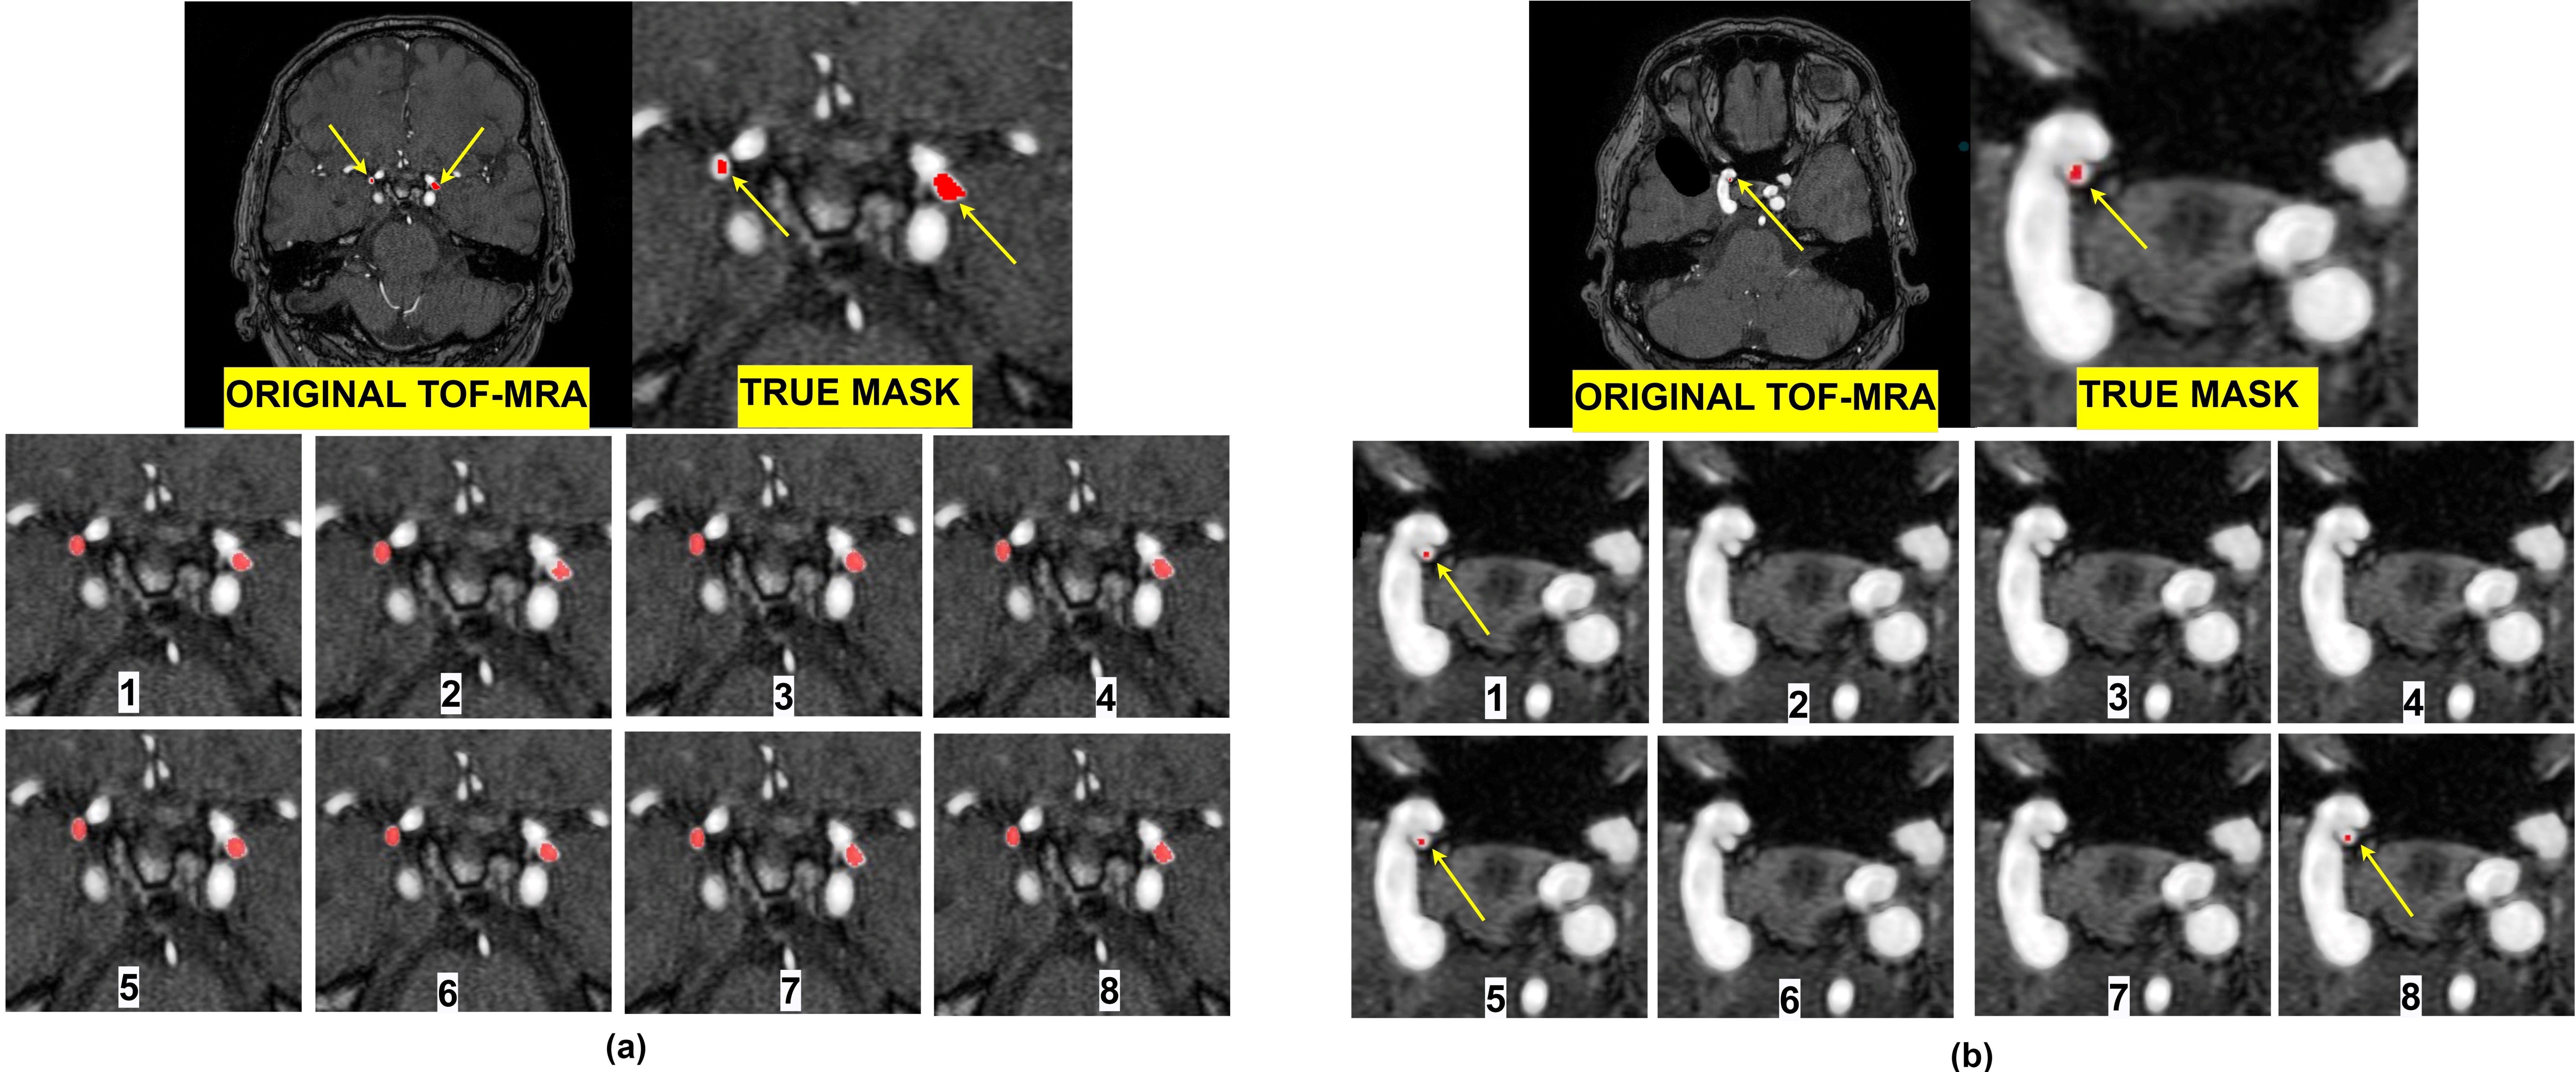
To evaluate the performance of each loss function, Dice, Sensitivity, and Precision have been computed. Figure 3 consists of three tables. Table 1 presents the cross-validation results in terms of performance metrics. The results showed that none of the loss functions achieved the best metrics. Thus, we selected the best-fold models for ensembles. Table 2 indicates the mean and standard deviation results of running the losses within 5 folds. Table 3 shows the total rank of each loss where the weighted compound loss (0.5×Dice + 0.25×CE + 0.25×TopK) got the best overall rank. This loss function achieved the average results of 0.5227, 0.5145, 0.6871 for Dice, Sensitivity, and Precision. Figure 4 illustrates the training & validation loss as well as evaluation metric. Moreover, the segmentation results of running all losses for cases 24 and 27, are shown in figure 5. All losses detected both aneurysms for case 24, while the tiny aneurysm in case 27 was only detected by losses 1, 5, and 8.Conclusion
This study proposed a nnU-Net model with ensemble of compound loss functions for the segmentation of intracranial aneurysms. We combined different losses from region-based and distribution-based functions. The results showed that the weighted compound loss including Dice, TopK, and CE outperformed other loss combinations in terms of Dice, Sensitivity, and Precision. Future work will focus on automatically finding the optimal values of the loss weights so that the model can be generalized to different datasets.Acknowledgements
This study was supported by US National Institute of Health (NIH) grantsR01HL162743 and R00HL136883.References
1. Ronneberger, O., Fischer, P., Brox. T., U-Net: convolutional networks for biomedical image segmentation. Proc. International Conference on Medical Image Computing and Computer-Assisted Intervention (MICCAI). 2015; 234–241.
2. Milletari, F., Navab, N., and Ahmadi, S., V-net: Fully convolutional neural networks for volumetric medical image segmentation. Fourth International Conference on. IEEE, 2016; 565–571.
3. Jun, M., et al, Loss odyssey in medical image segmentation. Med Image Anal. 2021; 102035.
4. Timmins, K., et al, comparing methods of detecting and segmenting unruptured intracranial aneurysms on TOF-MRAS: The ADAM challenge. NeuroImage. 2021; 238.
5. Isensee, F., Jaeger, PF., et al. nnU-Net: a self-configuring method for deep learning-based biomedical image segmentation. Nat Methods. 2021;18:203–211
6. Wu, Z., Shen, C., van den Hengel, A., Bridging category-level and instance-level semantic image segmentation. 2016; arXiv: 1605.06885
7. Lin, T.Y., Goyal, P., et al. Focal loss for dense object detection. In Proc. International Conference on Computer Vision. 2017; 2999–3007
8. Salehi, S. S. M., Erdogmus, D., & Gholipour, A. Tversky loss function for image segmentation using 3D fully convolutional deep networks. In 49 Proc. International Workshop on Machine Learning in Medical Imaging. 2017; 379–387.
Figures