4336
Quantitative Evaluation of kPL Dependence on Pyruvate Concentration in Anaplastic Thyroid Cancer Cell Suspensions using Hyperpolarized 13C NMR1The University of Texas MD Anderson Cancer Center UTHealth Graduate School of Biomedical Sciences, Houston, TX, United States, 2Department of Imaging Physics, The University of Texas MD Anderson Cancer Center, Houston, TX, United States, 3Department of Head and Neck Surgery, The University of Texas MD Anderson Cancer Center, Houston, TX, United States, 4Department of Otolaryngology-Head and Neck Surgery, Baylor College of Medicine, Houston, TX, United States, 5Department of Radiation Oncology, The University of Texas MD Anderson Cancer Center, Houston, TX, United States, 6Department of Molecular and Cellular Oncology, The University of Texas MD Anderson Cancer Center, Houston, TX, United States
Synopsis
Keywords: Hyperpolarized MR (Non-Gas), Translational Studies
Metabolic imaging of hyperpolarized pyruvate can provide new insight into tumor progression and response to therapy. Pharmacokinetic modeling can be used to determine kPL, the apparent rate constant for conversion of hyperpolarized pyruvate into lactate. In this work, we sought to characterize the effect of hyperpolarized pyruvate concentration on intracellular kPL in ATC cell suspensions using a two-compartment pharmacokinetic model for kPL quantification. Improved understanding of the effects of concentration on intracellular chemical conversion rates could lead to more accurate quantification of in vivo and clinical hyperpolarized MRI imaging biomarkers of metabolism.Introduction
Hyperpolarized (HP) MRI is an emerging metabolic imaging method that permits the quantification of the conversion of HP [1-13C]-pyruvate into lactate1-3, which can provide useful insight into the metabolic state of tumor tissue in real time. To date, HP 13C MRI has demonstrated strong clinical potential for characterization of tumor metabolism and response to therapy in a variety of cancer types4-8. Pharmacokinetic (PK) modeling and analysis can be used to determine kPL, the apparent rate constant for conversion of HP [1-13C]-pyruvate into lactate2. However, further validation is needed in order to prove the potential of this metabolic imaging biomarker to guide cancer diagnosis and treatment.In our previous work9, we evaluated intracellular kPL in suspensions of Hth-83 anaplastic thyroid cancer (ATC) cells using ion chromatography-mass spectrometry (IC-MS) and HP nuclear magnetic resonance (NMR) imaging modalities; a closed PK model with two physical compartments (intracellular, extracellular) and two chemical pools (pyruvate, lactate) was used for quantification of intracellular kPL values. Interestingly, IC-MS results revealed that the intracellular pyruvate and lactate pool sizes shifted dramatically, even when using 3 mM HP pyruvate in solution with cells. Improved understanding of the effects of pyruvate concentration on kPL could lead to more robust analyses of in vivo and clinical HP MRI data. Therefore, the goal of this work was to capture effects of pyruvate concentration on intracellular kPL using ATC cell suspensions and a closed two-compartment PK model.
Methods
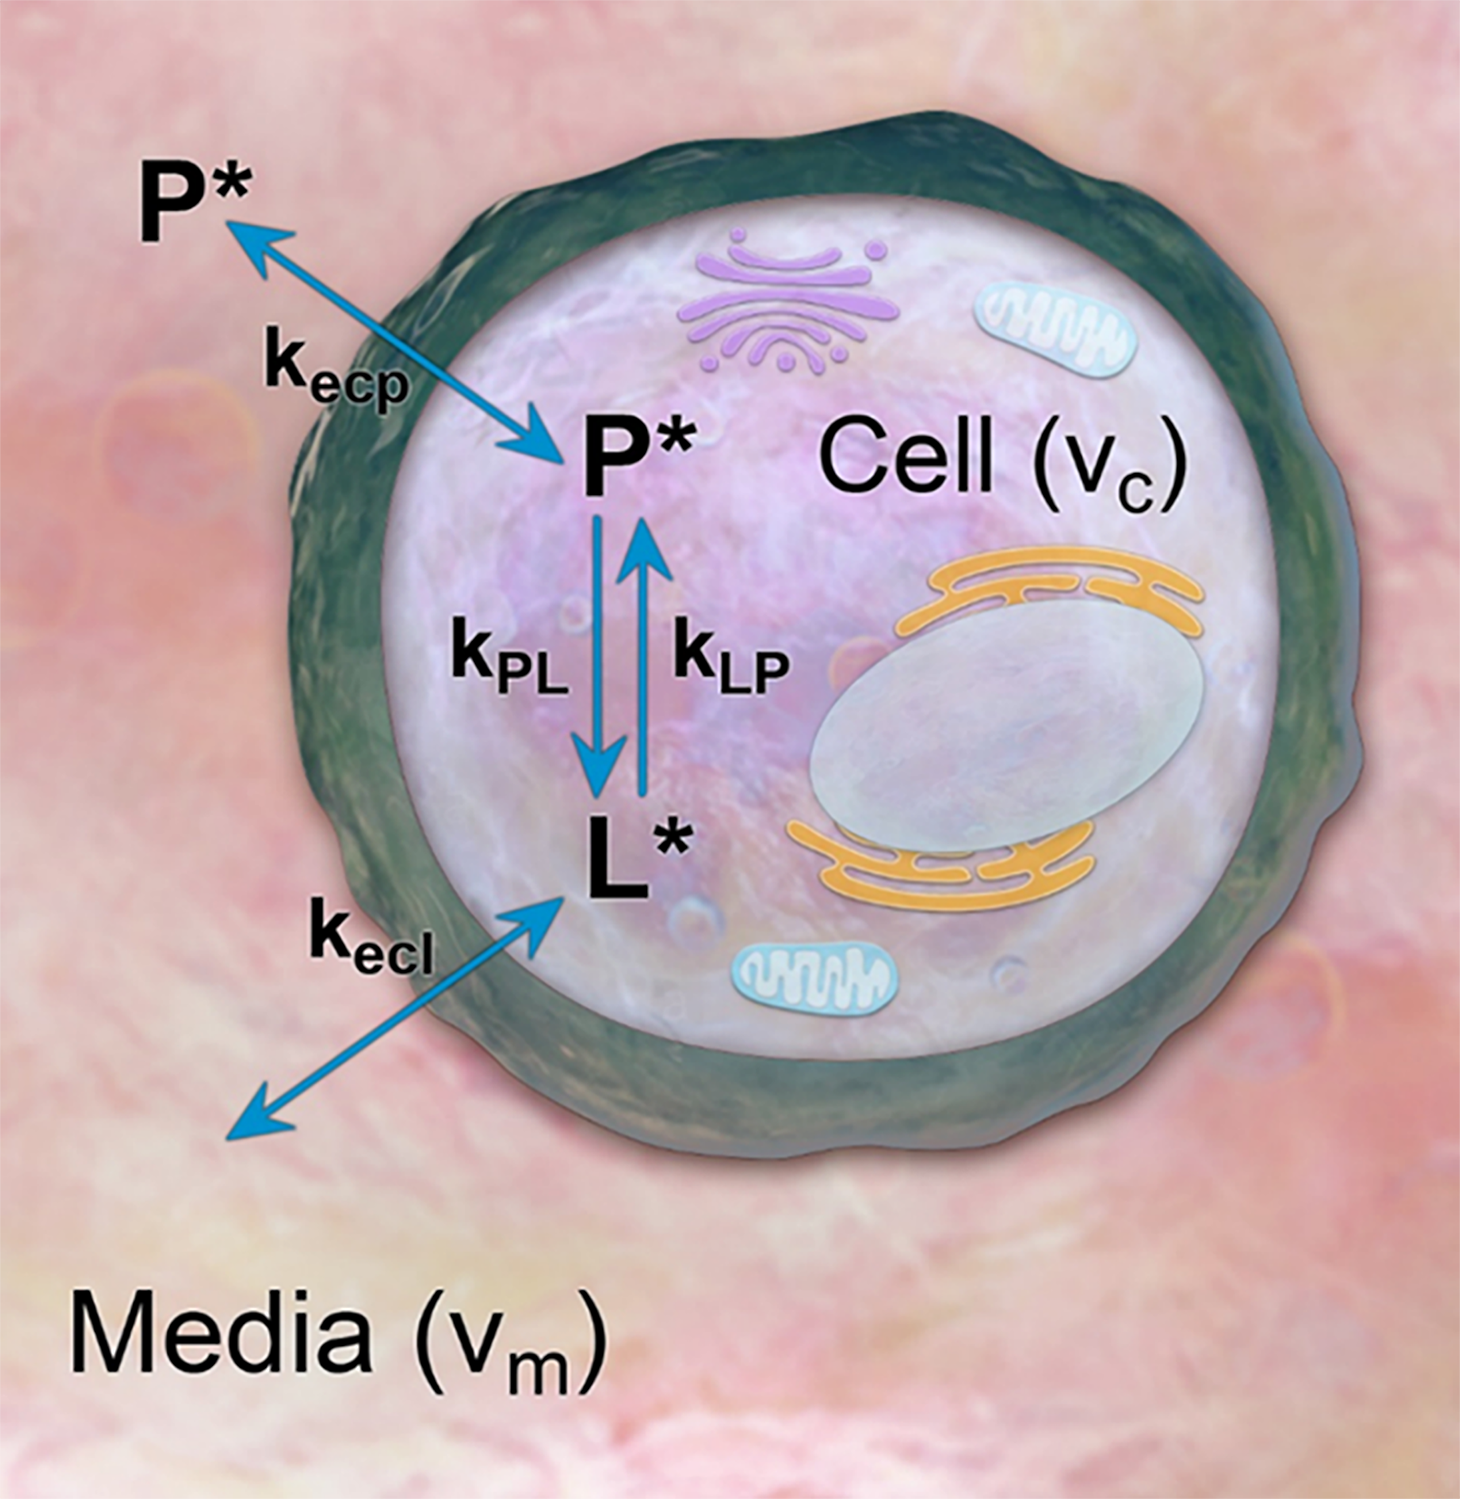
Hyperpolarized NMR: HP [1-13C]-pyruvate was prepared using a HyperSense dissolution dynamic nuclear polarization system (Oxford Instruments, Abingdon, UK) as previously described10. All NMR experiments were conducted using a Spectrospin DPX-300 NMR spectrometer equipped with a broadband 10 mm NMR probe (Bruker, Billerica, MA, USA). Approximately 1×10⁷ Hth-83 ATC cells were suspended in 900 μL of cell media and added to a 10 mm Shigemi tube, along with 100 μL of D2O11. The Shigemi tube was lowered to isocenter of the NMR for ~15 minutes at 310 K in order to allow the ATC cells to equilibrate to body temperature. Aliquots of 40 mM HP [1-13C]-pyruvate were measured and diluted using standard PBS in order to achieve target concentrations of approximately 0.5, 1, 2, 3, 5 and 10 mM. A pulse-acquire sequence with a 10° excitation angle and a 2 s repetition time was used to acquire dynamic 13C spectra.Pharmacokinetic Modeling: A closed PK model with two physical compartments (intracellular, extracellular) and two chemical pools (pyruvate, lactate) was used to analyze HP NMR data (Figure 1)2. The following differential equations relate exchange between pyruvate and lactate in extracellular media (m) and within cells (c):
$$\frac{\partial P_m^*(t)}{\partial t}=\frac{k_{ecp}}{v_{m}}P_c^*(t)-(\frac{k_{ecp}}{v_{m}}+R_{Pyr})P_m^*(t)$$
$$\frac{\partial L_m^*(t)}{\partial t}=\frac{k_{ecl}}{v_{m}}L_c^*(t)-(\frac{k_{ecl}}{v_{m}}+R_{Lac})L_m^*(t)$$
$$\frac{\partial P_c^*(t)}{\partial t}=\frac{k_{ecp}}{v_{c}}P_m^*(t)+k_{LP}L_c^*(t)-(\frac{k_{ecp}}{v_{c}}+k_{PL}+R_{Pyr})P_c^*(t)$$
$$\frac{\partial L_c^*(t)}{\partial t}=\frac{k_{ecl}}{v_{c}}L_m^*(t)+k_{PL}P_c^*(t)-(\frac{k_{ecl}}{v_{c}}+k_{LP}+R_{Lac})L_c^*(t)$$
Here, kecp and kecl represent the transport of pyruvate and lactate across the cell membrane. vm and vc denote the extracellular and intracellular volume fraction. The apparent rate constant for chemical conversion of HP pyruvate to lactate is given by kPL, and the reverse reaction rate is given by kLP. RPyr and RLac denote losses due to T1 relaxation. Excitation losses were modeled as instantaneous following each excitation, and the total observed pyruvate (P*) and lactate (L*) signals were calculated as the sum of compartmental signals weighted by their respective volume fractions. To assess the uniqueness of the solutions, nuisance variables were fit to the data while kPL was varied across a supraphysiological range of values. For these studies, kPL values were selected at the point on the residual curve where kPL begins to decrease by <1%. Analysis was conducted using MATLAB R2021a (The MathWorks, Natick, MA, USA).
Results
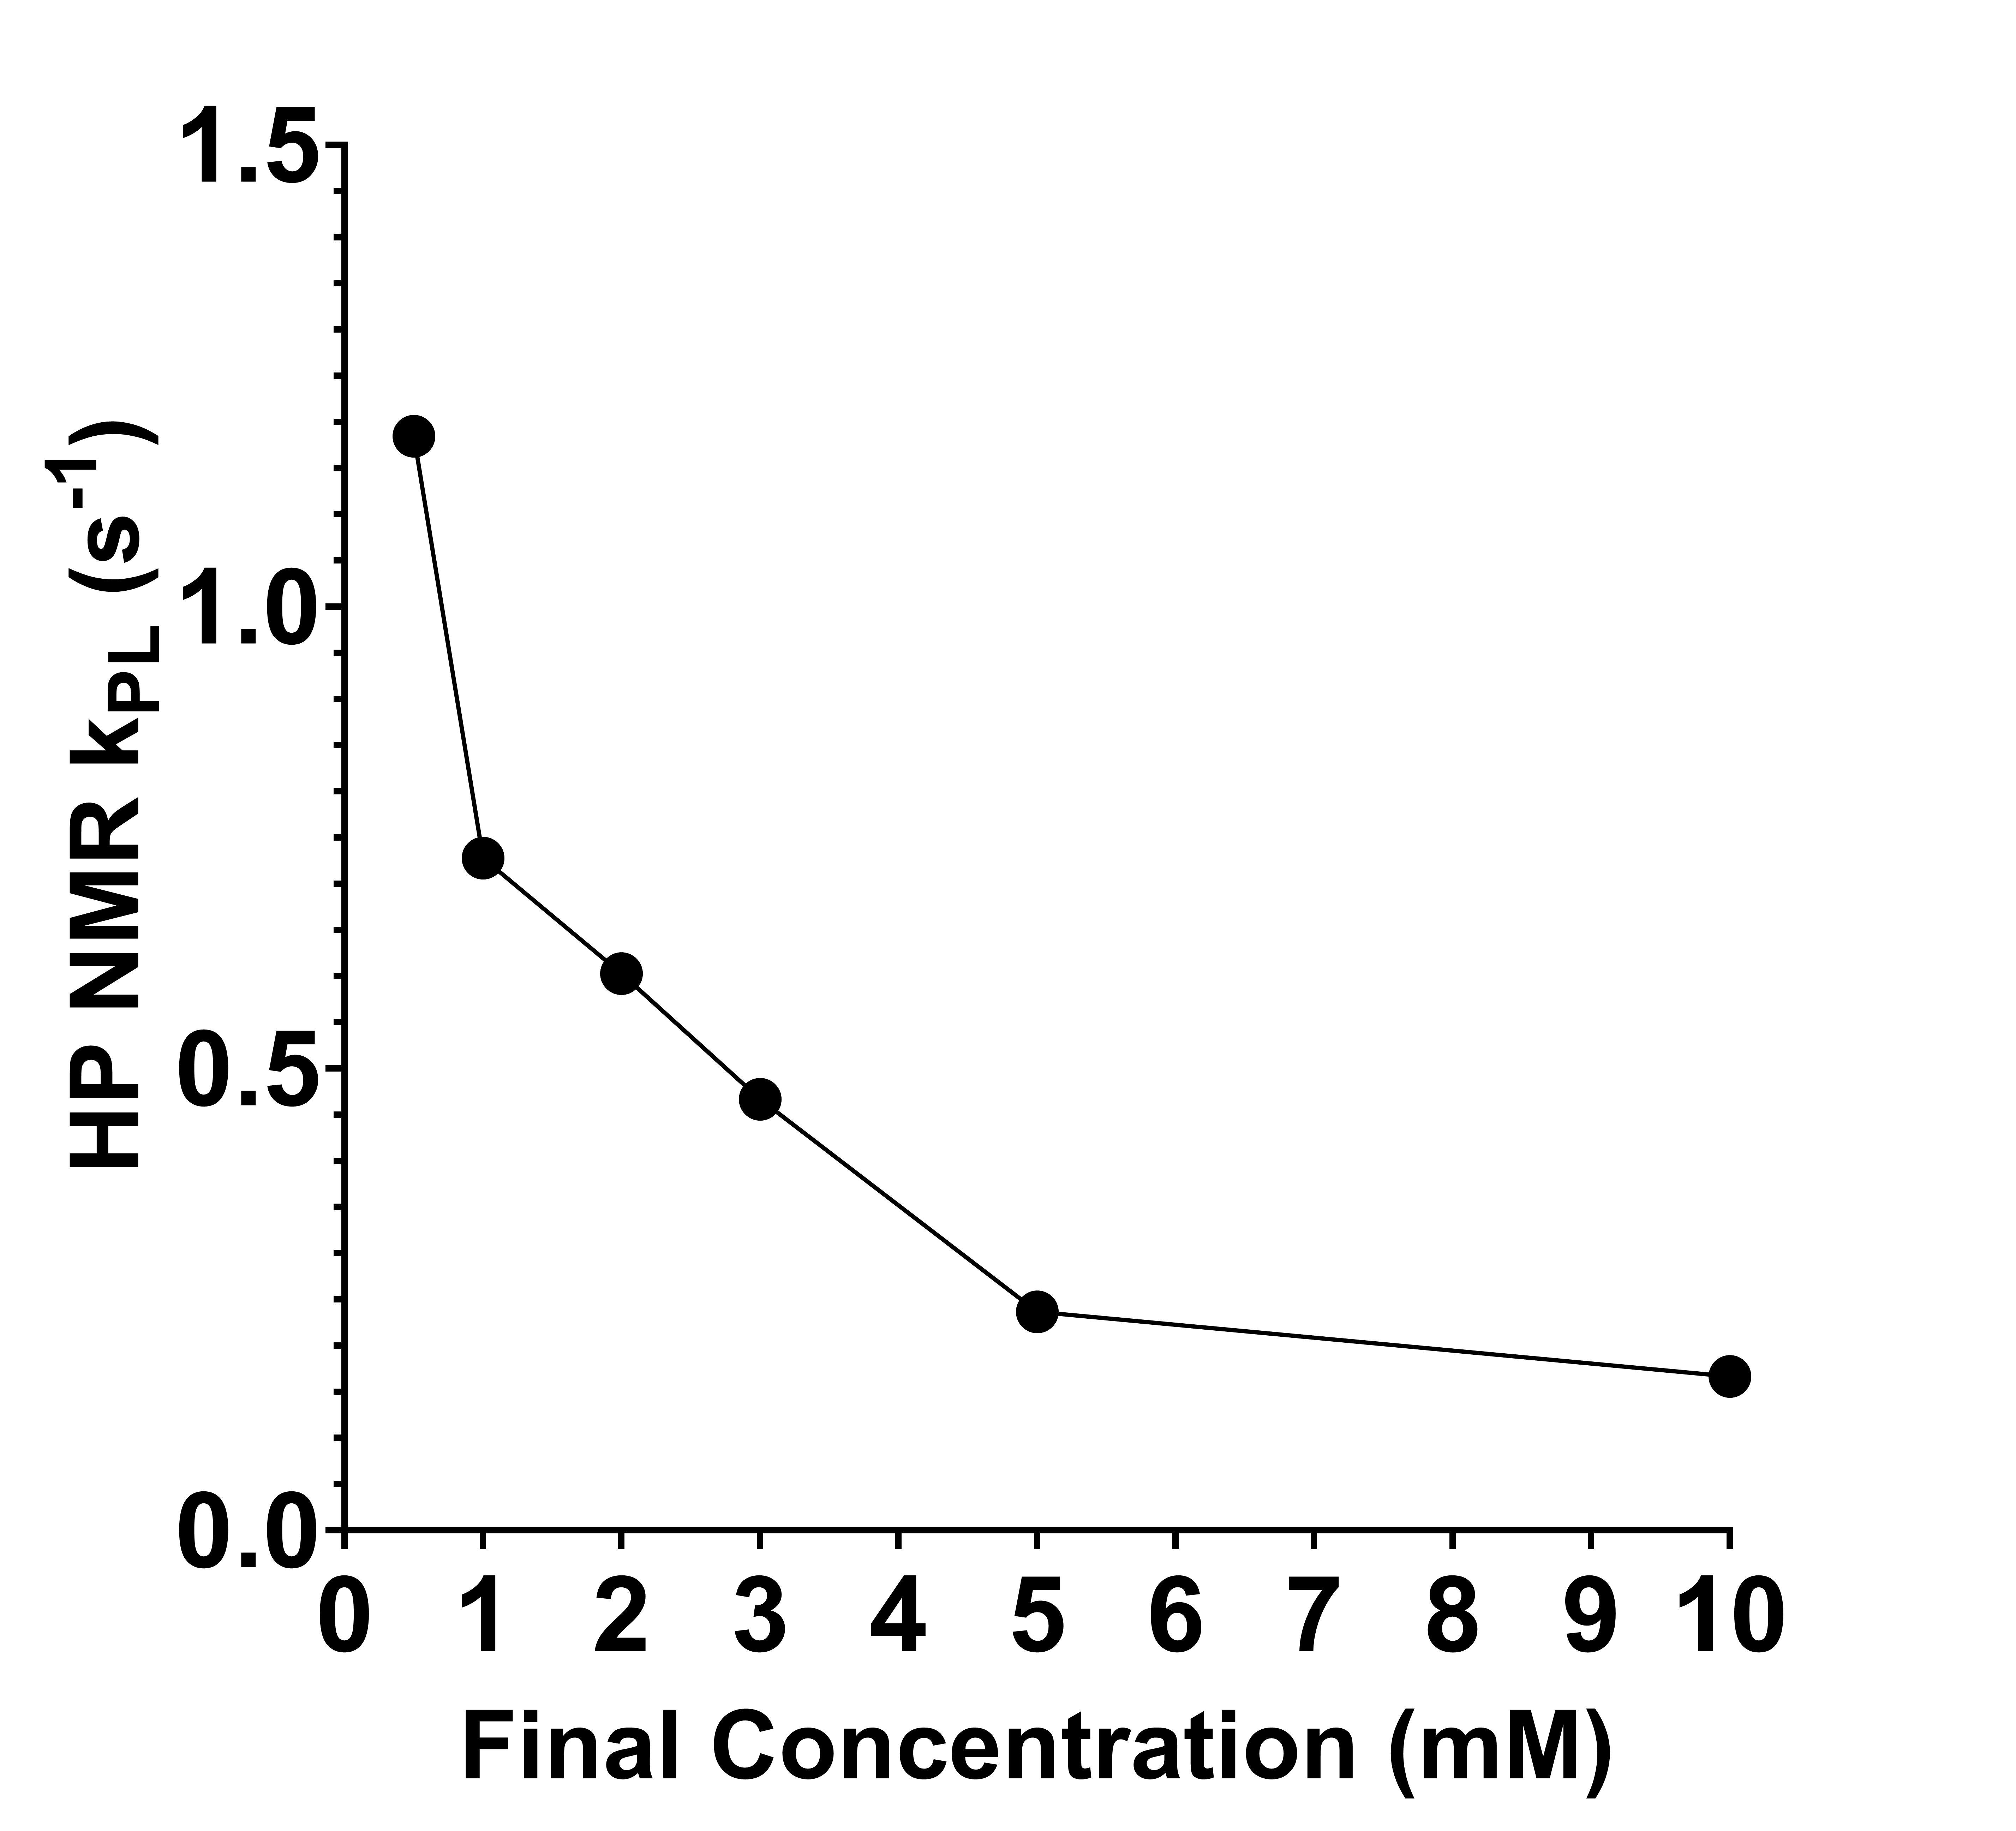
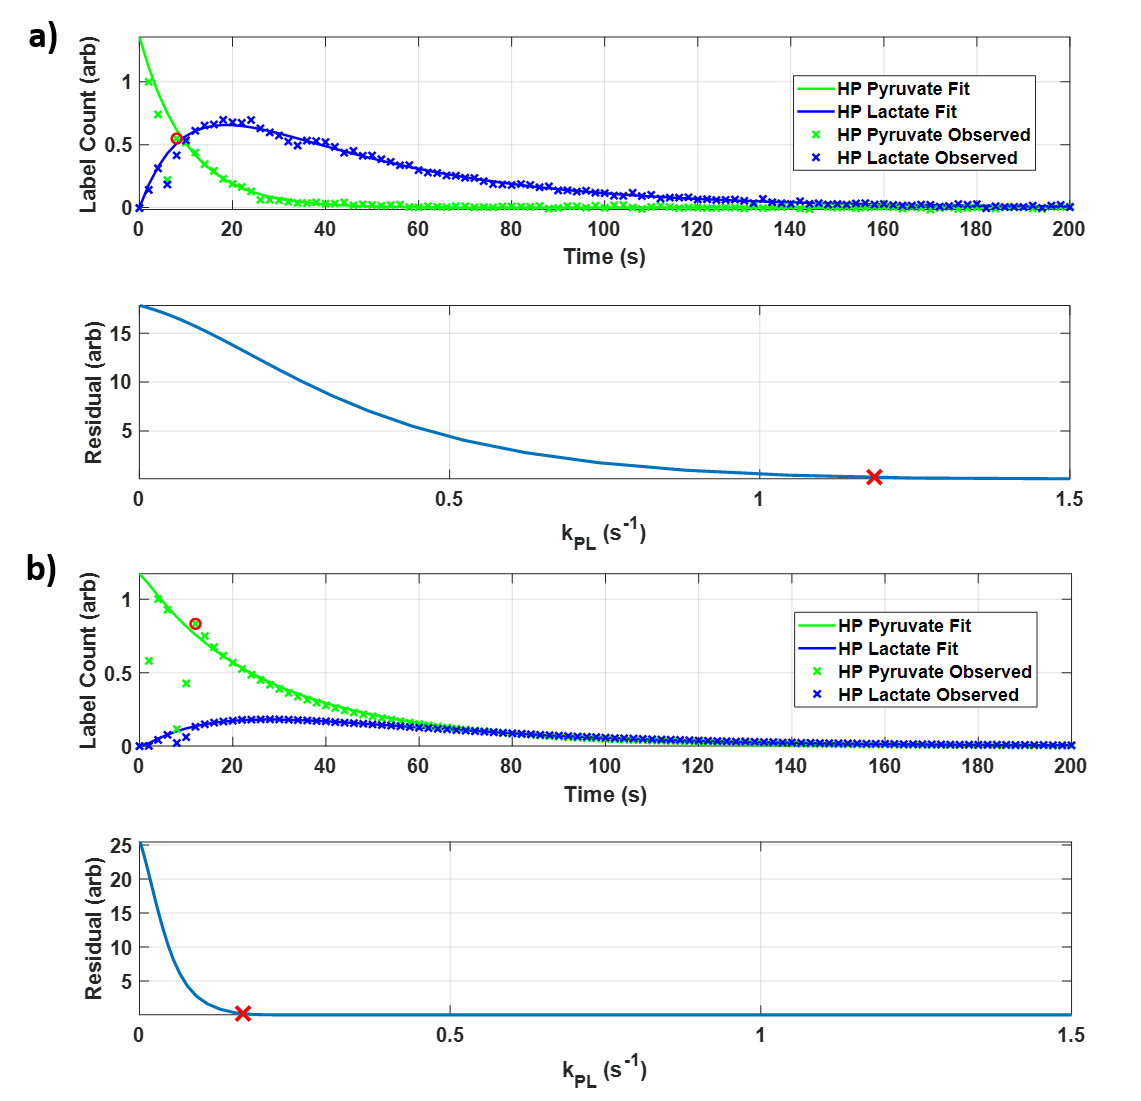
PK analysis of HP Hth-83 ATC in vivo experiments reveals that the highest kPL was observed when testing the lowest concentration (0.5 mM). Figure 2 captures the distinct trend that exists between intracellular kPL and concentration; as the final extracellular concentration continues to increase up to 10 mM, intracellular kPL values decrease.These effects can also be explored by analyzing the observed and fit HP pyruvate and lactate analysis curves for the contrasting 0.5 mM and 10 mM final concentration cases (Figure 3). There is a clear increase in the observed lactate AUC for the 0.5 mM final concentration case (Figure 3a, top, blue line), leading to an intracellular kPL=1.185 s-1 (Figure 3a, bottom). Contrastingly, there is a clear reduction in the observed lactate AUC for the 10 mM final concentration case (Figure 3b, top, blue line), leading to an intracellular kPL=0.167 s-1 (Figure 3b, bottom). The percent difference in the 0.5 and 10 mM kPL values was found to be approximately 150%.
Discussion and Conclusion
In our previous work9, IC-MS data showed a dramatic shift in pyruvate and lactate pool sizes when using 3 mM concentrations of HP pyruvate in media. This lead us to hypothesize that the concentration of pyruvate may have an effect on intracellular kPL. In this work, we show the distinct relationship between intracellular kPL and concentration. Additional studies to assess the mechanism and duration of this effect are currently underway. Improved understanding of the effect of concentration on kPL will allow for more reproducible quantification of kPL and improved PK modeling of in vivo and clinical HP MRI data.Acknowledgements
This work was supported by funding from the National Cancer Institute (R01CA211150, R01CA280980) and the National Institute of Diabetes and Digestive and Kidney Diseases (R01DK105346) of the National Institutes of Health, and the Cancer Prevention and Research Institute of Texas (RP170366). The content is solely the responsibility of the authors and does not necessarily represent the official views of the sponsors.References
1. Ardenkjaer-Larsen, J.H., et al., Increase in signal-to-noise ratio of > 10,000 times in liquid-state NMR. Proc Natl Acad Sci U S A, 2003. 100(18): p. 10158-63.
2. Day, S.E., et al., Detecting tumor response to treatment using hyperpolarized 13C magnetic resonance imaging and spectroscopy. Nature Medicine, 2007. 13: p. 1382.
3. Bankson, J.A., et al., Kinetic Modeling and Constrained Reconstruction of Hyperpolarized [1-13C]-Pyruvate Offers Improved Metabolic Imaging of Tumors. Cancer Res, 2015. 75(22): p. 4708-17.
4. Kurhanewicz J, Vigneron DB, Ardenkjaer-Larsen JH, et al. Hyperpolarized (13)C MRI: Path to Clinical Translation in Oncology. Neoplasia. 2019;21(1):1-16.
5. Kurhanewicz J, Vigneron DB, Brindle K, et al. Analysis of cancer metabolism by imaging hyperpolarized nuclei: prospects for translation to clinical research. Neoplasia. 2011;13(2):81-97.
6. Nelson SJ, Kurhanewicz J, Vigneron DB, et al. Metabolic imaging of patients with prostate cancer using hyperpolarized [1-(1)(3)C]pyruvate. Sci Transl Med. 2013;5(198):198ra108.
7. Aggarwal R, Vigneron DB, Kurhanewicz J. Hyperpolarized 1-[(13)C]-Pyruvate Magnetic Resonance Imaging Detects an Early Metabolic Response to Androgen Ablation Therapy in Prostate Cancer. Eur Urol. 2017;72(6):1028-1029.
8. Woitek R, McLean MA, Gill AB, et al. Hyperpolarized (13)C MRI of Tumor Metabolism Demonstrates Early Metabolic Response to Neoadjuvant Chemotherapy in Breast Cancer. Radiol Imaging Cancer. 2020;2(4):e200017.
9. Harlan CJ, Niedzielski JS, Michel KA, et al. Quantitative Evaluation of Pyruvate Uptake and Metabolism in Cells using Mass Spectrometry and Hyperpolarized 13C NMR. International Society of Magnetic Resonance in Medicine 30th Scientific Meeting (2022).
10. Lee, J., Ramirez, M. S., Walker, C. M., Chen, Y., Yi, S., Sandulache, V. C. et al. High-throughput hyperpolarized (13)C metabolic investigations using a multi-channel acquisition system. J. Magn. Reson. 260, 20–27 (2015).
11. Chen, Y., Maniakas, A., Tan, L. et al. Development of a rational strategy for integration of lactate dehydrogenase A suppression into therapeutic algorithms for head and neck cancer. Br J Cancer 124, 1670–1679 (2021).
Figures