4333
Factors influencing human brain metabolite SNR in studies with hyperpolarized [1-13C]pyruvate
Mary McLean1, Ashley Grimmer1, Elizabeth Latimer1, Alixander Khan1, Pascal Wodtke1, Joshua Kaggie1, James Grist2, Fulvio Zaccagna1, Martin Graves1, and Ferdia Gallagher1
1Radiology, University of Cambridge, Cambridge, United Kingdom, 2Physiology, Anatomy & Genetics, University of Oxford, Oxford, United Kingdom
1Radiology, University of Cambridge, Cambridge, United Kingdom, 2Physiology, Anatomy & Genetics, University of Oxford, Oxford, United Kingdom
Synopsis
Keywords: Hyperpolarized MR (Non-Gas), Brain
Human brain metabolite SNR in studies with hyperpolarized [1-13C]pyruvate was found to best correlate with percentage polarization in the liquid state and with the polarization adjusted for pyruvate concentration and the delay between dissolution and injection (‘injectable signal’). It did not depend on the volume of pyruvate injected, suggesting that the current dose (which is adjusted by body weight) is adequate. It may be worth further exploring whether the SNR of bicarbonate could be enhanced by a longer delay between injection and the start of acquisition. Liquid and solid-state polarizations did not correlate, highlighting the importance of liquid state measurement.Introduction
Studies with hyperpolarized [1-13C]pyruvate (HP-13C) are limited by the attainable SNR. It has been suggested1 that SNR of HP-13C in the prostate depends on the injected pyruvate volume, which is usually adjusted by weight (at our site, 0.4 ml/kg up to a maximum of 40 ml). We investigated whether there is a similar dependence in our studies of human brain, and to what degree data quality correlated with the liquid state polarization and other parameters.Methods
Data were analyzed from 2 HP-13C human brain studies2,3 using IDEAL spiral acquisitions4 in 11 subjects. Experimental parameters were precisely matched in 9/11 subjects (5 with grade 4 glioma, 4 healthy controls): beginning 10 s after the start of injection, an 8-step IDEAL cycle of spiral images (flip 15°, 3 slices, 3 cm thick, FOV 24 cm, resolution 40 x 40 pixels) was collected every 4 s (TR = 500 ms) until signal had disappeared. We measured the maximal SNR in apparently healthy grey matter (i.e. within the contralateral hemisphere in glioma patients) in area under the curve images of pyruvate (Pyr), lactate (Lac) and bicarbonate (BC). Metabolite SNR was plotted against: pyruvate concentration ([Pyr]), volume injected (VolP), and percentage polarization (Pol); the delay between dissolution and injection (ti); and the injectable signal1, calculated as: $$S_i = ([Pyr])(Pol)(exp(-t_i/T_1))\label{1}$$ where T1 in vitro was assumed to be 60 s. Linear correlations were also examined with the product of pyruvate volume injected and both Si and %Pol. Correlations were evaluated for significance using a 1-tailed t-test, assuming positive correlations with all parameters except ti.In one subject, an additional delay of approximately 6 s was inadvertently introduced between injection and the start of acquisition. Another subject had flip = 10°, TR = 260 ms, time resolution 2.1 s. The data acquired with these protocol deviations were compared against those with the standard protocol.
It has been suggested by the Spinlab manufacturer (General Electric) that the solid-state polarization readouts might be a more reliable quality metric: although this parameter was not available for the patients included here, correlations between liquid and solid-state polarization levels were examined for 20 experiments performed between July and December 2021.
Results
SNR of Pyr and BC were significantly dependent on %Pol, with a similar positive trend for Lac SNR (Fig 1; Table 1). Correlations of metabolite SNR with [Pyr], VolP and ti were all non-significant. The parameter Si correlated more strongly than %Pol alone with SNR of Pyr and Lac, but less strongly with SNR of BC. Including VolP in the model weakened correlations both for %Pol and Si.In the subject with lower flip angle and shorter TR (Fig 1, grey squares), SNR trended a bit low in comparison with subjects of similar polarization and Si. In the subject with an increased delay before acquisition (Fig 1, orange triangles), the SNR of Pyr was similar to the other cases, while that of Lac trended higher and SNR of BC was a particularly high outlier.
For the 20 experiments performed in late 2021 (Fig 2), there was no correlation between liquid and solid-state polarization levels reported (R2= 0.007).
Discussion
The finding that metabolite SNR correlated with the liquid state polarization is unsurprising but merits emphasis since new QC devices lack a liquid-state readout. This may be cause for concern since many groups in future may rely on the solid-state polarization levels which do not correlate with the liquid state levels.The lack of correlation of metabolite SNR with ti and [Pyr] is probably explained by how tightly these parameters were distributed, with CoV of only 8 and 2% respectively. Even so, the combination of these parameters with %Pol into Si1 did lead to stronger correlations than for %Pol alone with measured SNR of Pyr and Lac though not BC. VolP did not correlate with SNR of any metabolite; and adjusting either %Pol or Si by this volume decreased the strength of correlations with SNR observed. This supports our decision to continue adjusting injected volume by weight, as it seems likely that the dose given already exceeds the capacity of transport, at least in healthy brain and brain tumours.
The subject scanned with lower flip angle and finer time resolution had metabolite SNRs consistent with the other subjects, suggesting there was no strong advantage or penalty to this approach. However, the subject with an additional delay between injection and scanning showed a markedly higher SNR of BC. This suggests it may be worth increasing this delay in the protocol in future, although we can’t rule out biological variation as the source of the difference. One disadvantage of longer delay would be that our current ‘frequency domain’ method of analysis5 requires acquisition of the entire metabolite curve, so that missing bolus arrival would require a different modelling approach.
Conclusion
Liquid-state polarization was shown to correlate with brain metabolite SNR but not with solid-state polarization readouts. SNR is unlikely to be improved by increasing the volume of Pyr injected but may perhaps be improved by increasing the delay between injection and scanning.Acknowledgements
We acknowledge support from Cancer Research UK, The Cambridge Experimental Cancer Medicine Centre, the CRUK Cambridge Centre, NIHR Cambridge BRC, NIHR Cambridge Clinical Research Facility, Addenbrooke’s Charitable Trust, the Evelyn Trust, and the MS Society.References
1. Korn N, Gordon J, Delos Santos J, et al. Research polarizer quality control metrics and resulting SNR in human prostate cancer patients. Proc. ISMRM 2019, 4325.2. Grist J, McLean MA, Riemer F, et al. Quantifying hyperpolarized [1-13C]pyruvate metabolism within the normal human brain using magnetic resonance imaging. Neuroimage 2019;189:171-179.
3. Zaccagna F, McLean MA, Grist JT, et al. Imaging glioblastoma metabolism using hyperpolarized [1-13C]pyruvate demonstrates heterogeneity in lactate labelling driven by perfusion and LDH-A expression. Radiology Imaging Cancer 2022;4(4):e210076.
4. Wiesinger F, Weidl E, Menzel MI, et al. IDEAL spiral CSI for dynamic metabolic MR imaging of hyperpolarized [1-(13) C]pyruvate. Magn Reson Med 2012; 68:8-16.
5. Khegai O, Schulte RF, Janich MA, et al. Apparent rate constant mapping using hyperpolarized [1-13C]pyruvate. NMR Biomed 2014;27:1256-1265.
Figures
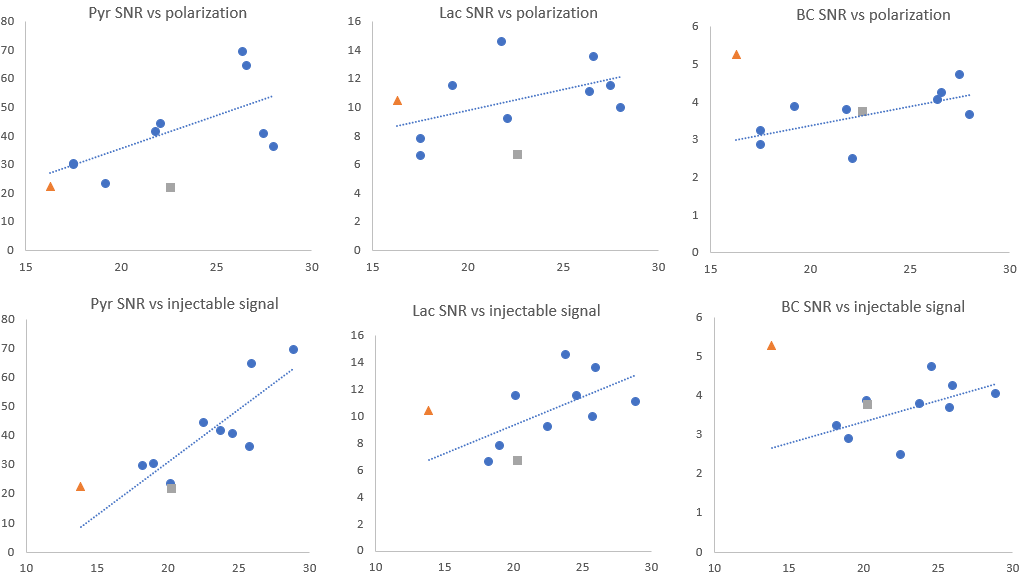
Figure 1: Correlations of metabolite SNR with percent polarization (top row) and ‘injectable signal’ (bottom row; Eqn 1). Blue circles are subjects with matching protocols; orange triangle had increased delay between injection and scanning; grey square had lower flip angle and shorter TR.
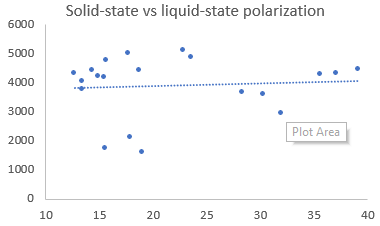
Figure 2: Correlation of solid-state vs liquid-state polarization as reported by the Spinlab for 20 samples between July-Dec 2021.
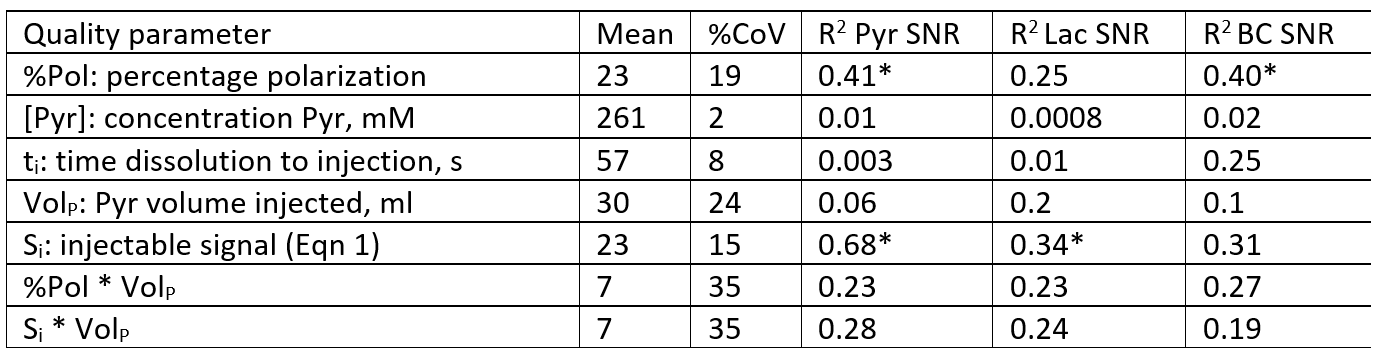
Table 1: Correlations between metabolite SNR and quality control parameters in hyperpolarization experiments using IDEAL spirals in human brain. (*significant at p<0.05: threshold in 1-tailed t-test with 8 degrees of freedom is R2 ≥ 0.33).
DOI: https://doi.org/10.58530/2023/4333