4331
Metabolic Dysregulation in Rat Brain with Diabetes and Alzheimer’s Disease as Assessed by Hyperpolarized [1-13C] Pyruvate1Radiology, Stanford University, Stanford, CA, United States, 2Biochemistry and Molecular Medicine, University of California, Davis, CA, United States, 3Nutrition, University of California, Davis, CA, United States
Synopsis
Keywords: Hyperpolarized MR (Non-Gas), Alzheimer's Disease, Neurodegenerative Metabolism Diabetes MRI MRS
Epidemiology studies have detected type 2 diabetes (T2D) increasing the risk of Alzheimer’s disease (AD). How insulin insensitivity in T2D influences AD onset/progression poses a puzzling question. In this study using dynamic nuclear polarization (DNP) magnetic resonance (MR) experiments, we interrogated the metabolic alteration by following the conversion of [1-13C]Pyr in the brain of control (CRL), T2D with no AD (T2D-AD -/-), and T2D with AD (T2D-AD +/-) rats. Pyruvate dehydrogenase (PDH) activity decreases in T2D and decreases further in T2D with AD.Introduction
Epidemiological studies have observed that type 2 diabetes (T2D) increases the risk of Alzheimer’s disease (AD)1. The observation challenges some T2D and AD paradigms. With diabetes, the orthodox view envisions insulin insensitivity involves dysregulations in the organ triumvirate: pancreas, liver, and muscle. Even though brain has insulin receptors, its glucose metabolism doesn’t appear to fall under insulin control. Brain always takes its cut of glucose under all prandial conditions in which insulin level fluctuates dramatically. Similarly, conventional research has focused on the amyloid plaque formation, tau protein phosphorylation, and microglia-glia distribution to explain AD onset/progression. Metabolic alteration has no prominent role. Yet, T2D accelerates AD onset/progression.In this study, using dynamic nuclear polarization (DNP) magnetic resonance (MR) techniques, we have assessed the metabolic profiles of brains from normal, T2D, and T2D with AD rats and have nevertheless detected marked metabolic differences.
Methods
Animal model:We developed a rat model that exhibits both T2D and AD (T2D-AD +/-). These hemizygous animals contain the genes APPswe and PS1ΔE9 and display amyloid burden as early as 6 months of age2. Control (CRL), T2D-AD -/- (diabetes only) and T2D-AD +/- (diabetes and Alzheimer's) Sprague Dawley rats were anesthetized using 1–3% isoflurane in 1.5 L/min oxygen and catheterized in tail vein. Vital signs were monitored throughout the experiments. The respiration and the body temperature were maintained at ~60 breaths/min and ~37 °C, respectively, by adjusting the isoflurane and blanket temperature.
Substrate preparation:
54ul of 15.5M [1-13C] Pyruvic acid (Signa Aldrich) mixed with 15mM trityl radical AH11141(GE Medical systems) was polarized in SPINLab (GE) and dissolved with 16g of 40mM tris(hydroxymethyl)aminomethane, 125mM NaOH, 100mg/L ethylenediaminetetraacetic acid (EDTA) and 50mM NaCl, resulting in a 125mM pyruvate solution.
MR signal acquisition:
A custom-built birdcage coil tuned to the 1H resonance was used to acquire anatomical reference T2-weighted images (256x256, 2mm thick, 0.5mm in-plane resolution). B0 field inhomogeneity was reduced by minimizing the linewidth of the unsuppressed water signal using the linear shim currents and a 1H point-resolved spectroscopy sequence. 3ml of the hyperpolarized [1-13C] Pyruvate solution was injected into the animal through the tail-vein catheter and a custom-made 13C surface coil (dia. = 3 cm) was used to acquire the dynamic free induction decay from an axial 10 mm slice of the brain (flip angle = 10°, pulse width = 1800 μs, temporal resolution = 3 s, spectral width/points = 5 kHz/2048, acquisition time = 2 min.). The acquired 13C data were apodized by a Gaussian filter (5 Hz) and zero-filled by a factor of four along the spectral dimension. Metabolite levels were assessed by integrating the respective peak in the absorption mode from time-averaged spectra (0–2 min). Metabolite ratios were measured relative to the total 13C signal (tC)3. The statistical significance was evaluated using a single factor ANOVA analysis, α = 0.05.
Results
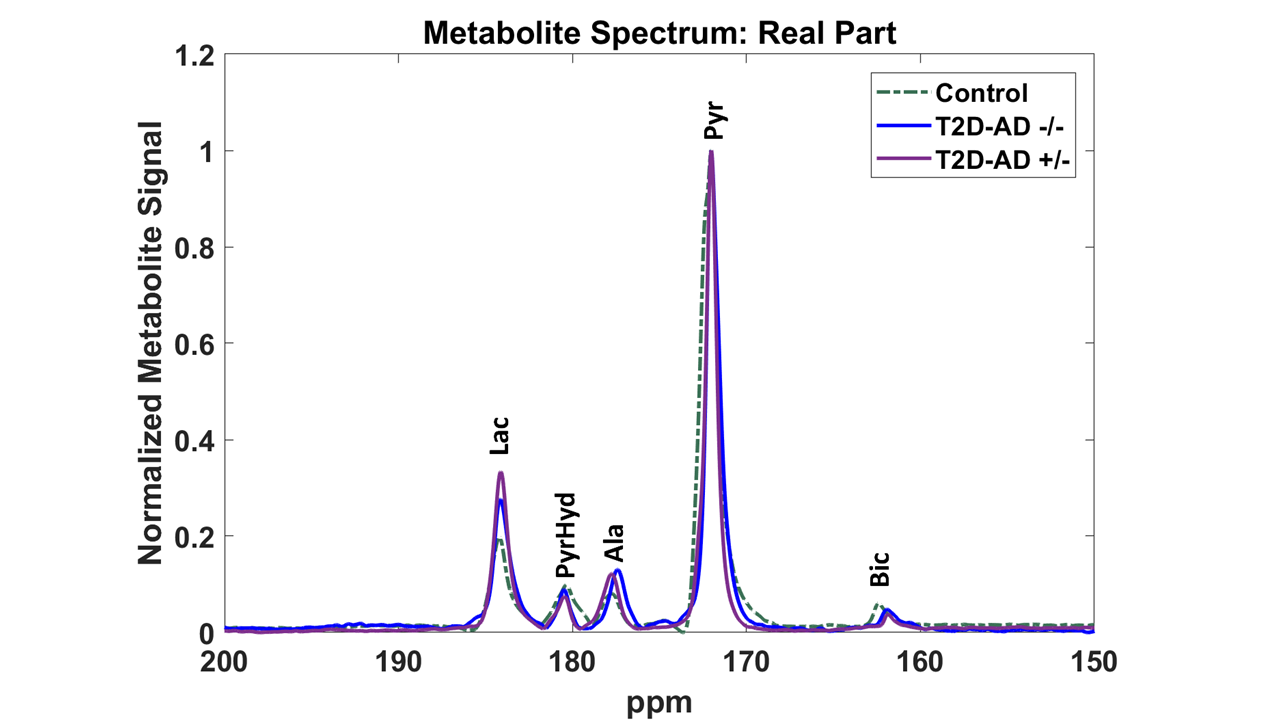
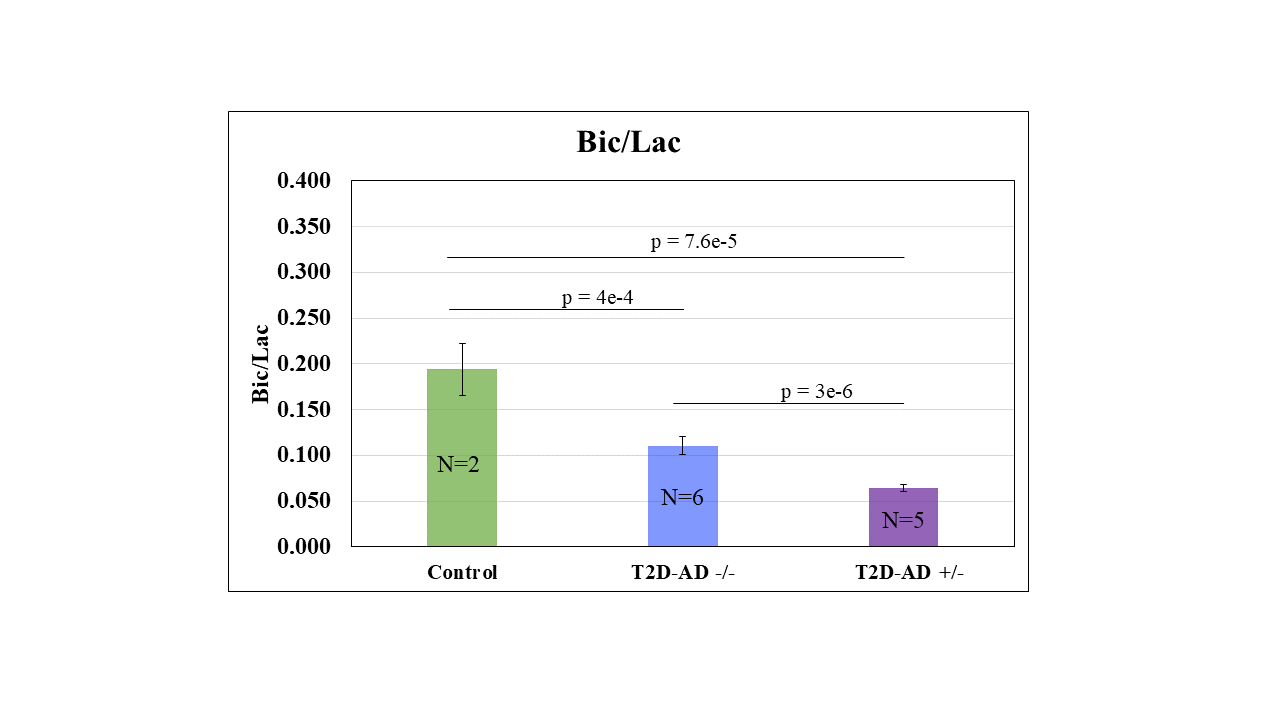
The representative spectra from the three different models show brain metabolism alterations in lactate (Lac) and bicarbonate (Bic) (Figure 1). Brain metabolism differs significantly in CRL, T2D-AD -/-, and T2D-AD +/- rats (Figure 2). The Bic/Lac ratio, which reflects the pyruvate dehydrogenase (PDH) activity, decreases from CRL to T2D-AD -/-, and T2D-AD +/-. Diabetes decreases the Bic/Lac ratio from 0.194 ± 0.028 (CRL) to 0.11± 0.010 (T2D-AD -/-), p = 4e-4. Diabetes with an AD overlay drops the Bic/Lac further to 0.064 ± 0.004 (T2D-AD +/-), p = 3e-6. .Conclusion
Relative to the CRL, T2D animals with insulin insensitivity display a decreased PDH activity. AD further decreases the activity. The experiment observations suggest that T2D and AD brains suffer from a pronounced metabolic dysregulation.Acknowledgements
We gratefully acknowledge funding support from California Department of Public Health 18-10923.
References
1. Leibson C., Rocca W., Hanson, V. et al. Risk of dementia among persons with diabetes mellitus: a population-based cohort study. Am J Epidemiol 1997: 145: 301-308.
2. Jue, T., Graham, J., Rehman, U. et al. Studying the Impact of Diabetes on the Pathogenesis of Alzheimer’s Disease. 2023 ISMRM submitted Abstract ID: 6149.
3. Park, J. M., Josan, S., Hurd, R. E. et al. Hyperpolarized NMR study of the impact of pyruvate dehydrogenase kinase inhibition on the pyruvate dehydrogenase and TCA flux in type 2 diabetic rat muscle. Pflug-A. Eur J Physiol. 2021; 473, 1761–1773. https://doi.org/10.1007/s00424-021-02613-3.
Figures