4328
Hyperpolarized 15N choline chloride to study choline metabolism in prostate cancer at 7T.1Small Animal Imaging Lab, Moffitt Cancer Center, Tampa, FL, United States, 2Moffitt Cancer Center, Tampa, FL, United States, 3MD Anderson Cancer Center, Houston, TX, United States, 4Radiology Department, Moffitt Cancer Center, Tampa, FL, United States
Synopsis
Keywords: Hyperpolarized MR (Non-Gas), Cancer
Elevated concentrations of choline and phosphocholine are known to be a metabolic hallmark for tumor hypoxia in prostate cancer. An inhibition of hyperpolarized 15N choline to phosphocholine conversion is shown in this work in hypoxic PC-3 cells in-vitro as seen by other methods in the literature. In-vivo tumor volumes and hyperpolarized 15N phosphocholine to choline ratios were measured in twelve NSG mice with subcutaneous flank xenograft PC-3 tumors, showing a moderate correlation. The findings in this work support the hypothesis that hyperpolarized 15N-Choline may be useful as a marker of malignancy.
INTRODUCTION
Concentrations of choline (Cho), phosphocholine (PCho) and glycerophosphocholine have been observed and known to be a metabolic hallmark associated with tumor hypoxia and progression in prostate1,2 and breast cancer3,4. Magnetic resonance spectroscopy (MRS) has been shown to quantify the relative concentrations of these metabolites in-vivo. Improvements are possible using hyperpolarized substrates due to sensitivity enhancement5 compared to 1H-MRS. Furthermore, hyperpolarized 15N substrates have the advantage of longer T1 decay6 comparing to 13C substrates7. In this work, hyperpolarized 15N choline chloride was used in-vitro and in-vivo, demonstrating 15N-Cho uptake and metabolism to PCho in PC-3 prostate cancer. The PCho/Cho-ratio was correlated to tumor growth in untreated mice.METHODS
All MRI experiments were done in a 7T horizontal magnet (Agilent-Technologies) and Bruker electronics (BioSpec AV3HD). A HyperSense DNP polarizer (Oxford Instruments, Abingdon, UK) was used to polarize 15N-labeled choline chloride for 2 hours. A 1H-15N double resonance 35mm volume birdcage coil (Doty Scientific) was used for all in-vitro MRS experiments.Two separated groups of two hundred million PC-3 cells were cultured in-vitro under normoxic conditions (21% oxygen) for MRS in-vitro experiments. One group was placed under hypoxic conditions (1% oxygen) for 24 hours before MRS acquisition. Hyperpolarized 15N-Cho dissolution (3 mL) was mixed for 10 seconds with the PC-3 cells in a 2 cm NMR tube and placed in the MRI scanner for MRS acquisition with a single-pulse spectroscopic sequence (150 Repetitions with TR=2 seconds, 3o flip angle, 6 kHz spectral width, and 35.45 MHz center frequency). The total acquisition time was 300 seconds.
All animal experiments followed a protocol approved by the local institutional animal research committee. Twelve NSG mice were implanted with PC-3 tumor cells in the right flank and anesthetized with 2% isoflurane in O2 during data acquisition. Anatomical T2-weighted axial images were acquired using the volume-coil described before with a TurboRARE-sequence ( TR/TE= 2000/37 ms, FOV = 30×30 mm2, image size 256×256 and 19 slices of 1.5 mm thickness) prior to hyperpolarized 15N MRS acquisition for tumor volume measurements.
A 1H-15N double resonance 8mm diameter surface-coil (Doty-Scientific) was used for all in-vivo MRS experiments. The surface coil was placed on top of the tumor to acquire 15N MRS with a non-localized single-pulse spectroscopic sequence (29 Repetitions with TR=4 seconds, 7o flip angle, 6 kHz spectral width, and 35.45MHz center frequency). MRS acquisition started 15 seconds after tail veil injections of 0.3 mL/90 mM pre-polarized 15N-Cho to preserve signal and allow conversion to PCho.
Atropine was injected at 1mg/ml, 15 minutes before the hyperpolarized injection to increase the low heart rate caused by Cho7.
RESULTS
Hyperpolarized 15N-Cho uptake and its conversion to PCho in normoxic PC-3 cells is shown in Figure-1(a). An inhibition of 15N-PCho conversion was found in hypoxic PC-3 cells as depicted in Figure-1(b) where 15N-Cho was visible.All MRS data was processed and Cho and PCho peaks were deconvolved in Matlab (Mathworks, Inc.) using MatNMR8 as shown in Figure-2(a). All temporal signal decay was calculated as the area under the curve after deconvolution of each peak as shown in Figure-2(b). The maximum PCho/Cho-ratio in normoxic cells was 0.64±0.01. PCho/Cho-ratio for each mouse was calculated the same way and shown in Figure-5(a).
Figure-3 shows two representative dynamic 15N spectra acquired in-vivo (a: mouse#9, c: mouse#6) with corresponding temporal signal decay graph of Cho and PCho (b: mouse#9, d: mouse#6).
Tumor volumes were computed in Matlab by manually segmenting the tumor contours as shown in Figure 4. All tumor volumes are shown in Figure-5(a) and correlated with PCho/Cho-ratio in Figure-5(b). A moderate positive linear correlation was found with R2=0.6136 between the tumor volumes and the PCho/Cho-ratio. Although the slope of the correlation was relatively small of only 0.0003 with 95% confidence.
DISCUSSION
The inhibition of 15N-PCho conversion in hypoxic PC-3 cells in-vitro agrees with previous work2. Others have found an increased PCho/Cho-ratio in SCID mice9 in contradiction with the in-vitro results shown here and by Basal et al 2.A high variability of PCho/Cho-ratio was found in-vivo between all twelve mice. Even though tumor growth might not be a direct indicator for hypoxia, larger tumors are more likely to have hypoxic areas. The moderate correlation between PCho/Cho-ratio and tumor-volume found in this work could indicate that phosphorylation increases with hypoxia in PC-3 tumors in-vivo as found by Glunde et al9. Despite the disagreement, findings shows PCho/Cho ratios may be sensitive to tumor malignancy and disease progression. Combining hyperpolarized 15N-MRS with other MRI studies like DCE and DWI and corregistration with histology may lead to further understanding of the full potential of these new metabolic markers. In future work, this may be a promising biomarker to be tested in therapy response.
CONCLUSIONS
This study demonstrated the possibility to study metabolism using hyperpolarized 15N-Cho in prostate cancer. A moderate correlation between PCho/Cho-ratio and volume of untreated PC-3 tumors was found in this work. The findings in this work support the hypothesis that hyperpolarized 15N PCho/Cho-ratio can be used as a marker of malignancy and may be used to monitor cancer progression. Further work is needed to assess the potential of these markers for monitoring cancer progression and treatment response.Acknowledgements
This work has been supported in part by the SAIL Core Facility at the H. Lee Moffitt Cancer Center & Research Institute and NCI designated Comprehensive Cancer Center (P30-CA076292).
References
- Glunde K, Bhujwalla ZM, Ronen SM. Choline metabolism in malignant transformation. Nat Rev Cancer. 2011 Nov 17;11(12):835-48. doi: 10.1038/nrc3162.
- Bansal A, Harris RA, DeGrado TR. Choline phosphorylation and regulation of transcription of choline kinase α in hypoxia. J Lipid Res. 2012 Jan; 53(1):149-57. doi: 10.1194/jlr.M021030. Epub 2011 Oct 24.
- Katz-Brull R, Margalit R, Bendel P, Degani H. Choline metabolism in breast cancer; 2H-, 13C- and 31P-NMR studies of cells and tumors. MAGMA. 1998 Aug;6(1):44-52.
- Katz-Brull R, Seger D, Rivenson-Segal D, Rushkin E, Degani H. Metabolic markers of breast cancer: enhanced choline metabolism and reduced choline-ether-phospholipid synthesis. Cancer Res. 2002 Apr 1;62(7):1966-70.
- Ardenkjaer-Larsen JH1, Fridlund B, Gram A, Hansson G, Hansson L, Lerche MH, Servin R, Thaning M, Golman K. Increase in signal-to-noise ratio of > 10,000 times in liquid-state NMR. Proc Natl Acad Sci U S A. 2003 Sep 2;100(18):10158-63. Epub 2003 Aug 20.
- Cristina Gabellieri, Steven Reynolds, Arnon Lavie, Geoffrey S. Payne, Martin O. Leach, and Thomas R. Eykyn. Therapeutic Target Metabolism Observed Using Hyperpolarized 15N Choline. Journal of the American Chemical Society 2008 130 (14), 4598-4599 DOI: 10.1021/ja8001293.
- Friesen-Waldner LJ, Wade TP, Thind K, Chen AP, Gomori JM, Sosna J, McKenzie CA, Katz-Brull R. Hyperpolarized choline as an MR imaging molecular probe: feasibility of in-vivo imaging in a rat model. J Magn Reson Imaging. 2015 Apr;41(4):917-23. doi: 10.1002/jmri.24659. Epub 2014 May 27.
- 8. Van Beek JD.MatNMR: a flexible toolbox for processing, analyzing and visualizing magnetic resonance data in Matlab. J Magn Reson. 2007 Jul;187(1):19-26. Epub 2007 Apr 7.
- Glunde K, Shah T, Winnard PT Jr, Raman V, Takagi T, Vesuna F, Artemov D, Bhujwalla ZM. Hypoxia regulates choline kinase expression through hypoxia-inducible factor-1 alpha signaling in a human prostate cancer model. Cancer Res. 2008 Jan 1;68(1):172-80. doi: 10.1158/0008-5472.CAN-07-2678.
Figures
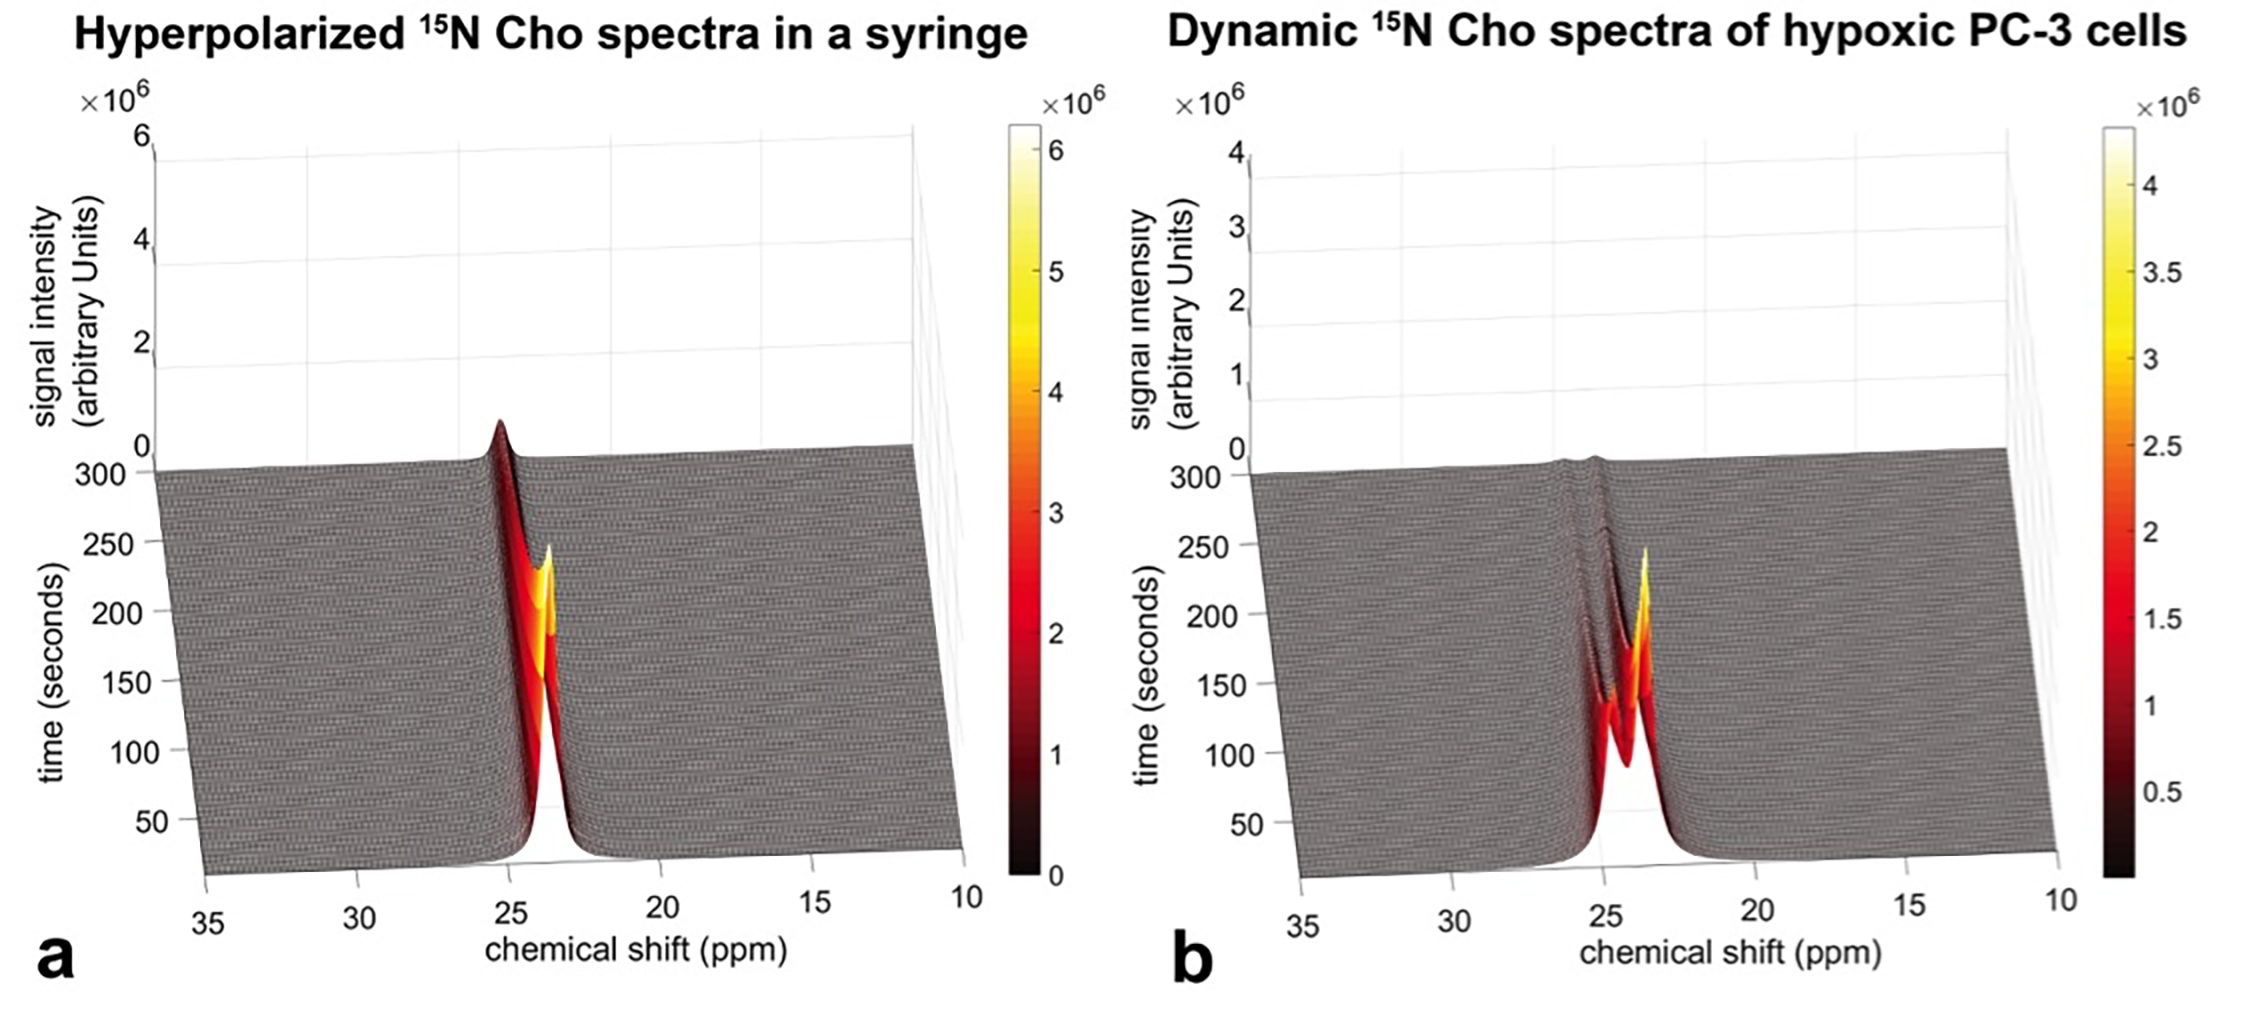
Figure-1: Dynamic hyperpolarized 15N-Cho spectra at 7T. (a) Hyperpolarized 15N-Cho spectra mixed with two hundred million normoxic PC-3 cells. (b) Hyperpolarized 15N-Cho dissolution mixed with two hundred million PC-3 cells after hypoxic conditions for 24 hours. Spectra were acquired every 2 seconds from 10 to 300 seconds after hyperpolarized 15N-Cho dissolution.
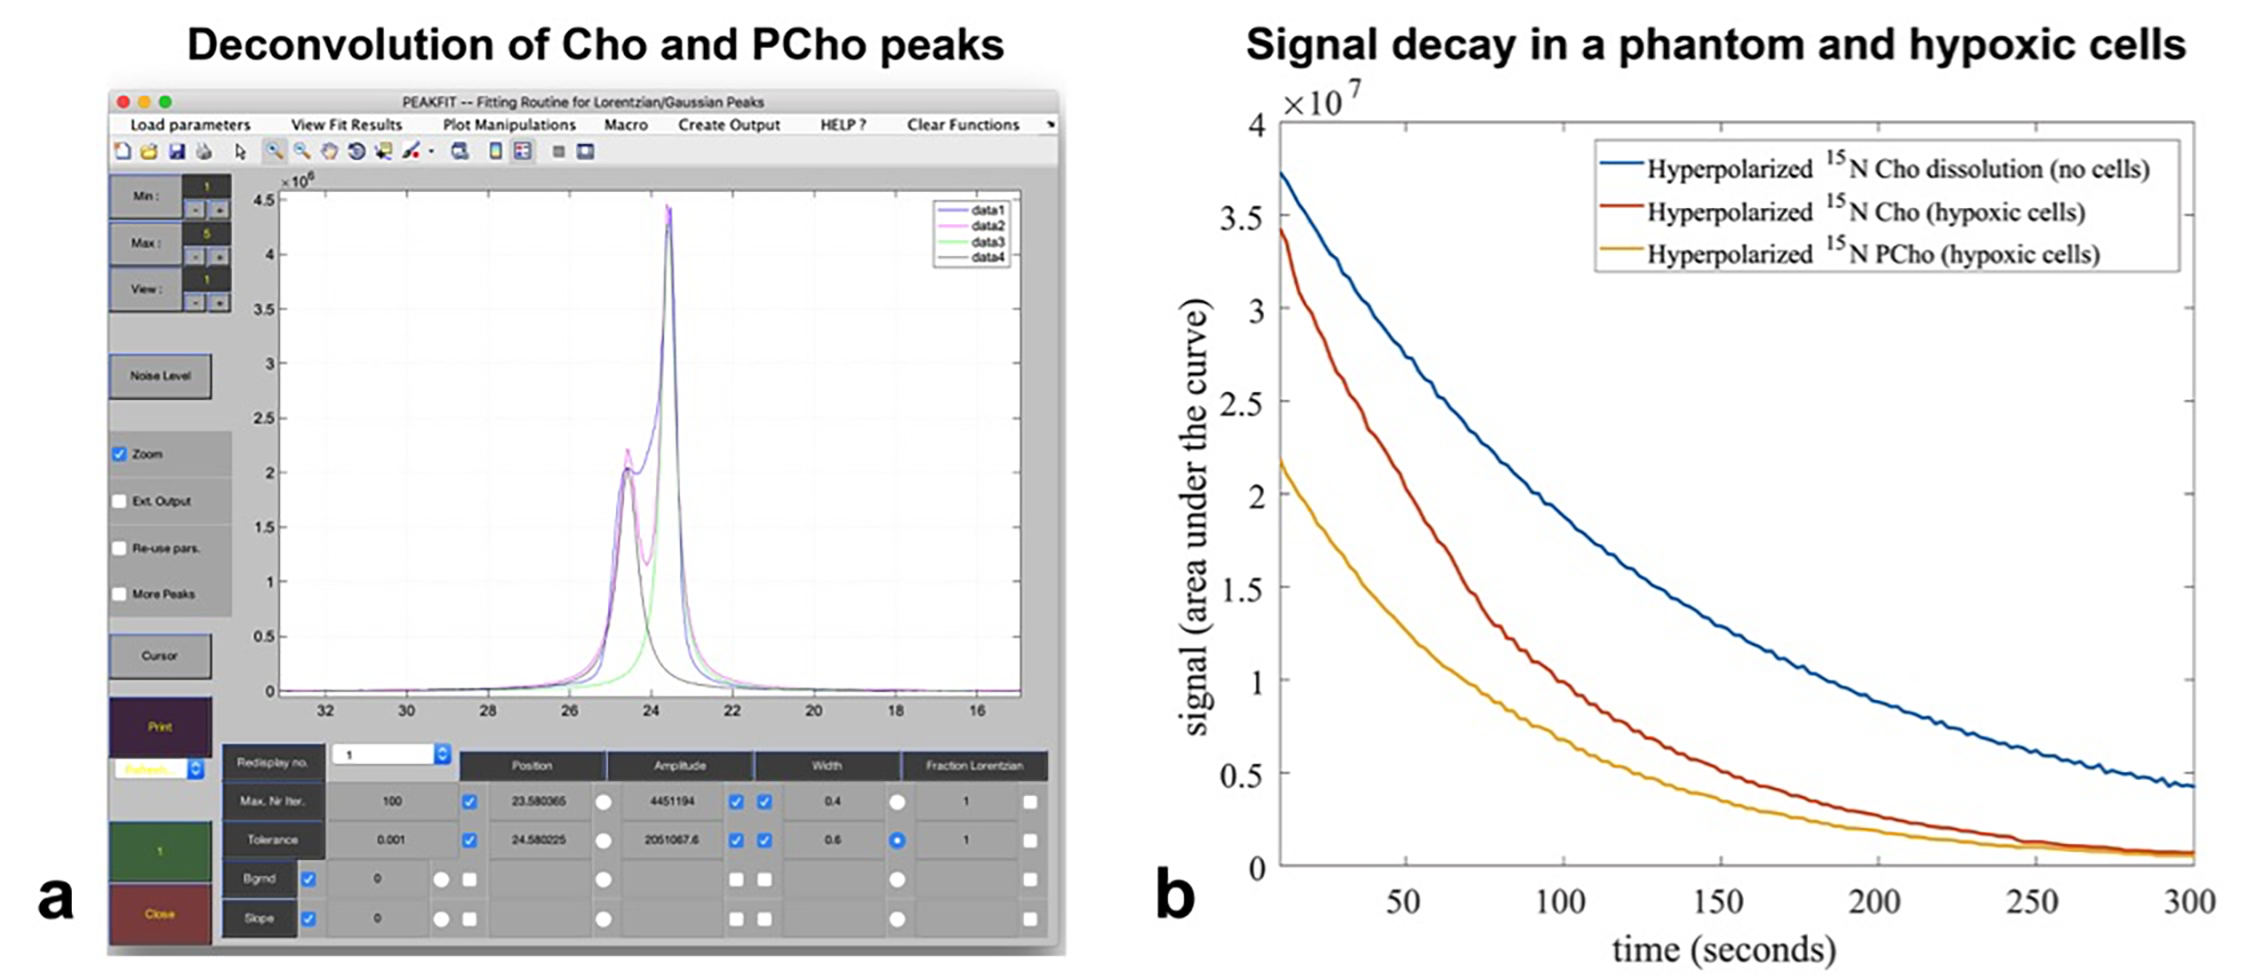
Figure-2: Hyperpolarized 15N-Cho and PCho deconvolution and temporal quantification of in-vitro spectra in PC-3 cells. (a) Screenshot of 15N-Cho and PCho peaks deconvolution at 10 seconds after hyperpolarized 15N-Cho delivery in normoxic cells using MatNMR. (b) Temporal signal decay of hyperpolarized 15N-Cho and PCho in two hundred million PC-3 cells under hypoxic conditions compared to hyperpolarized 15N-Cho dissolution in a syringe without cells.
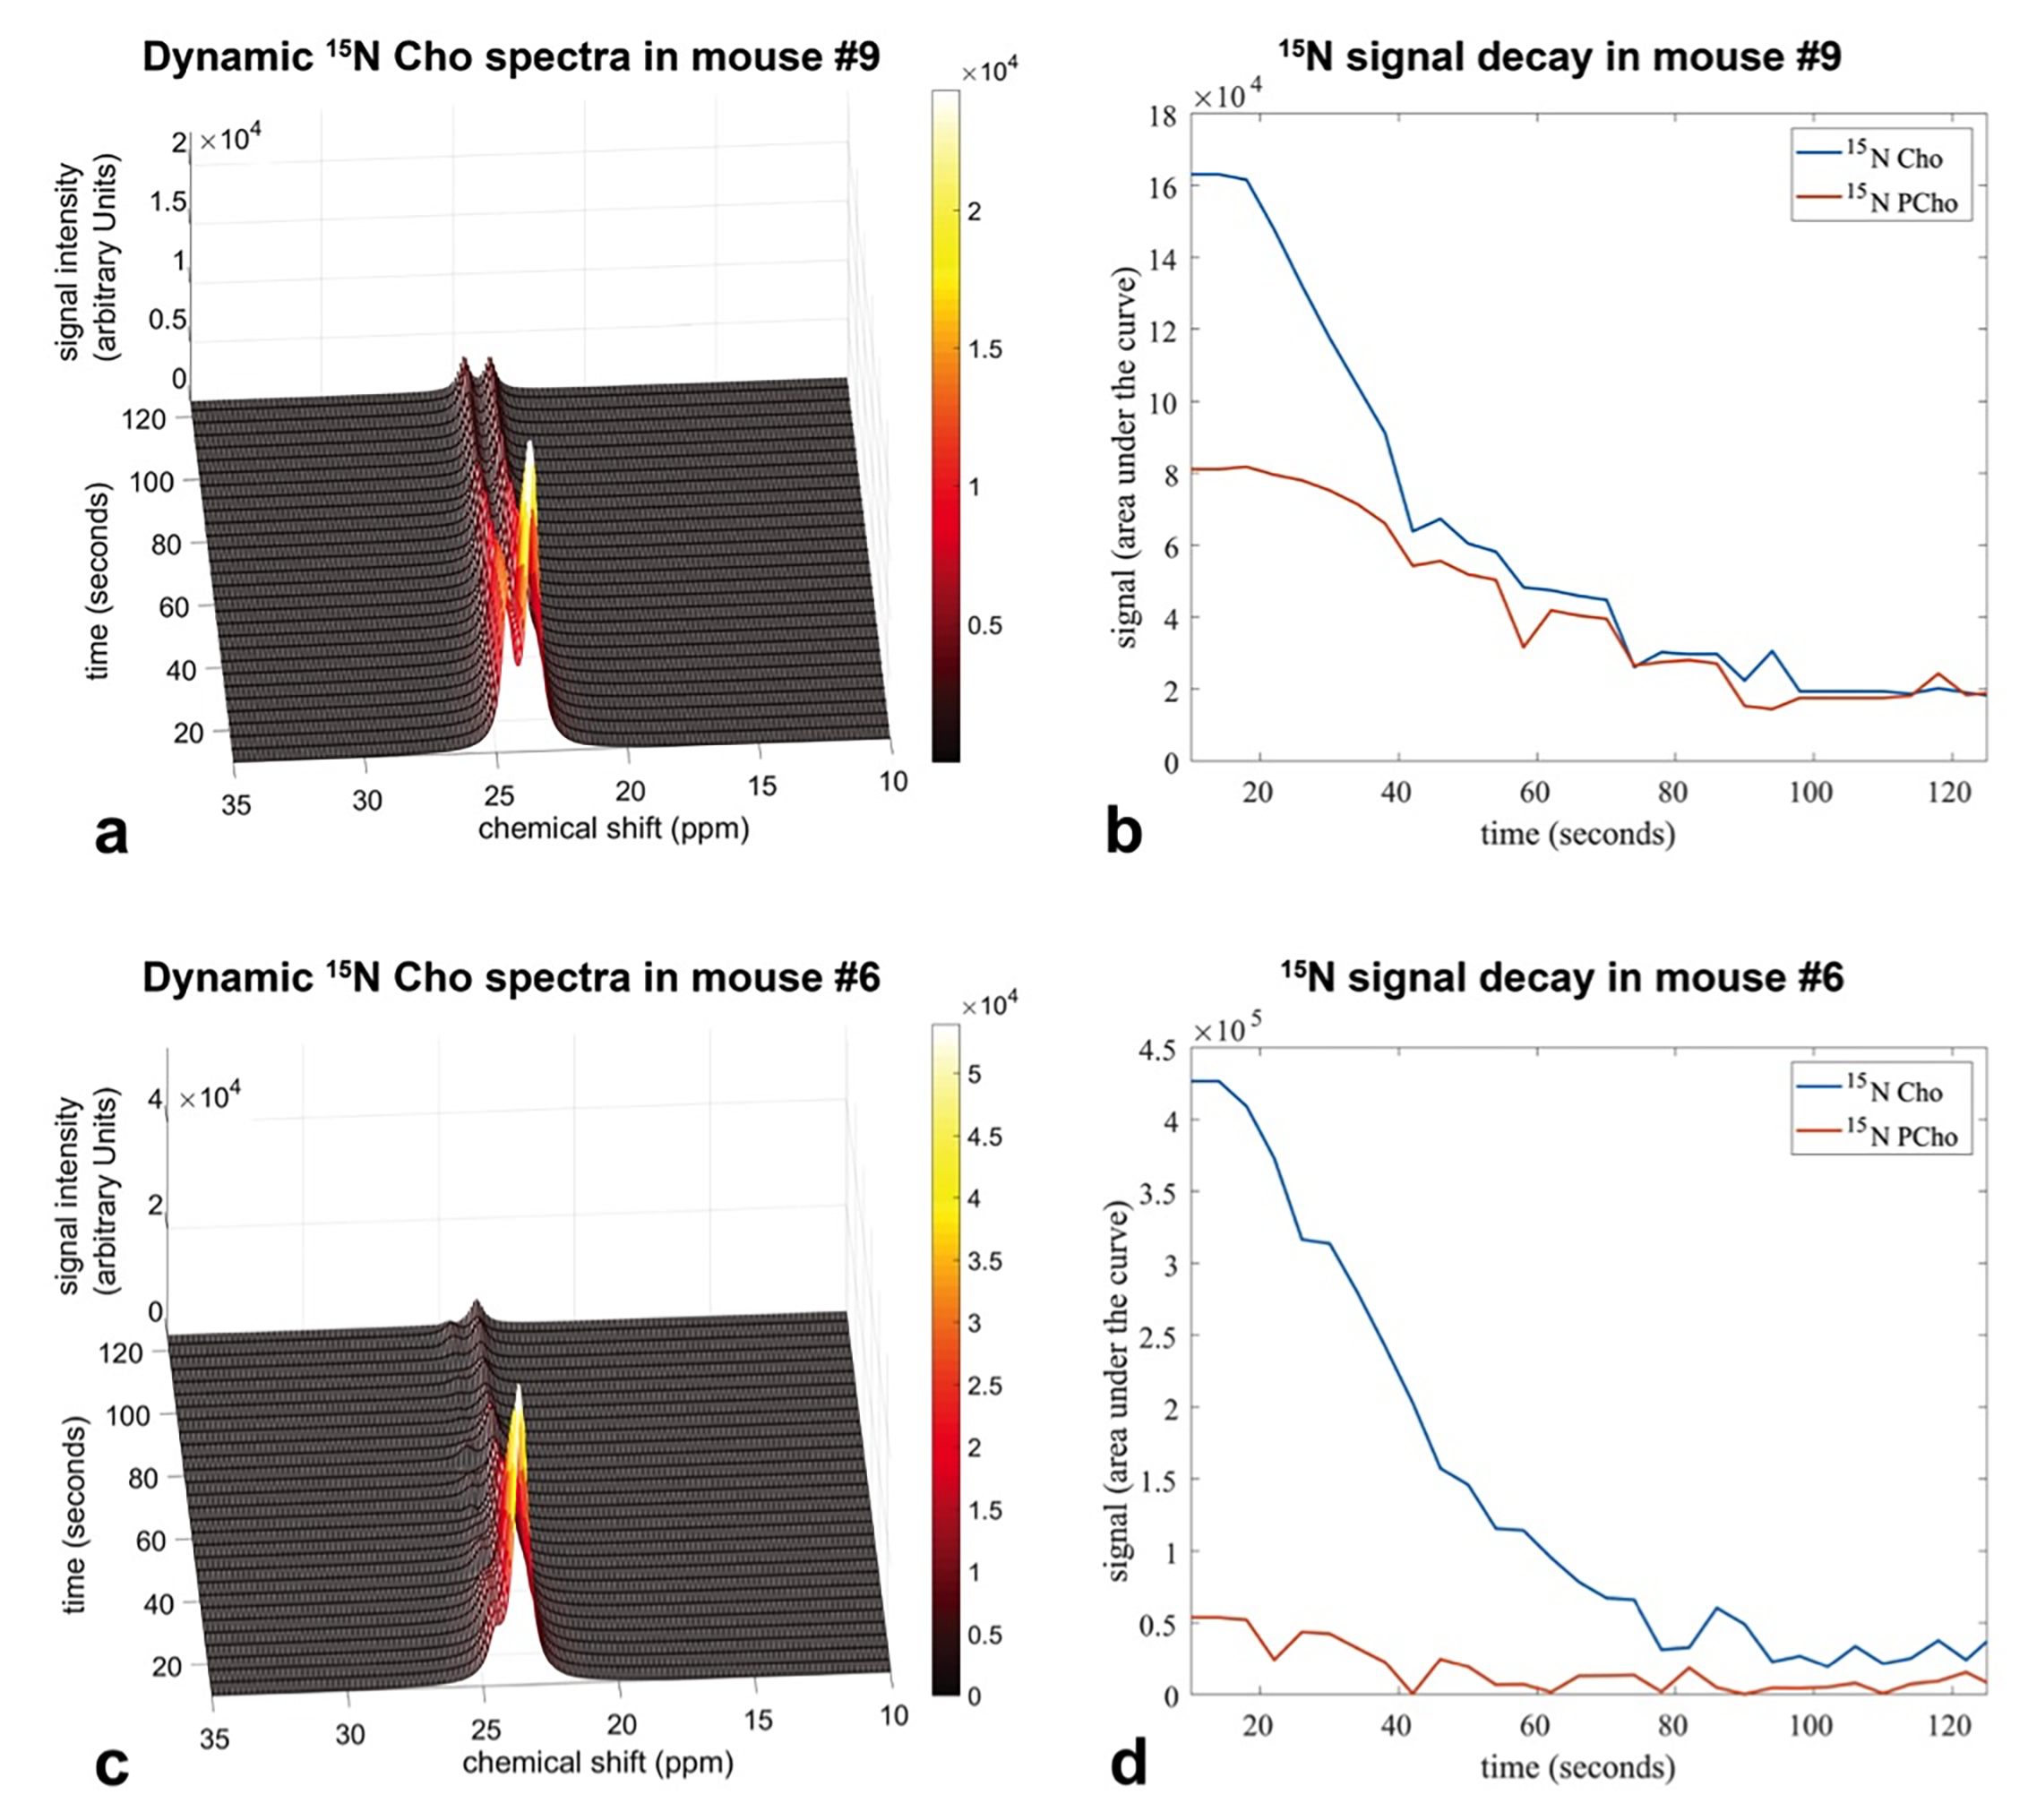
Figure-3: Dynamic hyperpolarized 15N-Cho spectra quantification after Cho and PCho peaks deconvolution in NSG mice implanted with PC-3 tumor cells. (a) Dynamic 15N-spectra acquired in mouse #9 (b) Temporal signal decay of Cho and PCho in mouse #9. (c) Dynamic 15N-spectra acquired in mouse #6. (d) Temporal signal decay of Cho and PCho in mouse #6. All spectra were acquired every 4 seconds from 10 to 126 seconds after hyperpolarized 15N-Cho tail vein injection.
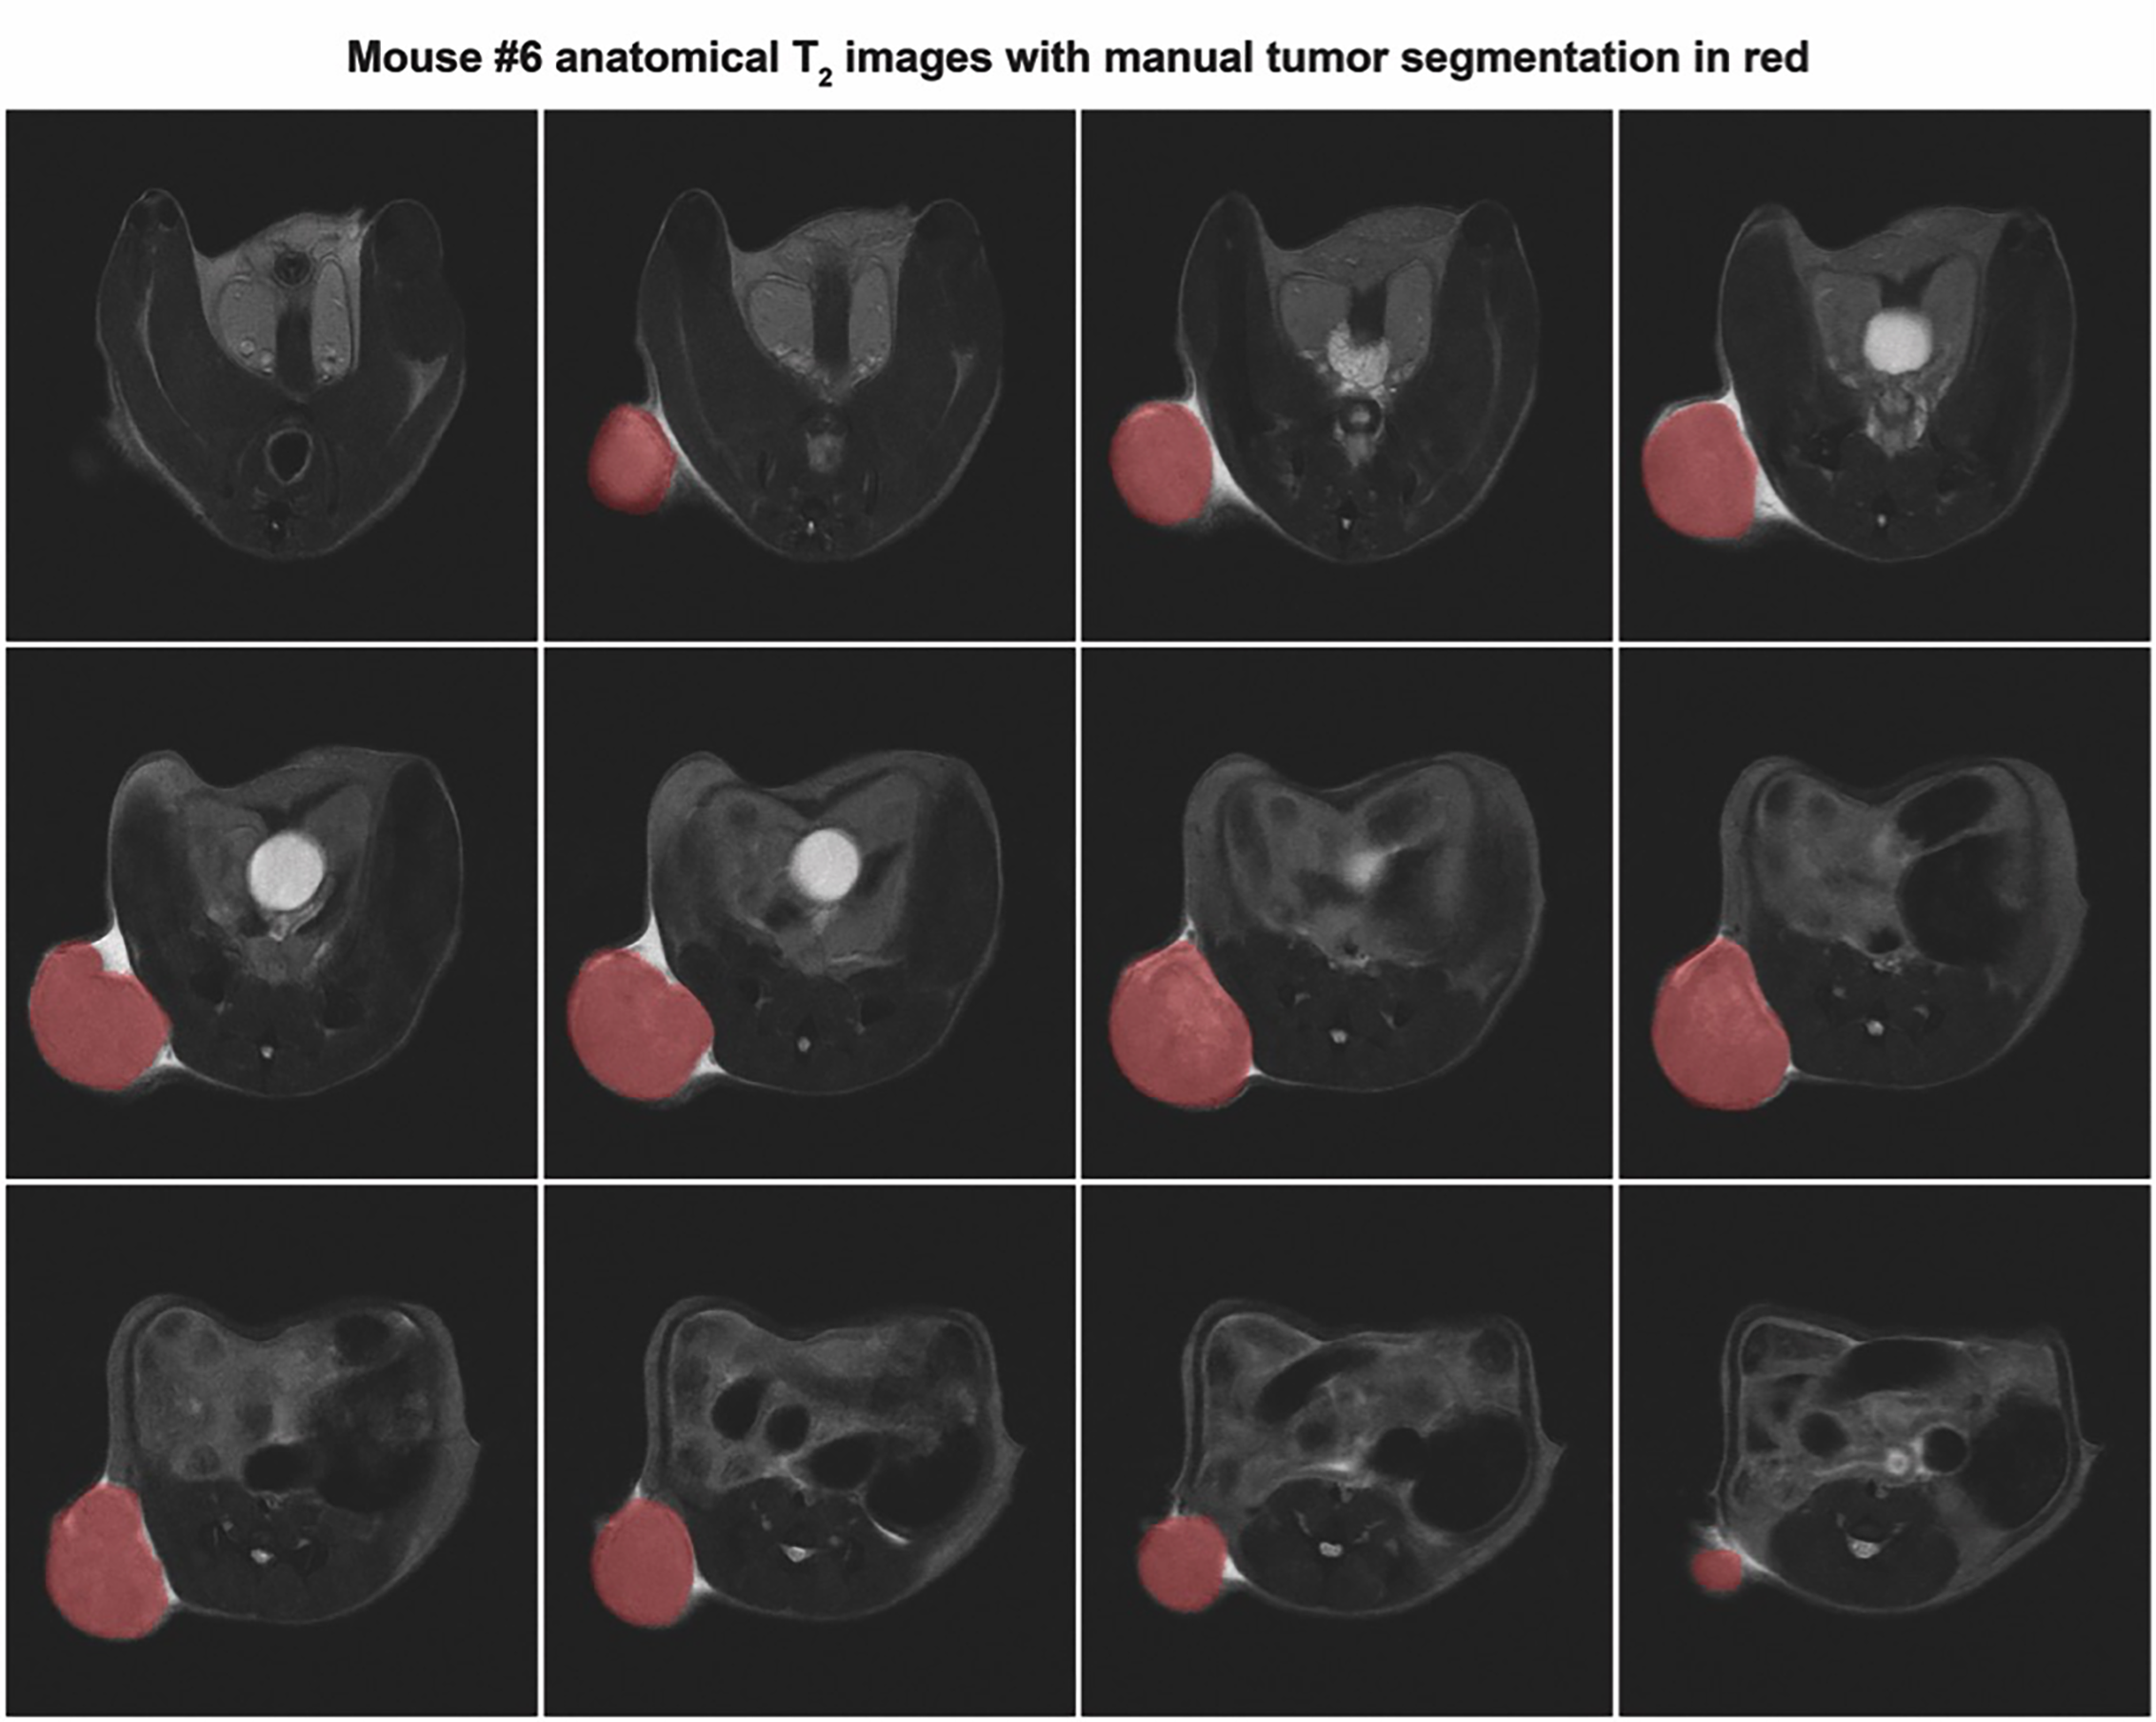
Figure-4: Representative axial T2 weighted slices of implanted PC-3 tumor in mouse #6 used to measure tumor volume using a 35mm 1H quadrature birdcage coil (Doty Scientific). Images where acquired using a TurboRARE sequence with repetition time/echo time (TR/TE) = 2000 / 37 ms, field of view (FOV) = 30×30 mm2, image size 256×256 and 19 slices of 1.5 mm thickness. The tumor volume of 596±5.36 mm3 was measured by manual segmentation in Matlab.
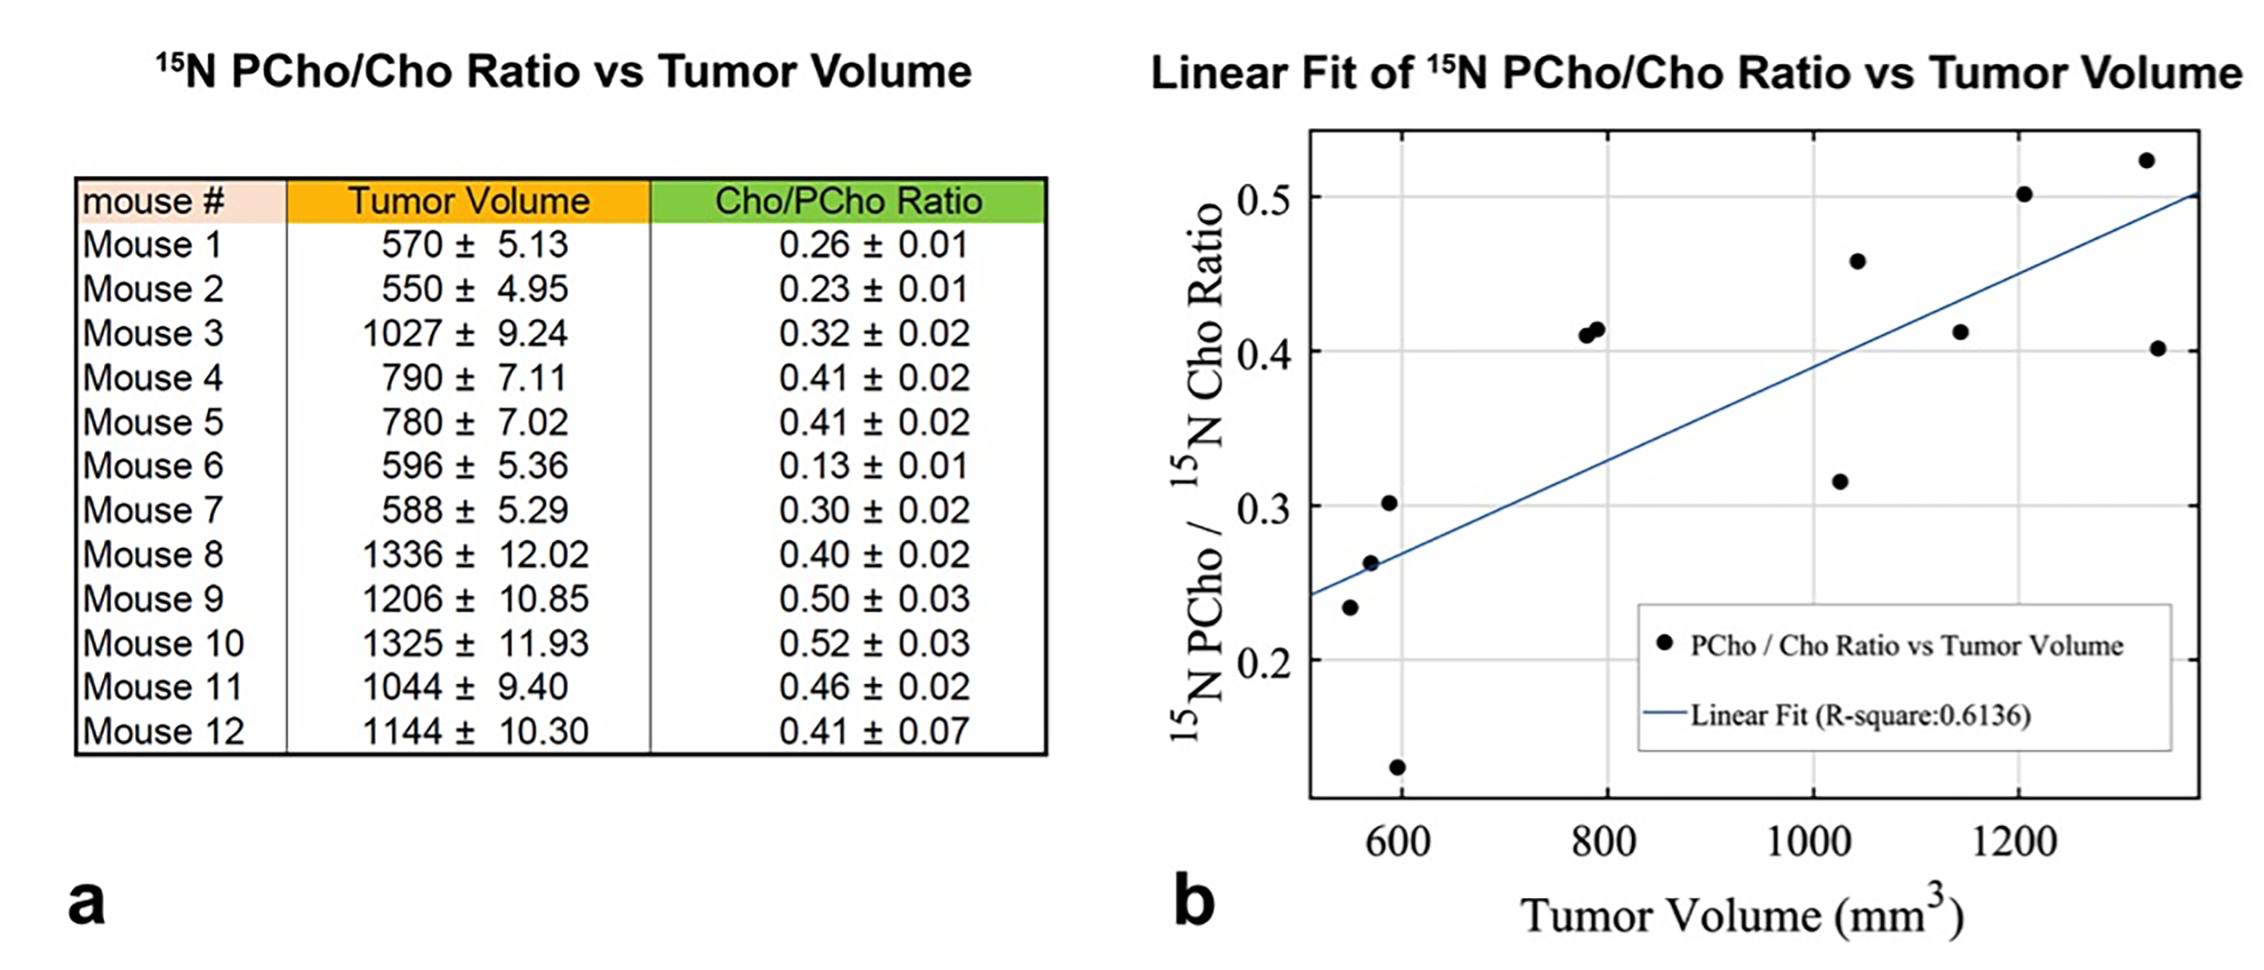
Figure-5: In-vivo hyperpolarized 15N Cho/PCho ratio and correlation with tumor volume in mice implanted with PC-3 tumor cells. (a) Table showing the measured tumor volumes for all mice and the hyperpolarized 15N Cho/PCho ratio measured as the maximum area under the curve of each corresponding peak after deconvolution. (b) Linear correlation fit of in-vivo hyperpolarized 15N Cho/PCho ratio versus tumor volume. A moderate positive linear correlation was found with R2=0.6136 with a slope of 0.0003 with 95% confidence.