4325
Estimating T2 relaxation rates of Lactate with Hyperpolarized C13 MRI using bSSFP and Pharmacokinetic Modelling1Radiology, University of California, San Francisco, San Francisco, CA, United States, 2UC Berkeley - UCSF Graduate Program in Bioengineering, Berkeley, CA, United States, 3Biomedical Informatics, University of Colorado School of Medicine, Aurora, CO, United States, 4HeartVista, Los Altos, CA, United States
Synopsis
Keywords: Hyperpolarized MR (Non-Gas), Modelling, Kidney, Tumor
Lactate T2 values were fit in vivo for animal and human hyperpolarized carbon-13 pyruvate MR datasets. A pharmacokinetic model was used to leverage T2 weighting of a bSSFP acquisition. For healthy rat kidneys lactate T2 values were 0.929 ± 0.111s, for TRAMP tumor 1.663 ± 0.485s, for human RCC tumor 1.119 ± 0.168s and for human RCC normal-appearing region 1.089 ± 0.375s. Lactate T2 maps showed heterogeneity across the kidney of RCC patients but median T2 values were consistent across patients. This work demonstrates a method of using bSSFP hyperpolarized data to fit T2 values.Introduction
Spin-spin (T2) relaxation rates for hyperpolarized [1-13C]pyruvate (HP C13) MRI metabolites are typically unknown and difficult to measure in vivo, especially for low concentration downstream metabolic products. However, knowledge of T2 values is important for metabolism quantification – for example, when estimating kinetic rate constants (e.g. kPL) values – and may reveal differences in tissue structure as well as the microenvironment of the 13C-metabolites1.Previous attempts have been made to measure T2 in vivo for HP C13 data using methods analogous to MR fingerprinting, multi-echo sequences or fitting signals to a bi-exponential model2–5. In this work, we use a pharmacokinetic model to fit 13C-lactate T2, generated from metabolic conversion following injection of 13C-pyruvate.
Recent work has shown that acquiring HP C13 using a balanced steady state free precession (bSSFP) sequence increases SNR by 2.5-fold6. T2 information is also encoded by this sequence due to the continual refocusing of the magnetization. To measure this, a novel pharmacokinetic model was developed for estimating kPL as a function of T2. We can take advantage of this model, not only to estimate kPL, but also to fit T2.
In this work, we estimate T2 values of lactate for in vivo animal and human datasets using a pharmacokinetic model by leveraging the T2/T1 contrast of bSSFP sequences, with reference data from GRE experiments.
Methods
Previously acquired HP C13 animal and human datasets were used for validation (each N=3)6: healthy rat kidneys, transgenic adenocarcinoma of the mouse prostate (TRAMP) and human renal cell carcinoma (RCC) kidney data. These datasets had two scans from the same day: one where pyruvate and lactate were acquired with a gradient echo (GRE) sequence (“GRE-all”) and another where lactate was acquired with a bSSFP sequence while pyruvate acquisition still used GRE (“lactate-bSSFP”). For each dataset, the GRE-all data was used to fit kPL using a GRE pharmacokinetic model that does not depend on T27. This kPL value, along with fixed values for T1 (pyruvate T1=20s, lactate T1=30s) were used in the bSSFP pharmacokinetic model8 to estimate T2 from the lactate-bSSFP data (Figure 1).Average dynamics from regions of interest were used to fit a single lactate T2 value. This process was extended to fit a lactate T2 per voxel to generate T2 maps for each dataset. Fit error was quantified with a lactate normalized root-mean-square error.
Results
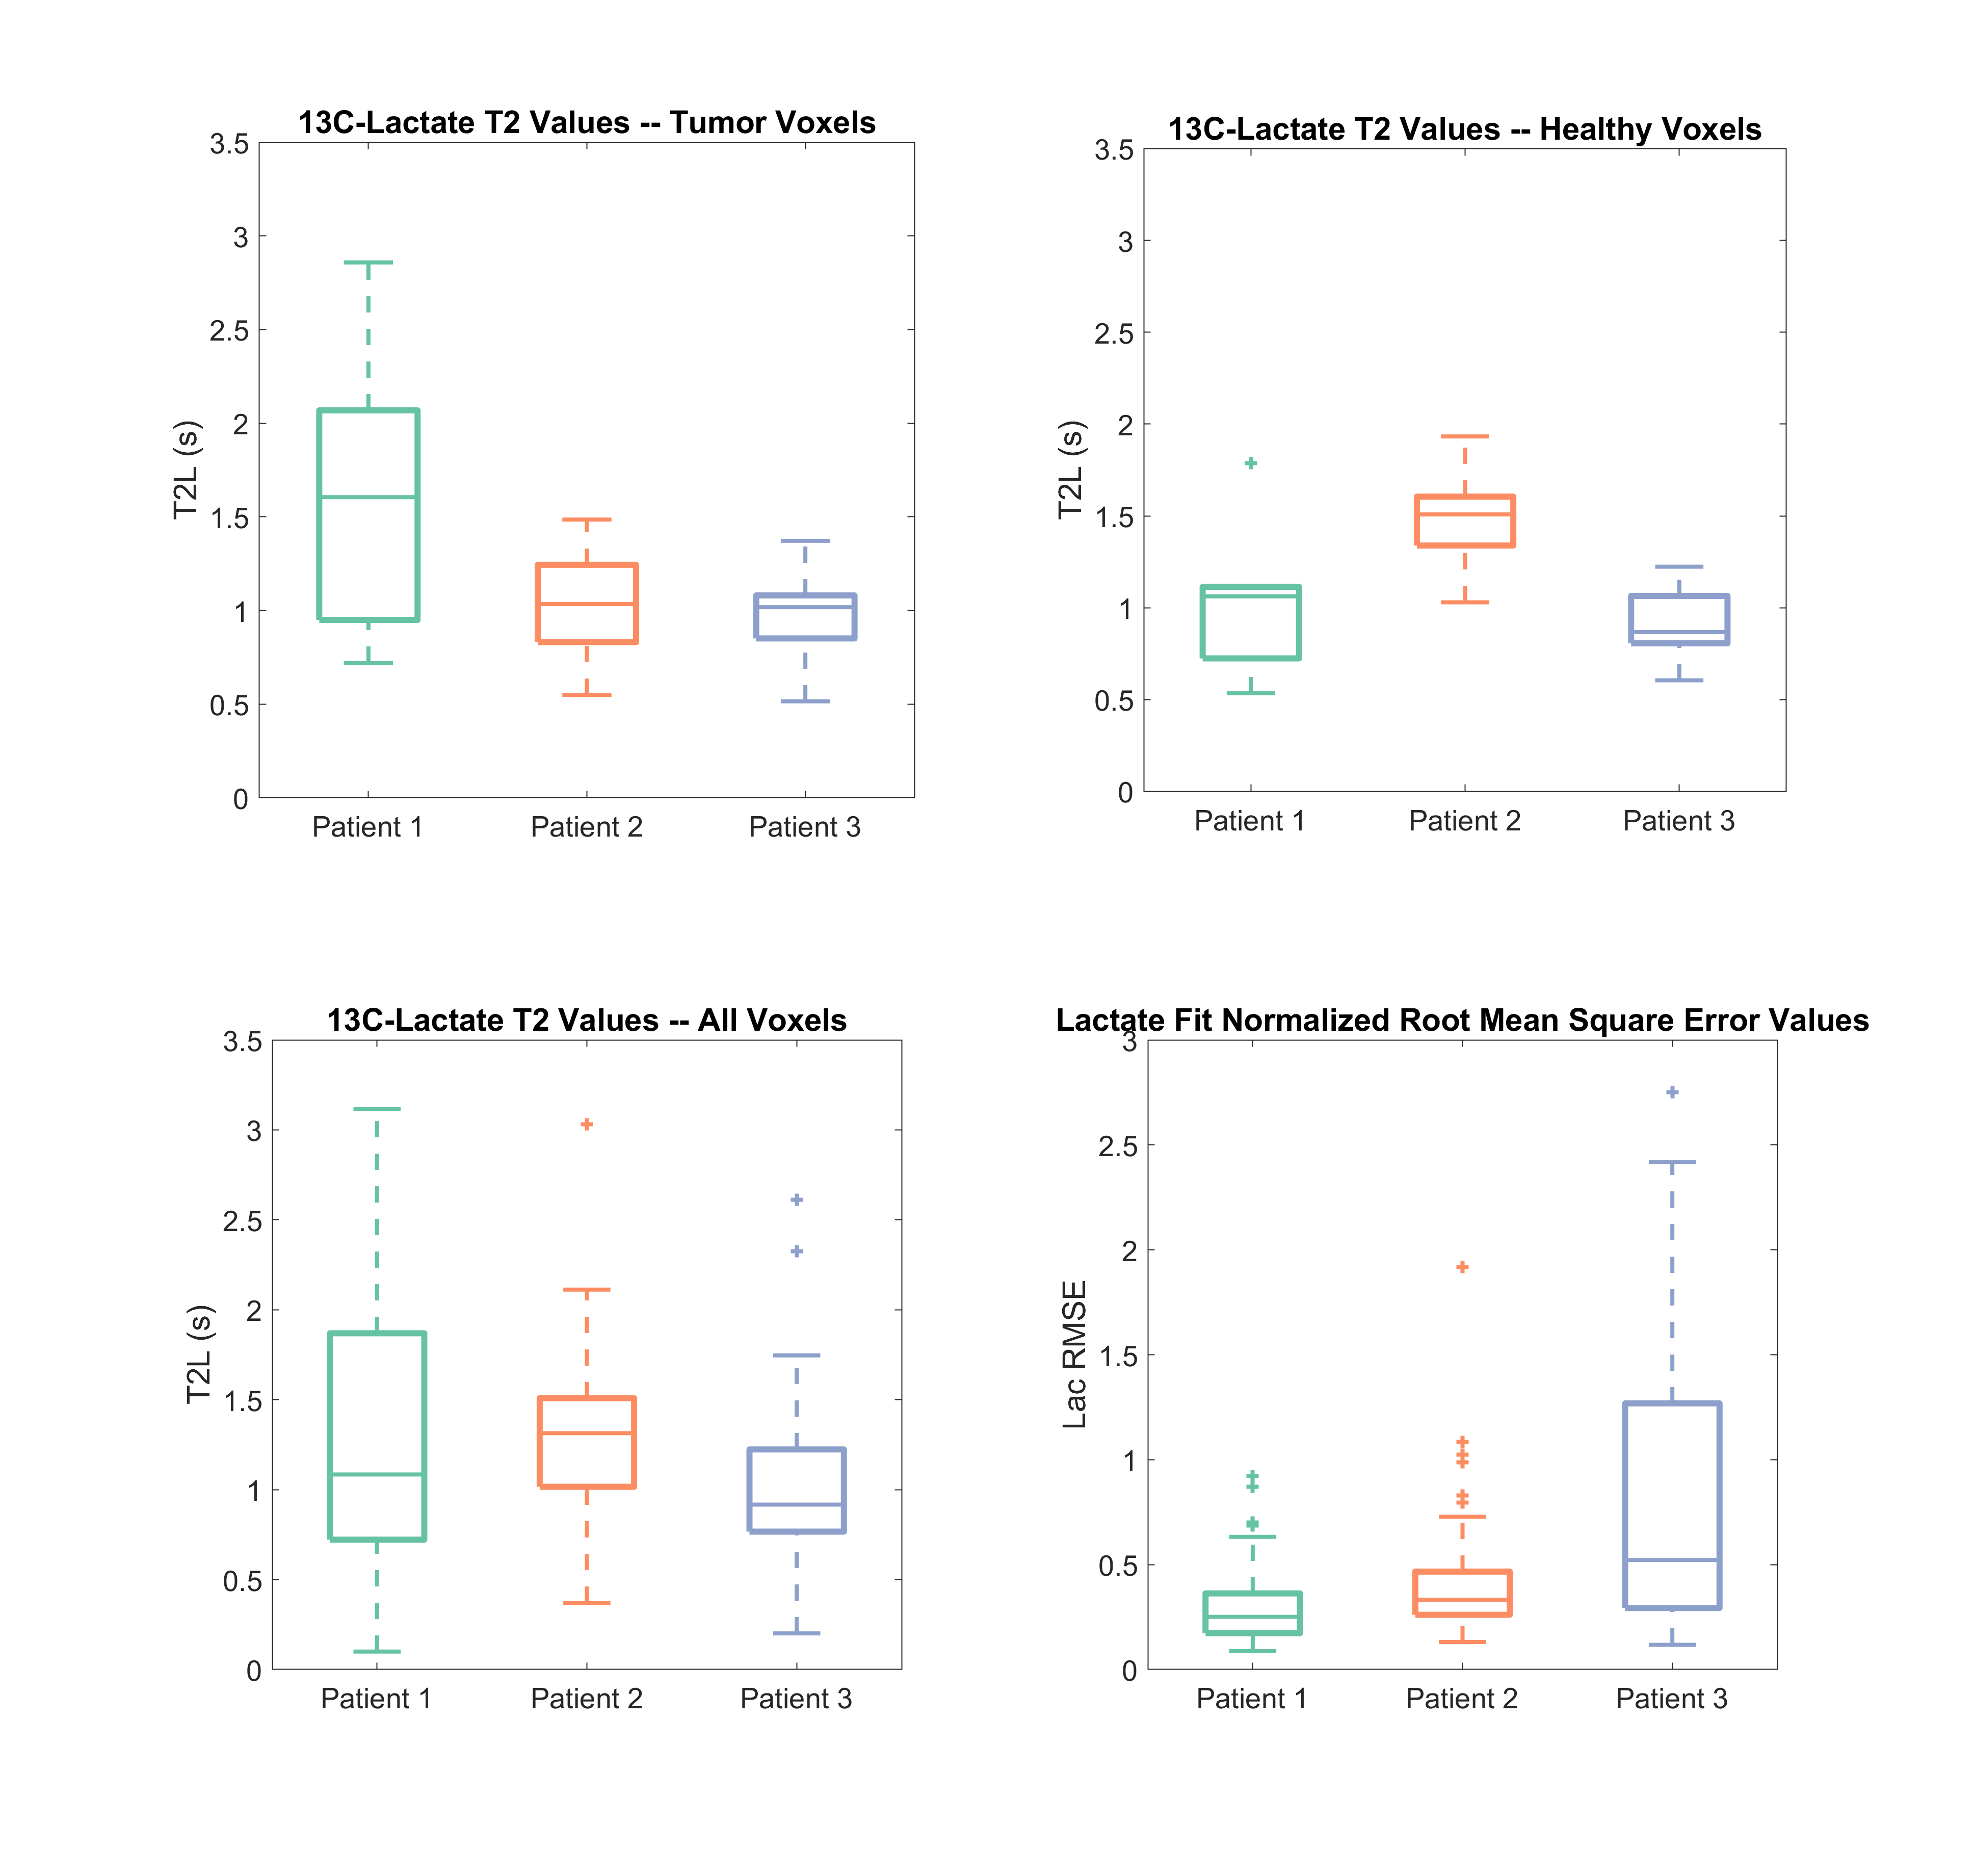
For healthy rat kidneys lactate T2 values were 0.929 ± 0.111s, for TRAMP prostate tumors 1.663 ± 0.485s, for human RCC tumor 1.119 ± 0.168s and for human RCC normal-appearing region 1.089 ± 0.375s (Figure 2). All average dynamic models fit had a lactate normalized root-mean-square error less than 0.19.Lactate T2 maps showed heterogeneity across the kidney for the RCC patients (Figures 4 & 5). Patient 1 showed the most heterogeneity with T2 values ranging from 0.1 to 3.1 seconds (Figure 3). There were also some variations across T2 values of the tumor versus the normal-appearing region, although there was not a consistent pattern across the patients. Median T2 values were consistent across the patients’ kidneys, about 1-1.5s. The root-mean-square error of the lactate estimate had a larger range for patient 3 (Figure 3).
Discussion
The lactate T2 values were as expected and similar to previous results in a rat hepatocellular carcinoma model using a CPMG sequence to measure T25.The differences in T2 values across the three renal cell carcinoma patients can be attributed to different tumor pathologies. For example, patient 1 has more heterogeneity in tumor T2 values which may be due to the heterogeneity of the tumor, like the present necrosis as seen in the proton images. Histological results of surgical resections of the tumors show that patient 1 is a chromophobe subtype, patient 2 is a Fuhrman grade 2 clear cell and patient 3 is a Fuhrman grade 4 clear cell. The higher grade of patient 3 may be leading to increased errors in fit lactate (Figure 5) because of the higher kPL values that are expected with a higher grade.
One challenge of this model-based method is the fitting model’s accuracy in differentiating relaxation effects from metabolic conversion effects. This was addressed in this work by using the accompanying GRE dataset to fit kPL when estimating T2. However, there may still be error in the metabolic conversion rate constants resulting in propagation of error into the T2 estimation. Additionally, this work is limited in sample size and, therefore, it is difficult to make conclusions about pathology or tumor grade based on the lactate T2 of tumor voxels.
Conclusion
The estimated T2 values may give insight into the range and heterogeneity of lactate T2 values with in vivo hyperpolarized C13 datasets. This work provides a method to measure T2 values of downstream metabolic products based on the T2 encoding in bSSFP integrated with a pharmacokinetic model.Based on this work, the bSSFP fitting model can also be used to jointly fit rate constants (kPL) along with T2. A more robust exploration of lactate T2 values should be completed in the future with a larger sample size.
Acknowledgements
This work was supported by NIH Grants P41EB013598, R21DK130002, R01CA249909 and American Cancer Society Grant RSG-18-005-01-CCE.References
1. Bottomley, P. A., Hardy, C. J., Argersinger, R. E. & Allen-Moore, G. A review of 1H nuclear magnetic resonance relaxation in pathology: Are T1 and T2 diagnostic? Med. Phys. 14, 1–37 (1987).
2. Milshteyn, E. et al. Simultaneous T1 and T2 Mapping of Hyperpolarized 13C Compounds using the bSSFP Sequence. J. Magn. Reson. San Diego Calif 1997 312, 106691 (2020).
3. Reed, G. D. et al. High Resolution 13C MRI With Hyperpolarized Urea: In Vivo T2 Mapping and 15N Labeling Effects. IEEE Trans. Med. Imaging 33, 362–371 (2014).
4. Ma, J. et al. Cardiac measurement of hyperpolarized 13C metabolites using metabolite-selective multi-echo spiral imaging. Magn. Reson. Med. 86, 1494–1504 (2021).
5. Yen, Y. F. et al. T2 relaxation times of 13C metabolites in a rat hepatocellular carcinoma model measured in vivo using 13C-MRS of hyperpolarized [1-13C]pyruvate. NMR Biomed. 23, 414–423 (2010).
6. Tang, S. et al. A metabolite‐specific 3D stack‐of‐spiral bSSFP sequence for improved lactate imaging in hyperpolarized [1‐ 13 C]pyruvate studies on a 3T clinical scanner. Magn. Reson. Med. 84, 1113–1125 (2020).
7. Larson, P. E. Z. et al. Investigation of analysis methods for hyperpolarized 13C-pyruvate metabolic MRI in prostate cancer patients. NMR Biomed. 31, 1–17 (2018).
8. Sahin, S., Tang, S., Vaidya, M. & Larson, P. Fitting Kinetic Rate Constants in Metabolite-Specific bSSFP Hyperpolarized [1-13C]Pyruvate MRI. in International Society of Magnetic Resonance in Medicine Virtual Meeting (2021).
Figures