4323
Co-Hyperpolarized [13C,15N2]urea + [1-13C]pyruvate for Perfusion and Metabolic Imaging of the Abdomen in Healthy Volunteers1Department of Radiology and Biomedical Imaging, University of California, San Francisco, CA, United States, 2Mallinckrodt Institute of Radiology, Washington University, St. Louis, MO, United States, 3Department of Neurological Surgery, University of California, San Francisco, CA, United States
Synopsis
Keywords: Hyperpolarized MR (Non-Gas), Perfusion
[13C,15N2]urea and [1-13C]pyruvate were polarized together using dynamic nuclear polarization and simultaneously injected into healthy volunteers for simultaneous imaging of metabolism and perfusion in the abdomen. Whole-abdomen images were successfully obtained and the distribution of urea was compared to pyruvate and its metabolites. While the relative intensity in various organs were similar between urea and pyruvate, the temporal courses were different. This represents the first use of co-polarized pyruvate and urea in the human abdomen, and will be a powerful potential tool for simultaneous imaging of perfusion and metabolism in tumors and metabolic diseases.Introduction
Hyperpolarized (HP) [1-13C]pyruvate is the most widely used molecular contrast agent for 13C MRI to characterize abnormal metabolism in patients with tumors, diseases or inflammation based on the elevated glycolytic metabolism of [1-13C]pyruvate-to-[1-13C]lactate conversion in these cases1. An accurate quantification of [13C]pyruvate for assessing organ metabolism, however, is challenging because it is difficult to separate the pyruvate signal from organ metabolism from organ perfusion. A non-metabolized HP 13C-urea can be co-injected to provide simultaneous information on vascular perfusion of tissues2. The first hyperpolarized 13C-MRI human study with injection of co-polarized [1-13C]pyruvate and [13C,15N2]urea was recently demonstrated for prostate imaging3. In this work, we applied the new method of co-polarized [13C,15N2]urea and [1-13C]pyruvate MRI for dynamic imaging of the human abdomen to obtain preliminary estimates of HP [1-13C]pyruvate metabolism and [13C,15N2]urea perfusion in abdominal organs of healthy volunteers.Methods
HP 13C data were acquired from four healthy volunteers (5 scans) on a clinical 3T scanner (MR750; GE Healthcare, Milwaukee, WI) using a volumetric transmitter and an eight-channel flexible receiver array (QTAR, Clinical MR Solutions, Brookfield, WI) that covered the whole abdomen with commercial customizable acquisition software (RTHawk, HeartVista, Inc., Los Altos, CA). [13C,15N2]urea and [1-13C]pyruvate were polarized for 3 hours in a 5T GE SPINlab at 0.8 K and co-injected at a concentration of approximately 35 and 150 mM, respectively. Data were acquired using a combination of 3D stack-of-spiral balanced steady-state free precession sequence for urea and a metabolite-specific gradient echo sequence for pyruvate and its metabolic products3. Scan parameters include FOV = 90 cm, spatial resolution = 2 x 2 x 2 cm3, slices = 10/16 for pyruvate/urea, timeframes = 20, and temporal resolution = 3 sec. Nominal flip angles of 20°/30°/30°/50° were utilized to excite pyruvate/lactate/alanine/urea. T1-weighted spoiled gradient echo was obtained for anatomic registration of 13C data. 13C data were denoised using a patch-based higher-order singular value decomposition (HOSVD) method4.Results
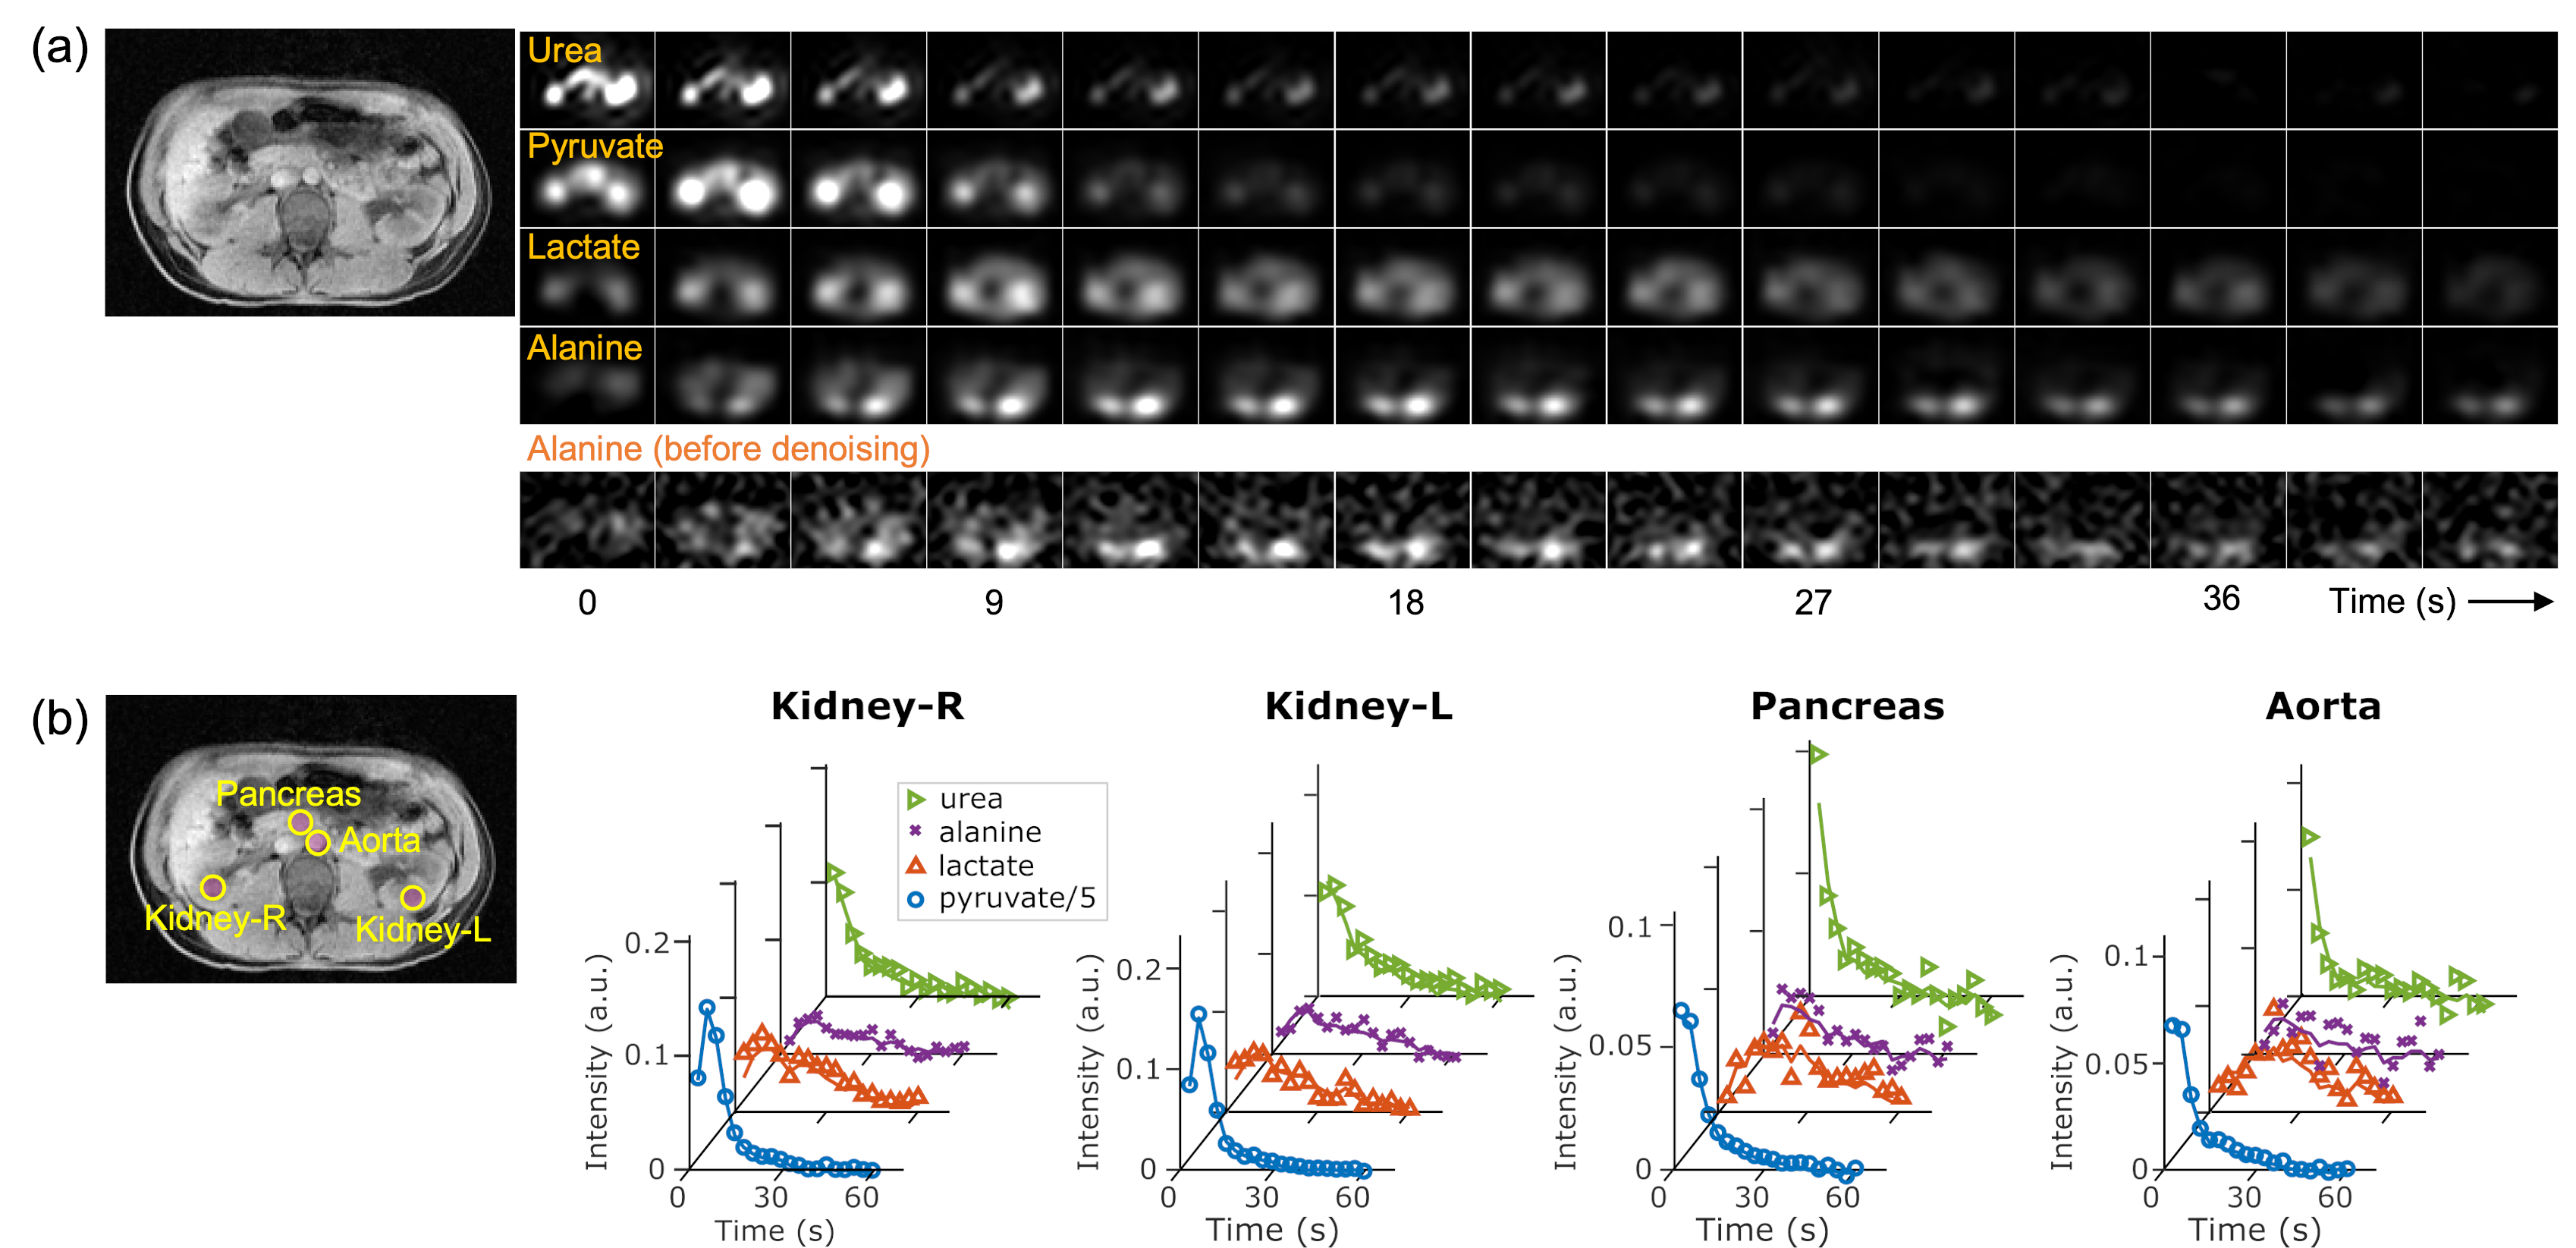
After denoising, dynamic multi-slice imaging was obtained for urea, pyruvate, lactate and alanine over the duration of the acquisition (Fig 1a). The effects of denoising was particularly important for low SNR compounds like alanine (Fig 1a, bottom row). Quantification from all five scans after HOSVD denoising showed noise decreased by a factor of 18 ± 1 (urea), 8 ± 1 (pyruvate), and 15 ± 1 (lactate and alanine).To characterize signal dynamics in different organs and vessels, ROIs were drawn on right and left kidneys, pancreas, and aorta (Fig 1b). The peak times of HP signals were different by species and ROIs. In the kidneys, peak pyruvate signal appeared earlier than that in the pancreas and aorta while peak lactate and alanine appeared later than pyruvate. Peak urea signal was observed at the first timeframe. From four datasets (excluding one acquired too late to observe peak metabolites), the time-to-peak of pyruvate in the spleen and the liver were 0.75 ± 2.4 s and 4.5 ± 3.1 s, respectively, compared to the peak time of the kidneys. Peak pyruvate in the pancreas and aorta appeared earlier than in kidneys. By contrast, urea had already reached its peak at the first time point. This mismatch between the urea and pyruvate peak times demonstrates different temporal characteristics of the two HP probes.
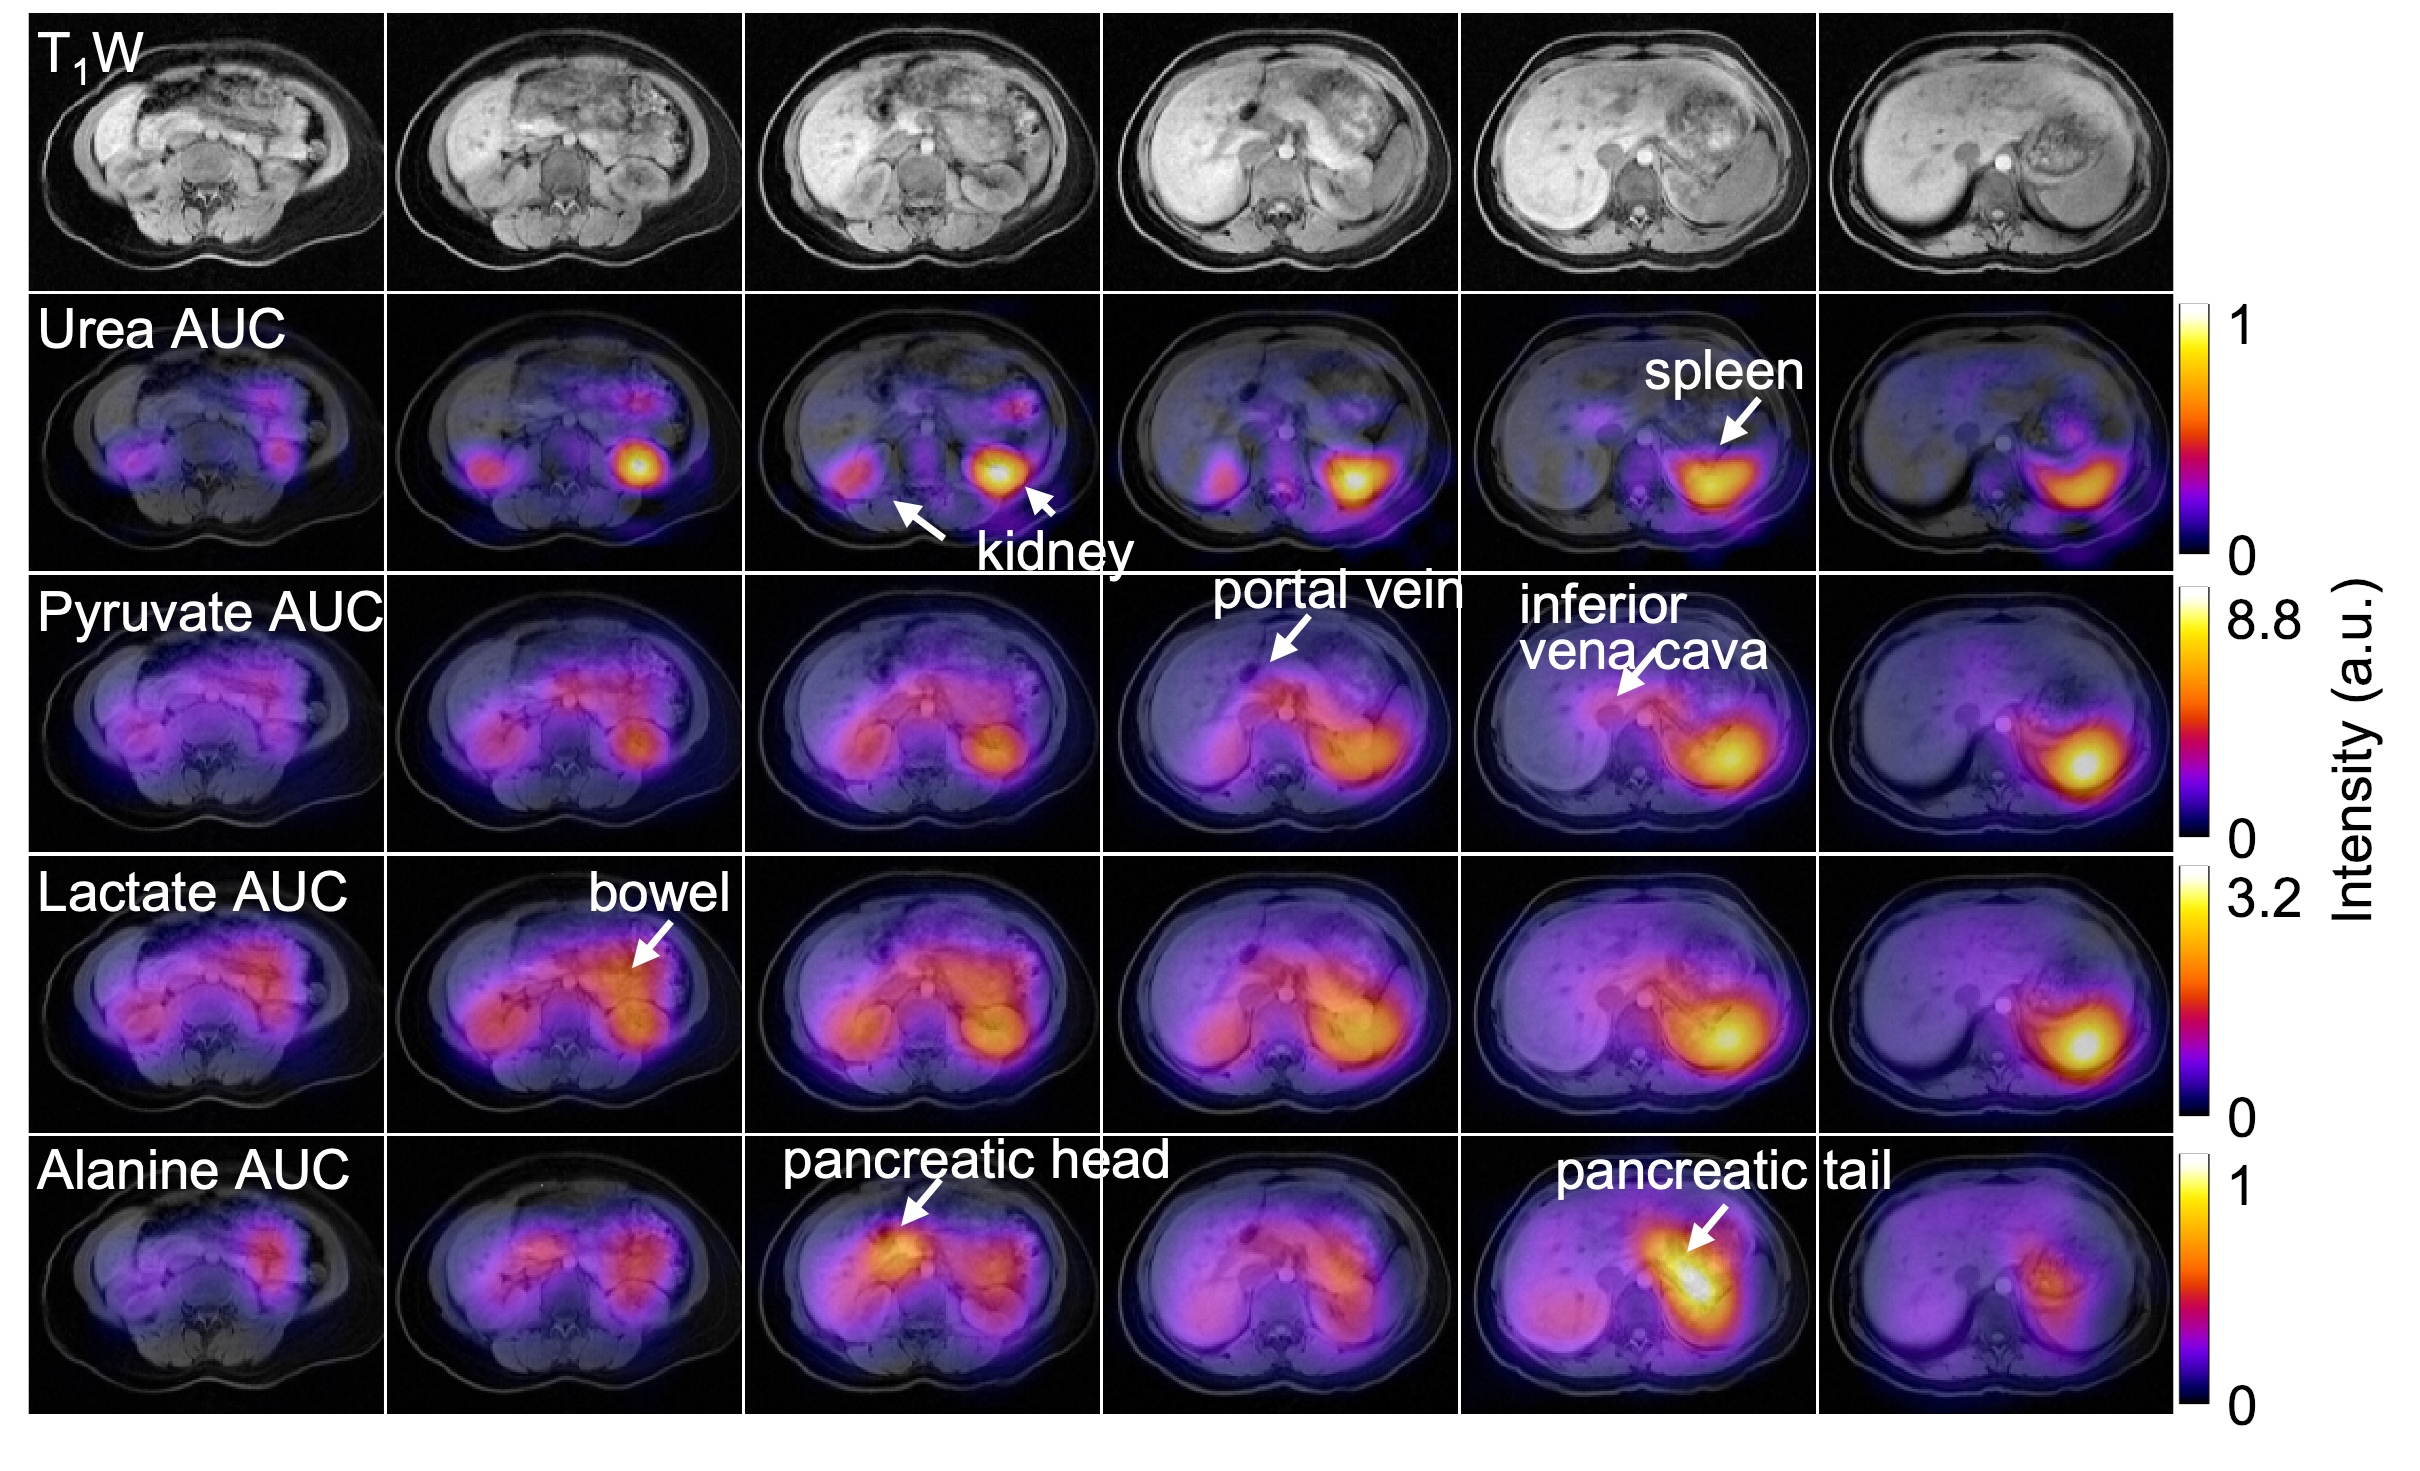
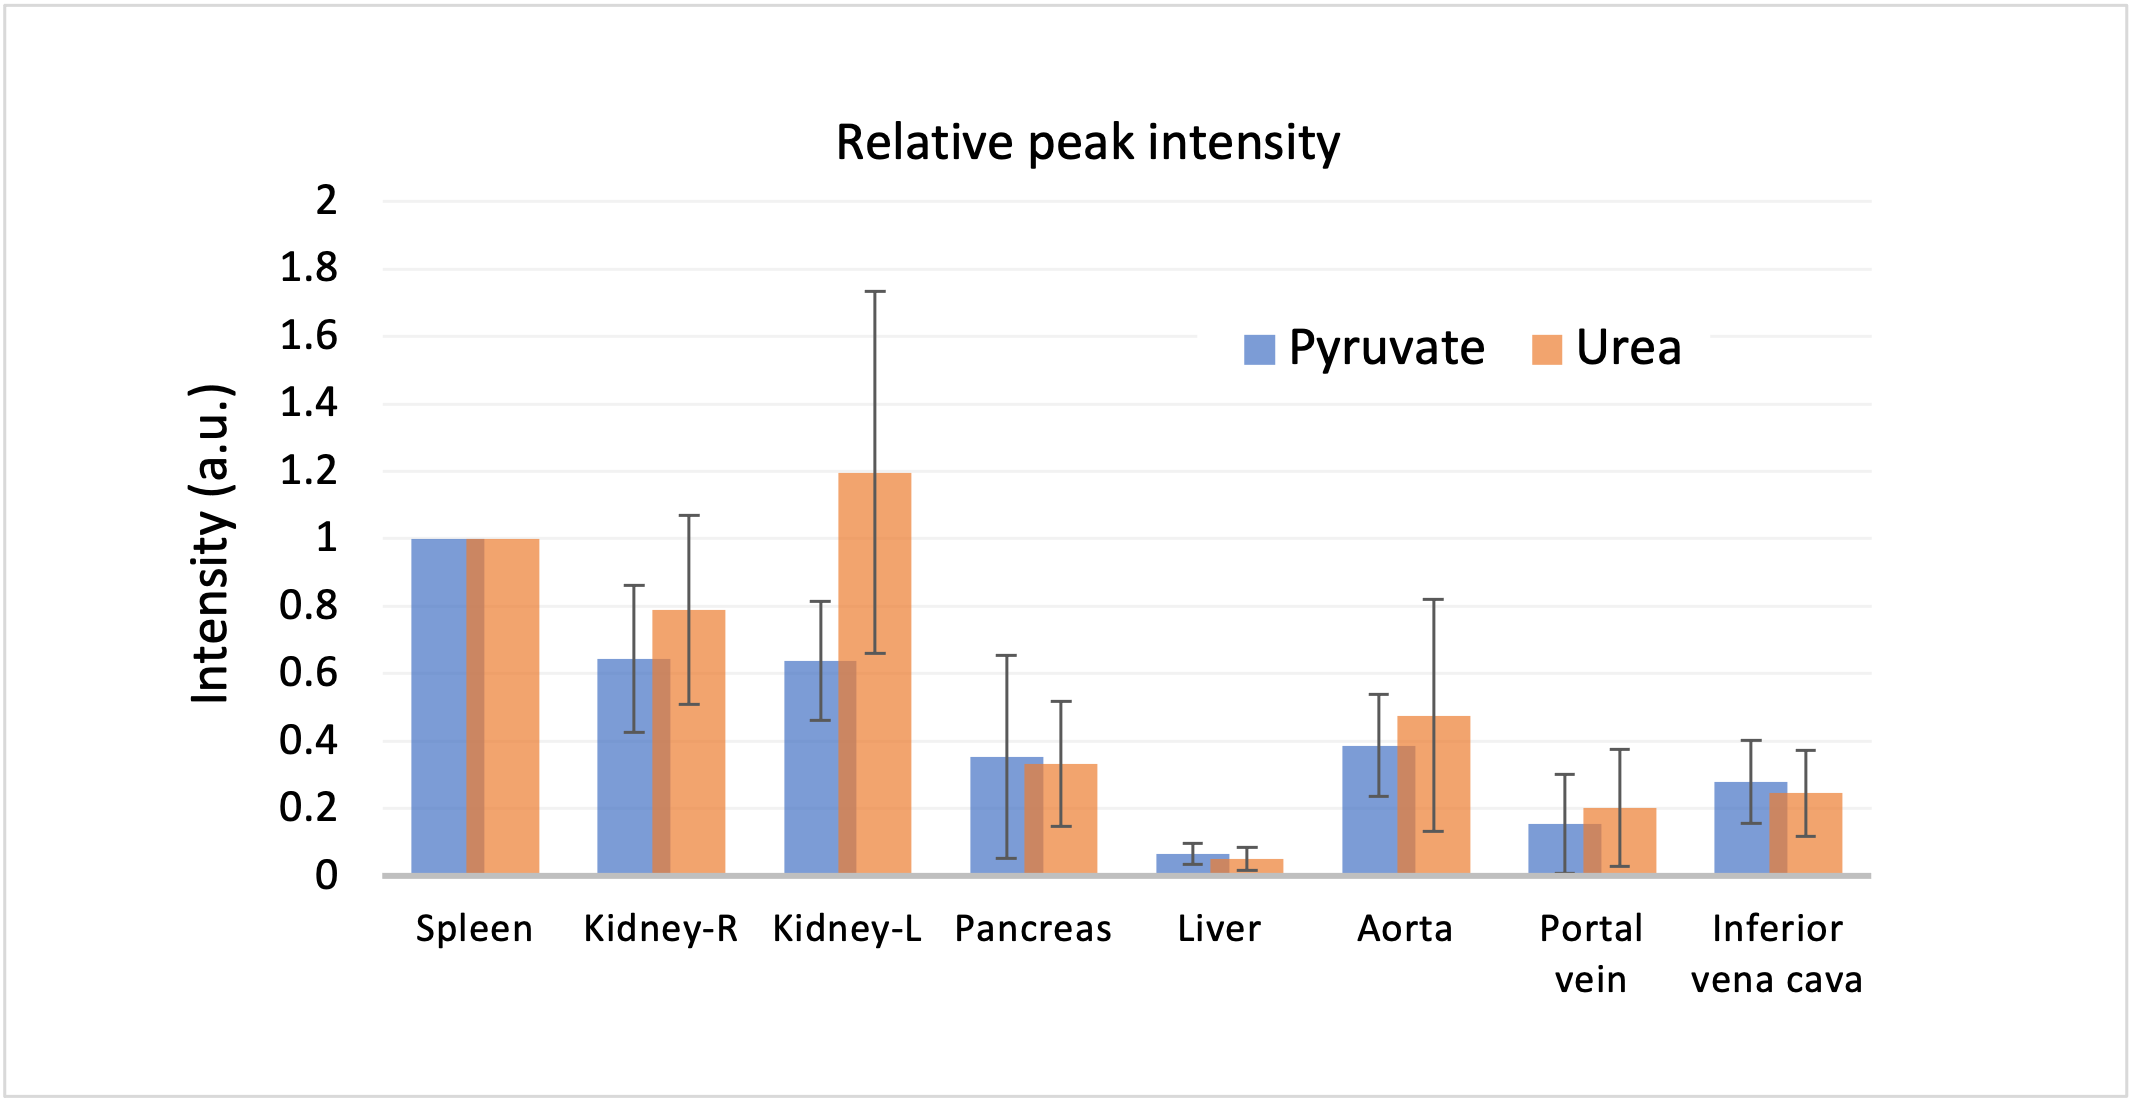
Figure 2 represents the area-under-curve (AUC) maps of urea, pyruvate, lactate, and alanine from 6 different slices, showing the capability to perform a robust measurements of whole-abdomen pyruvate metabolism and urea perfusion at the same time. High pyruvate and lactate signals were obtained in the spleen and the kidney compared to liver as previously observed5. Alanine intensity was highest in pancreas. Moreover, HP signals were observed in the bowel, indicating the perfusion and pyruvate metabolic pathways into the GI tract. Over the entire abdomen, relative signal distribution of urea matched pyruvate, implying similar perfusion characteristics between the two HP agents. Average peak intensities of pyruvate and urea signals (n= 5) from different ROIs (normalized to spleen) showed no significant difference between the two agents (Fig 3). Asymmetric signal between kidneys likely reflected partial volume with spleen in neighboring slices. Overall, this result supports the similar signal distributions of pyruvate and lactate in different organs and vessels in healthy abdominal organs.
Discussion and Conclusion
In this work, we showed, for the first time, simultaneous acquisition of HP [13C,15N2]urea and HP [1-13C]pyruvate and its metabolites in human abdomen. Despite using a lower pyruvate concentration (~150 mM) compared to pyruvate-only experiments (~220 mM), the signal intensities of pyruvate and its metabolites were sufficient for a robust metabolic imaging. Although the signal distributions of pyruvate and urea were similar, the time-to-peak of urea was earlier than that of pyruvate in the kidneys and spleen. These effects may reflect a combination of differences in permeability and metabolism of the two agents. Further studies will be necessary to investigate these distinct temporal characteristics with considerations of using different acquisition sequences and different T1 relaxation rates of pyruvate and urea, which would help enable to develop a method to correct for perfusion based on urea data for more accurate quantification of pyruvate metabolism.Acknowledgements
This work was supported by NIH grants R01DK115987 and P41EB013598.References
1. Kurhanewicz J, Vigneron DB, Brindle K, et al. Analysis of Cancer Metabolism by Imaging Hyperpolarized Nuclei: Prospects for Translation to Clinical Research. Neoplasia 2011;13:81–97.
2. Qin H, Tang S, Riselli AM, et al. Clinical translation of hyperpolarized 13C pyruvate and urea MRI for simultaneous metabolic and perfusion imaging. Magnetic Resonance in Med 2022;87:138–149.
3. Liu X, Tang S, Mu C, et al. Development of specialized magnetic resonance acquisition techniques for human hyperpolarized [13C,15N2]urea + [1‐13C]pyruvate simultaneous perfusion and metabolic imaging. Magnetic Resonance in Med 2022;88:1039–1054.
4. Kim Y, Chen H, Autry AW, et al. Denoising of hyperpolarized 13C MR images of the human brain using patch‐based higher‐order singular value decomposition. Magnetic Resonance in Med 2021;86:2497–2511.
5. Lee PM, Chen H, Gordon JW, et al. Whole‐Abdomen Metabolic Imaging of Healthy Volunteers Using Hyperpolarized [1‐13C]pyruvate MRI. Magnetic Resonance Imaging 2022:jmri.28196 doi: 10.1002/jmri.28196.
Figures