4318
MULTI-SHELL DIFFUSION MRI TO INVESTIGATE THE EFFECTS OF HYPERTENSION ON RAT BRAIN
Haley Elizabeth Wiskoski1,2, Loi Do1, Marc Zempare3, Natalie Carey3, Amy Delmendray3, Kimberly Young3, Kimberly Bohne3, Monica Chawla3, Pradyumna Bharadwaj4, Kenneth Mitchell5, Gene Alexander3,4,6, Carol Barnes3,4, and Theodore Trouard1,3,7
1Department of Biomedical Engineering, The University of Arizona, Tucson, AZ, United States, 2James C. Wyant College of Optical Sciences, The University of Arizona, Tucson, AZ, United States, 3Evelyn F. McKnight Brain Institute, The University of Arizona, Tucson, AZ, United States, 4Department of Psychology, Neurology, and Neuroscience, The University of Arizona, Tucson, AZ, United States, 5Health Sciences Center, Tulane University, New Orleans, LA, United States, 6Division of Neural Systems, Memory, and Aging, The University of Arizona, Tucson, AZ, United States, 7Department of Medical Imaging, The University of Arizona, Tucson, AZ, United States
1Department of Biomedical Engineering, The University of Arizona, Tucson, AZ, United States, 2James C. Wyant College of Optical Sciences, The University of Arizona, Tucson, AZ, United States, 3Evelyn F. McKnight Brain Institute, The University of Arizona, Tucson, AZ, United States, 4Department of Psychology, Neurology, and Neuroscience, The University of Arizona, Tucson, AZ, United States, 5Health Sciences Center, Tulane University, New Orleans, LA, United States, 6Division of Neural Systems, Memory, and Aging, The University of Arizona, Tucson, AZ, United States, 7Department of Medical Imaging, The University of Arizona, Tucson, AZ, United States
Synopsis
Keywords: Microstructure, Diffusion/other diffusion imaging techniques, DTI, fixels, Tractography & Fibre Modeling, Software Tools, Hypertension
Hypertension is associated with an increased risk of cardiovascular disease and cognitive decline in aging humans. This study investigated longitudinal effects of induced HTN in regional and microstructural neuroanatomy of F344 rats using noninvasive diffusion-weighted MRI and fixel-based analysis. Single-shot spin-echo EPI along 64 diffusion directions and three shells (b=1000, 2000, and 3000 s/mm2) was performed. Microstructural changes in the brain appeared in certain regions after 10 weeks of hypertension, yet, most regions remained unaffected, contrasting peripheral organs which showed dramatic fibrosis due to the HTN. This likely demonstrates a robust protective mechanism of the central nervous system.Introduction
Hypertension (HTN) is associated with an increased risk of cardiovascular disease (CVD) and cognitive decline in aging humans1, with onset occurring around middle-age2. Prior research has also shown CVD-associated cognitive decline in the elderly3. As such, it is important to study these interactions between HTN and cognition with age, and how this may affect neuroanatomy, development, and function. Animal models are an integral tool in preclinical, translational research. Transgenic Cyp1a1-Ren2 xenobiotic-inducible rats, such as the Fischer 344 (F344) model, are an appreciable strain in studies of HTN, as induced HTN via Indole-3-Carbinol (I3C) is reversible and dose-dependent in magnitude4. The purpose of this study was to investigate longitudinal effects of induced HTN in regional and microstructural neuroanatomy of F344 rats using noninvasive diffusion-weighted MRI (dMRI).Methods
15-month-old male F344 rats (n=43) were randomly assigned to a control group (n=19) which would receive a regular chow diet, or a hypertension group (n=24) that would receive an I3C-supplemented diet to induce HTN. After a behavioral battery, baseline brain MRI was carried out on a 7T Bruker Biospec (Bruker, Billerica, MA): single-shot spin-echo EPI along 64 diffusion directions and three shells (b=1000, 2000, and 3000 s/mm2) with eight b=0 s/mm2 volumes for each shell (0.3x0.3x0.9mm voxel resolution, TR=10s, TE=60ms, acquisition=12min/shell); and a geometry-matched T2 FSE (TR=0.6s, TEeff =56ms, 16 echoes, acquisition=2min). Following baseline imaging, the treatment group received 10 weeks of I3C-supplemented diet while the control group received regular chow. The behavioral battery and imaging protocol was repeated.Image Processing
DWIs were pre-processed using DIFFPREP (a submodule of TORTOISE) to perform motion and eddy-current distortion correction and resampling (with T2 FSE sequences used as anatomical reference). Denoising and N4 bias-correction was carried out in Mrtrix5. A F344 T2-weighted reference image and labeled atlas (116 regions) were obtained for image processing and analysis6. A fixel-based analysis (FBA), and region-based analysis utilizing F344 T2 reference image and labeled atlas were performed. Fiber orientation distributions (FODs) were generated via constrained spherical deconvolution. A white matter (WM) FOD population template (Figure 1A) was created to generate a WM fixel template (Figure 1B). From these, combined fiber density and cross-section (FDC) subject metrics were generated. A fixel-wise, non-parametric, two-sample t-test was performed on fixel FDC, creating an uncorrected p-value fixel mask to reveal statistical differences between groups. Apparent diffusion coefficient (ADC) and fractional anisotropy (FA) maps were generated from subject DWIs and warped to template space. The F344 T2 reference image6 was registered to template space, with output transformations applied to obtain a template space labeled atlas (Figure 2). This, and subject FA and ADC maps were used to calculate mean FA and ADC values of all 116 regions for analysis. A multiple paired, parametric t-test followed by Holm-Šidák’s multiple comparison test was performed on mean ADC in GM and WM regions >1 mm3, and mean FA in WM regions (and cortex) >1 mm3.Results
Induced HTN (mean systolic and diastolic BP statistically different from control) dramatically impacted peripheral organs (collagen fibrosis of heart and kidney), yet MRI demonstrated the absence of this impact in the brain. However, significant changes in diffusion were observed in specific regions: mean ADC differences were found in 7 out of 49 analyzed regions, notably the hypothalamus (p=0.034) and caudoputamen (p=0.039) (Figure 3). Paired ADC difference was also significant between groups in the caudoputamen (p=0.028) (Figure 3). Significant differences in mean FA of the hypertension group were found in 5 brain regions out of the 19 analyzed, notably the cortex (p=0.0033) and corpus callosum (p=0.031) (Figure 3). FBA showed statistically significant differences (uncorrected p-value < 0.05) in FDC after induced HTN, and little change in control (Figure 4). These changes predominantly appear in the corpus callosum, dentate gyrus, caudoputamen, CA1 of the hippocampus, and cortex.Discussion
Results indicate that there is significant change in microstructure in certain areas of the brain as a result of induced HTN. After HTN, mean ADC was observed to increase in the hypothalamus and caudoputamen (indicating increased diffusion), and mean FA was shown to increase in the cortex and corpus callosum. FBA results corroborate these findings. It should be noted, however, that the majority of the brain remained unaffected in terms of ADC, FA, or FDC. Behavioral testing showed no significant cognitive decline as a result of HTN.Conclusion
dMRI is a sensitive imaging technique for measuring and characterizing water diffusion and microstructural changes in the brain. In this study, we found that microstructural changes in the brain appeared in certain brain regions as a result of induced HTN over 10 weeks, yet remarkably, most regions remained unaffected. This is in contrast to peripheral organs, which showed dramatic fibrosis due to the HTN. This likely demonstrates a robust protective defense mechanism of the central nervous system. Future work in this area would benefit from studying prolonged duration and varying magnitude of HTN to investigate how this protection may break down with degree and duration of HTN.Acknowledgements
This experiment was supported by the McKnight Brain Research Foundation and R01 AG049465.References
- Keenan NL, Rosendorf KA. Prevalence of hypertension and controlled hypertension ‐ united states, 2005‐2008. MMWR Surveill Summ. 2011;60 Suppl:94‐97
- Wilkie F, Eisdorfer C. Intelligence and blood pressure in the aged. Science. 1971;172:959‐962
- Haring B, Leng X, Robinson J, Johnson KC, Jackson RD, Beyth R, Wactawski‐Wende J, von Ballmoos MW, Goveas JS, Kuller LH, Wassertheil‐Smoller S. Cardiovascular disease and cognitive decline in postmenopausal women: Results from the women's health initiative memory study. JAm Heart Assoc. 2013;2:e000369
- Leader CJ, Clark BJ, Hannah AR, Sammut IA, Wilkins GT, Walker RJ. Breeding Characteristics and Dose-dependent Blood Pressure Responses of Transgenic Cyp1a1-Ren2 Rats. Comp Med. 2018 Oct 1;68(5):360-366. doi: 10.30802/AALAS-CM-17-18000026. Epub 2018 Sep 5. PMID: 30185285; PMCID: PMC6200032.
- Tournier, J. D., Smith, R., Raffelt, D., Tabbara, R., Dhollander, T., Pietsch, M., Christiaens, D., Jeurissen, B., Yeh, C. H., Connelly, A. (2019). MRtrix3: A fast, flexible and open software framework for medical image processing and visualisation. NeuroImage (Vol. 202). Academic Press Inc. https://doi.org/10.1016/j.neuroimage.2019.116137
- Goerzen D., Fowler C., Devenyi G. et al. An MRI-Derived Neuroanatomical Atlas of the Fischer 344 Rat Brain. Sci Rep 10, 6952 (2020). https://doi.org/10.1038/s41598-020-63965-x
Figures
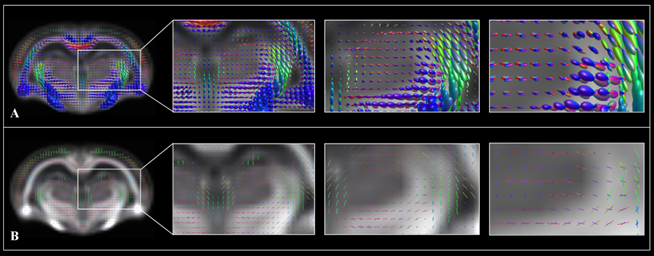
Figure 1. WM FOD
population template overlaid with WM population FODs displayed in spherical
harmonic fashion (A) and overlaid with the WM fixel template (B),
each shown magnified three times.
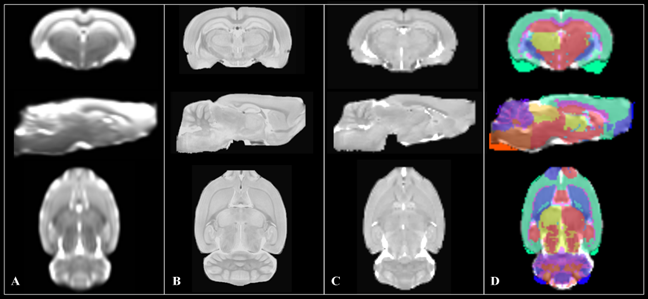
Figure 2. Atlas
registration pipeline shown in three orthogonal views. A b=0 s/mm2 population
template (A) is created as the mean of all b=0 s/mm2 volumes from
masked subject DWIs; the F344 T2-weighted reference image (B) is resampled and registered
to the b=0 s/mm2 population template (C); output transformations are
applied to a 116 region labeled atlas (D) which is displayed in template space.
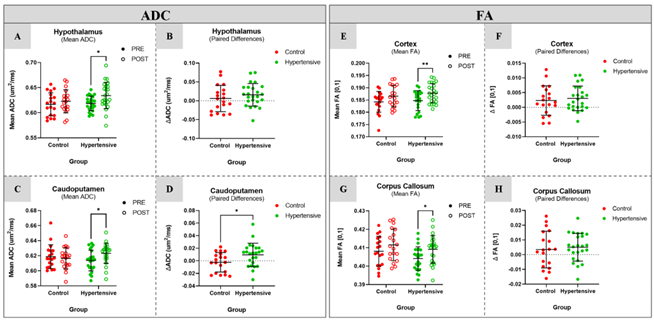
Figure 3. Significant
differences in mean ADC (left block) and FA (right block) before and after
induced HTN, were found in the hypothalamus (A, p=0.034) and caudoputamen (C,
p=0.039) (ΔADC shown in B and D).
Significant difference was found between control and HTN group ΔADC in
the caudoputamen (D, p=0.028).
Significant differences in mean FA of the HTN group before and after induced
HTN were found in the cortex (E,
p=0.0033) and corpus callosum (G,
p=0.031) (ΔFA shown in F and H).
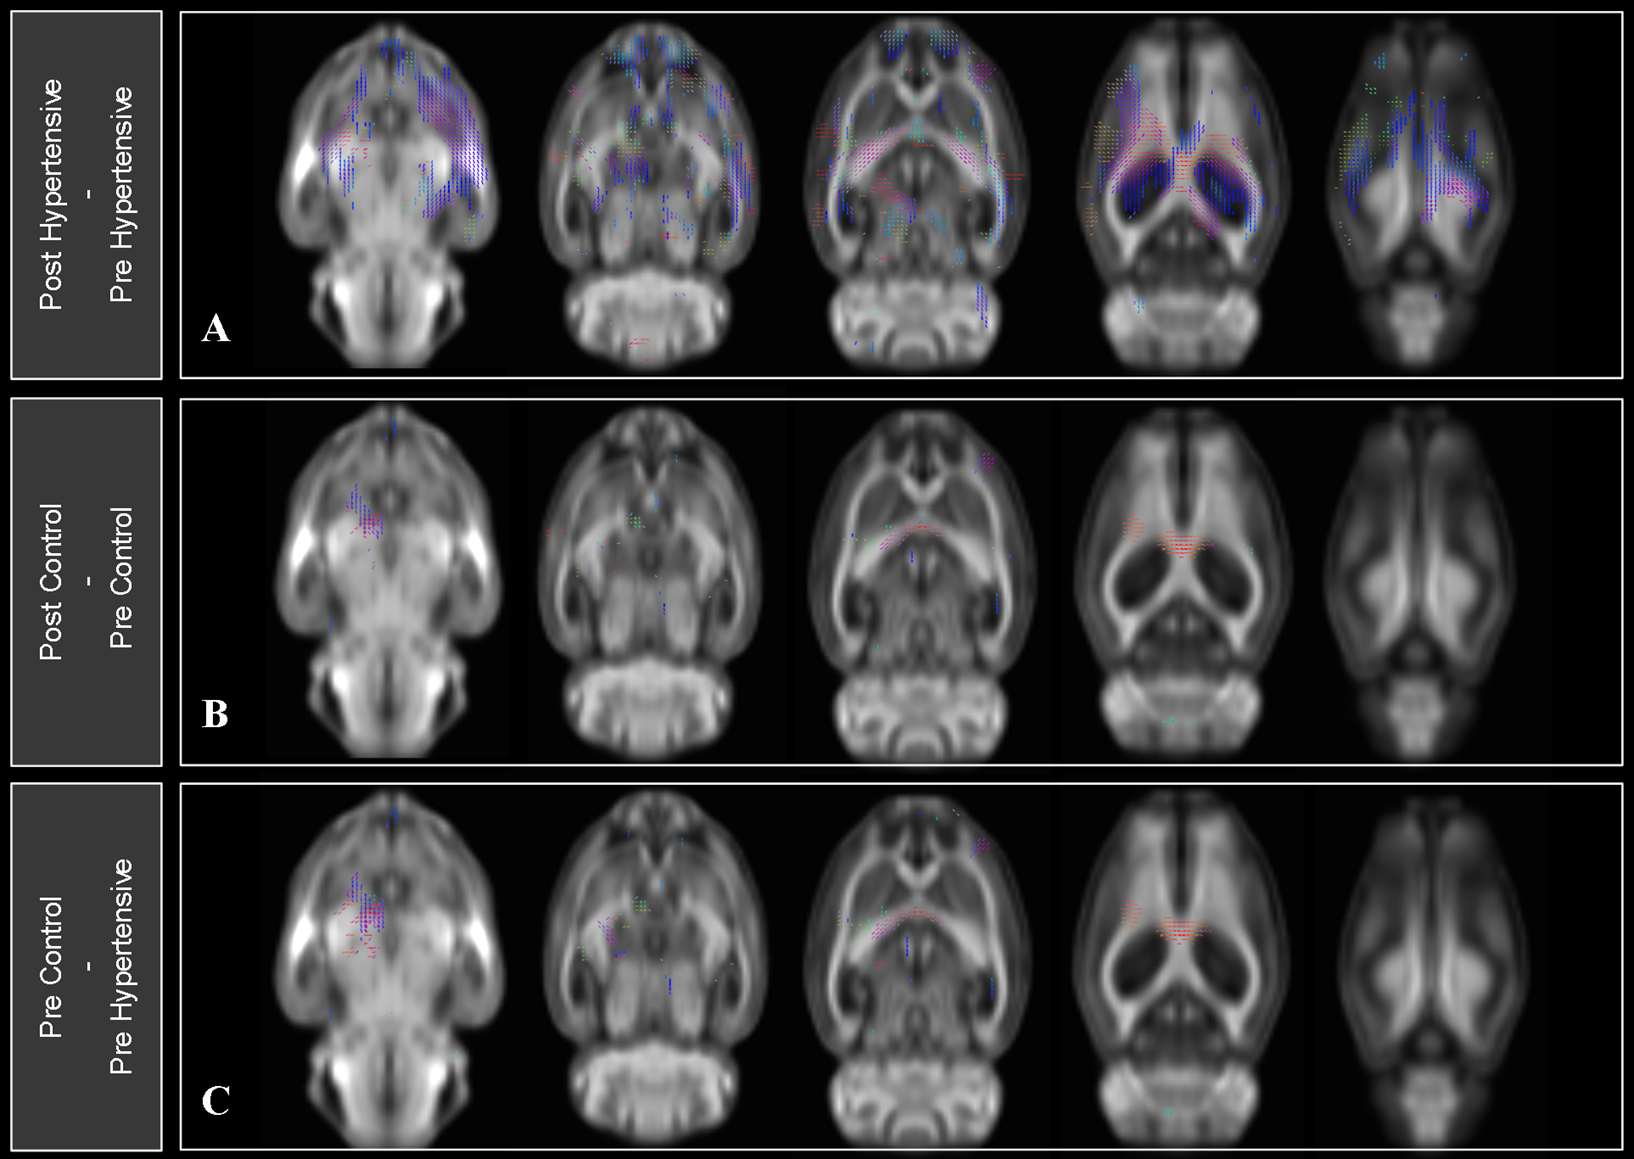
Figure 4. Fixel-based
analysis results overlaid on multi-slice images of the WM FOD population
template. Fixels are displayed and thresholded by significance mask (uncorrected
p < 0.05). Color indicates fiber density. Statistical significance in fixel
FDC is shown as compared between A) post HTN and pre HTN, B) post
control and pre control, and C) pre control and pre HTN.
DOI: https://doi.org/10.58530/2023/4318