4316
Mapping biophysical changes in stroked tissue via the Standard Model with Exchange (SMEX) diffusion model1Champalimaud Research, Champalimaud Foundation, Lisbon, Portugal, 2Center of Functionally Integrative Neuroscience (CFIN) and MINDLab, Department of Clinical Medicine, Aarhus University, Aarhus, Denmark, 3Department of Physics and Astronomy, Aarhus University, Aarhus, Denmark
Synopsis
Keywords: Diffusion/other diffusion imaging techniques, Microstructure, Exchange
Apparent diffusion coefficient (ADC) contrasts in stroke are still debated over 30 years after their discovery, mainly because of the nonspecific nature of ADC. Here, we harness Standard Model with Exchange (SMEX) measurements in ex-vivo stroked brains, to investigate how tissue microstructure is changed with ischemia. SMEX provides insight into neurite density, diffusivity and – importantly – exchange between neurite and extracellular environments. Using an extensive dataset, we find changes in neurite density and diffusivity that are consistent with neurite beading effects, which were further confirmed histologically. Dramatic reductions in exchange rates in the ischemic core were also observed.Introduction
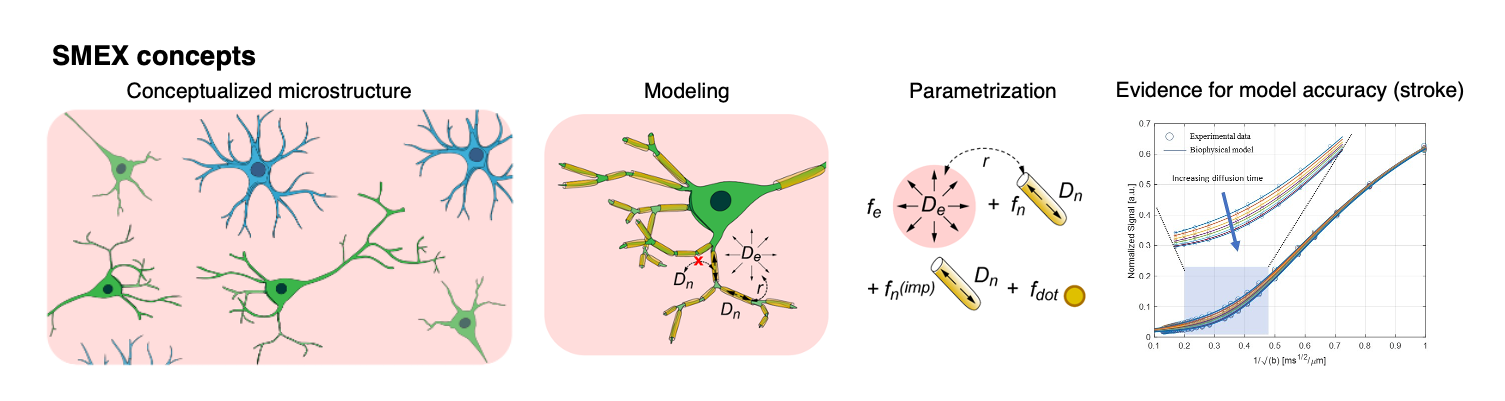
Diffusion MRI (dMRI) work in gray matter identified signatures for exchange from decreases in signal at high b-values with increasing diffusion time1–3 . Given sufficient data, this time dependence enables the extraction of neurite fraction and diffusivity, extracellular fraction and diffusivity and exchange between them via the Standard Model with Exchange (SMEX1, Figure 1) framework and its limiting case Neurite Exchange Imaging (NEXI2)). Early experiments in stroke already suggested the importance of exchange in dMRI signals3; here, we set to investigate SMEX contrasts in an experimental model of cerebral ischemia, and to provide insights into possible mechanisms of dMRI contrast generation.Methods
All animal experiments were preapproved by institutional and national authorities and carried out according to European Directive 2010/63.Stroke Induction and sample preparation. N=3 adult C57BL/6 mice underwent stroke induction using the Rose Bengal protocol as previously described4,5. Three hours after stroke induction, the animals were transcardially perfusion fixed, brains were extracted, and were then kept in 4% PFA for 24h and then washed in PBS for 48h. Thereafter, the brains were placed in a 10mm NMR tube filled with Fluorinert for susceptibility matching.
MRI. The MRI experiments in this study were performed on a Bruker Aeon Ascend 16.4T scanner equipped with a Micro5 probe capable of delivering up to 3000 mT/m isotropically. Samples were kept at 37°C and experiments were only initiated after the brain stabilised for at least 4h. All experiments were acquired with the following common parameters: EPI, acquisition bandwidth 385 kHz, 2 segments, double sampling; Partial Fourier factor 1.38; TR/TE = 3000/54 ms; FOV = 10.6 × 9 mm2, in plane resolution = 100×100 µm2, slice thickness = 600 µm; 5 slices. SMEX experiments were acquired with 32 b-value shells up to 60 ms/µm2, 60 directions, δ=6ms, and 8 different diffusion times Δ ranging from 8.5-35 ms. 30 non-diffusion weighted acquisitions.
MRI data Analysis. All data were processed in MATLAB®, and the pipeline included a Marchenko–Pastur PCA Tensor denoising6 prior to reconstruction of EPI data. Real-valued signals7 were fitted to the SMEX model and its parameters were extracted voxelwise as in Olesen et al1, including a dot fraction8.
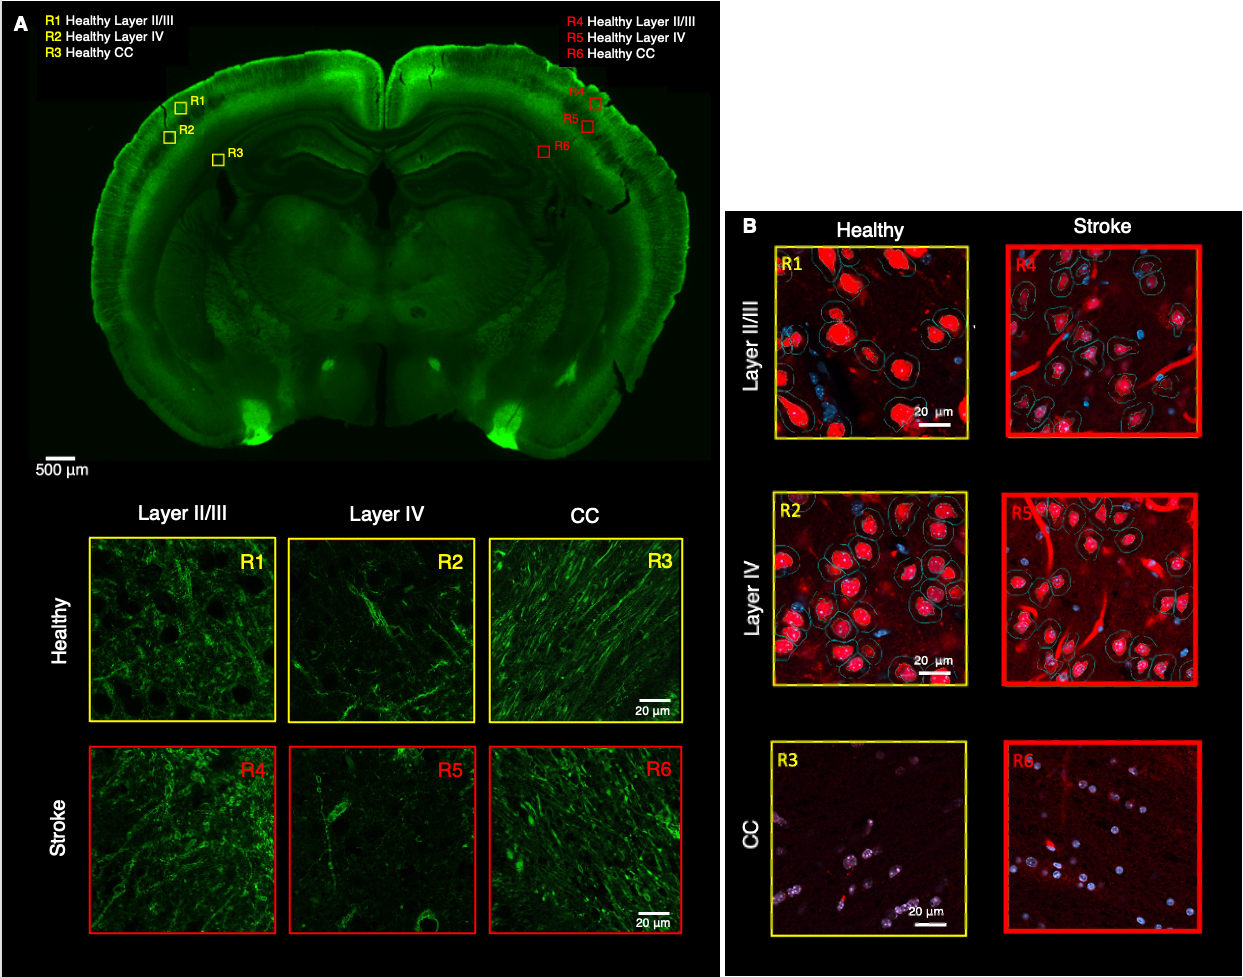
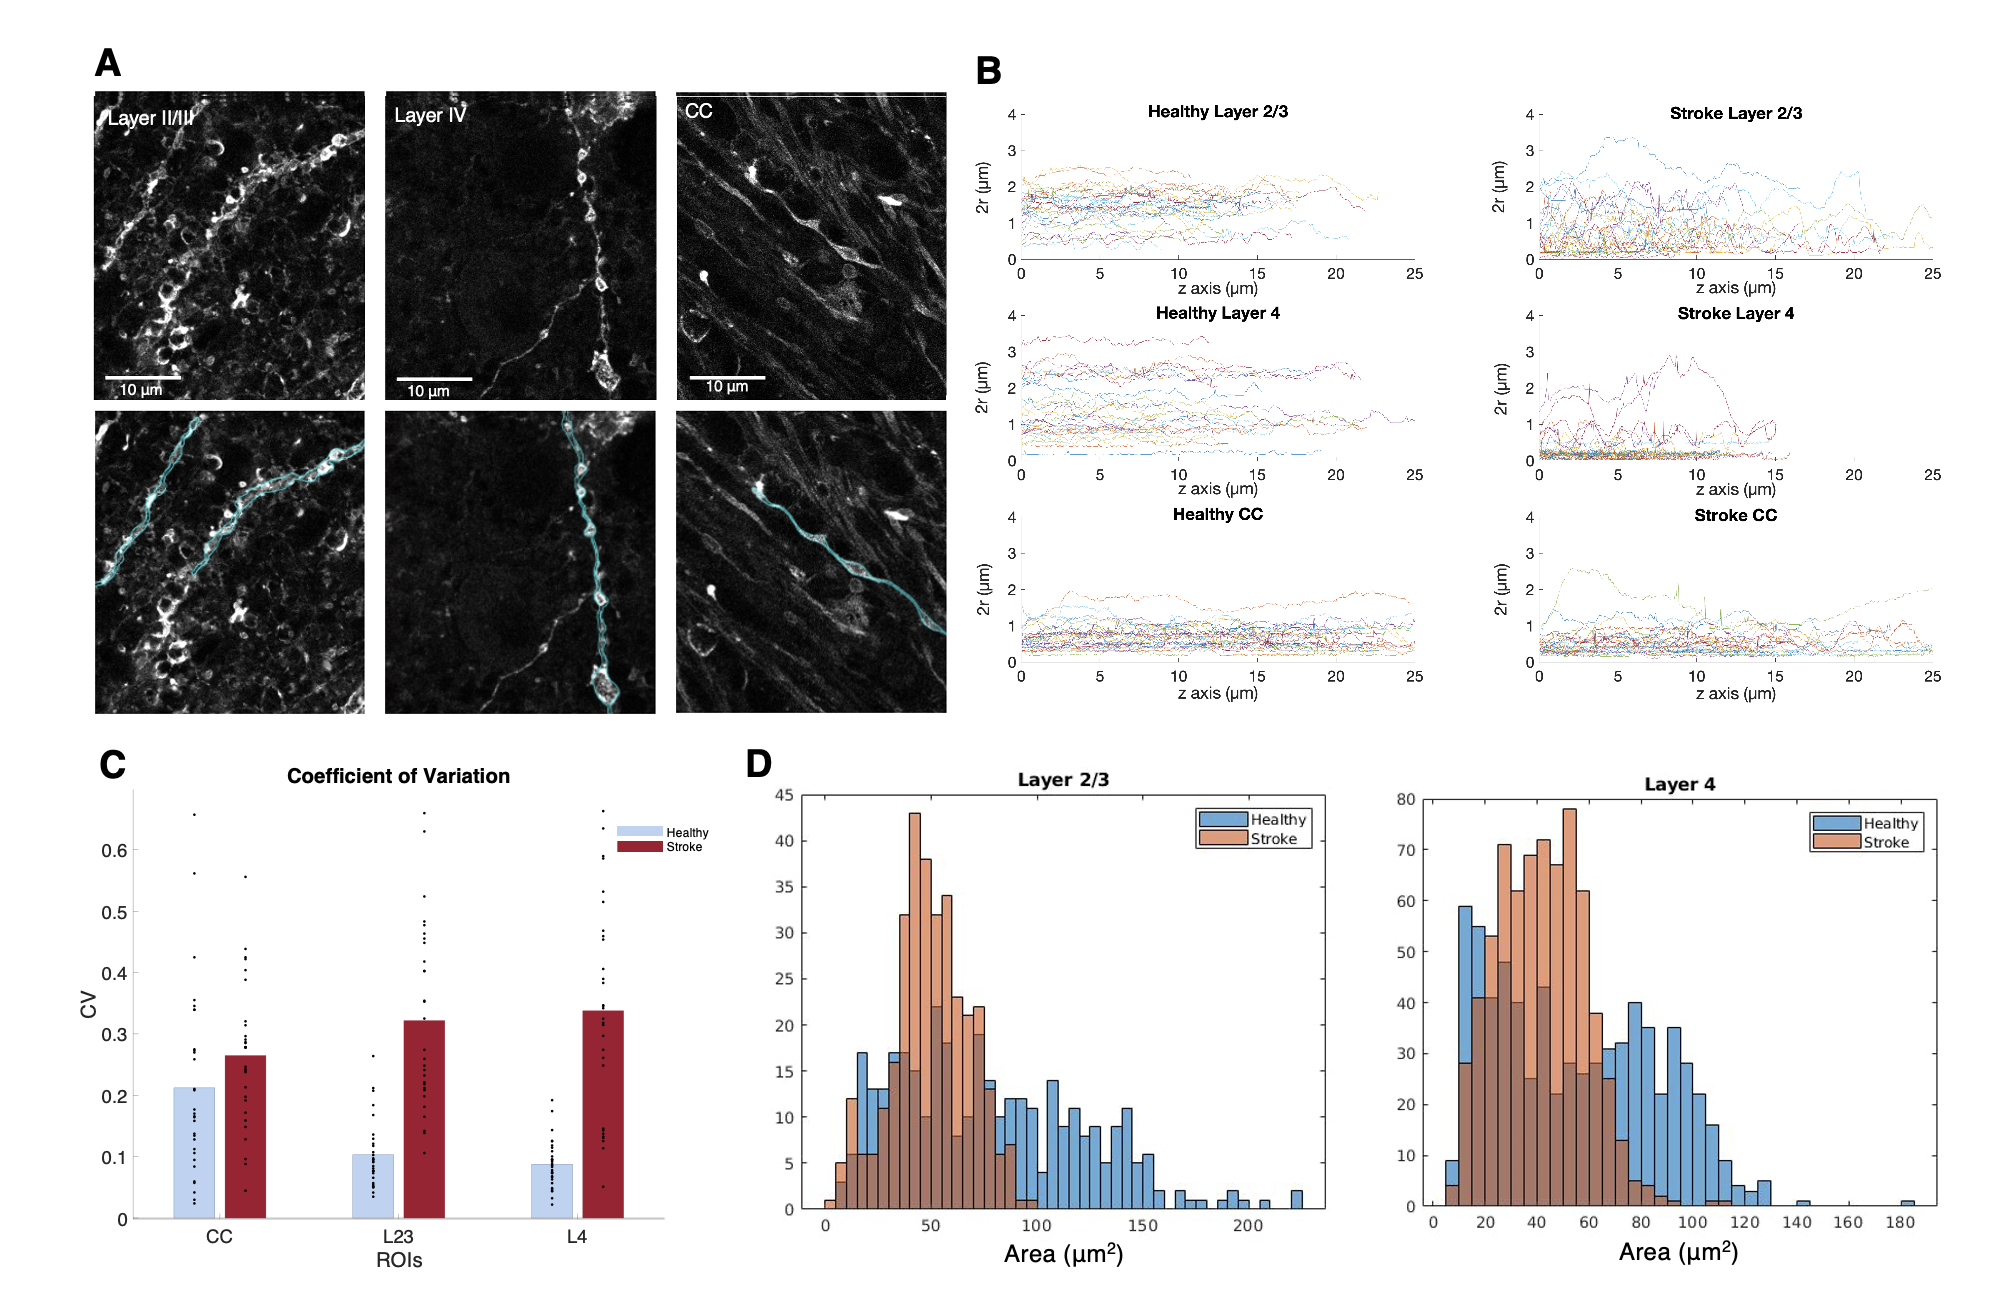
Histology. Slices from a Thy1-ChR2-YFP fixed brain were obtained (50 µm thickness) and stained with anti-GFP and anti-NeuN. Three ROIs from the ipsi- and contralesional hemispheres were manually selected in S1bf (layer II/III, layer IV and corpus callosum (CC)) and scanned using a Zeiss LSM 980 Confocal Microscope at 40x magnification. Neurite segmentation was manually performed using QuPath. The segmented dendrites were skeletonized and their respective diameter was used as a reference to calculate the radius cross sectional variance CV(2r) using an in-house developed pipeline.
Results
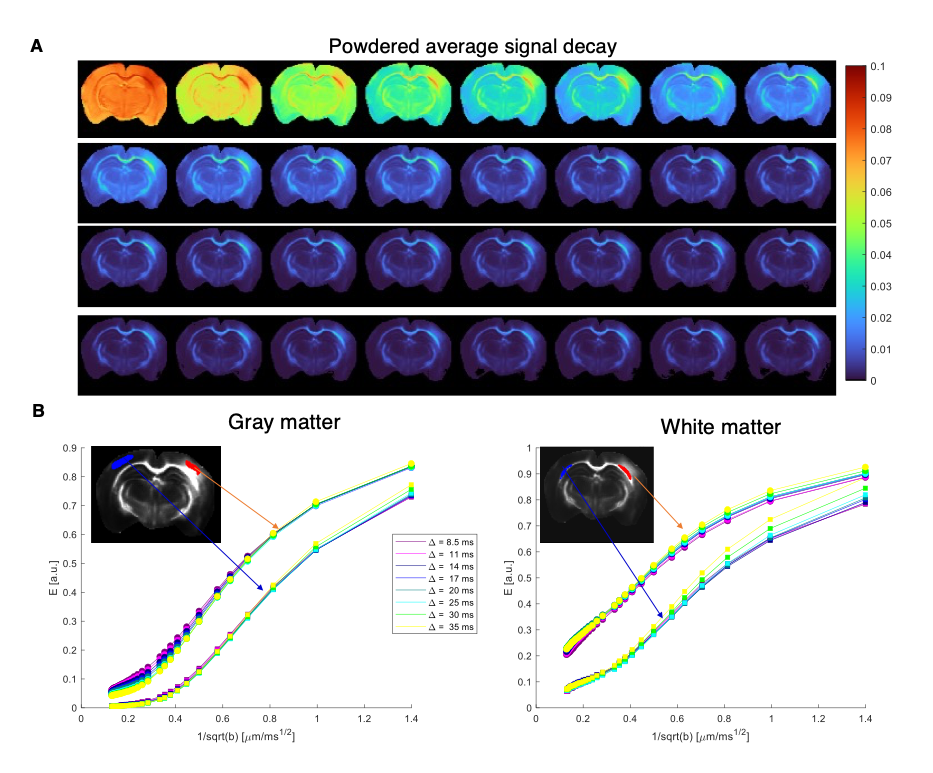
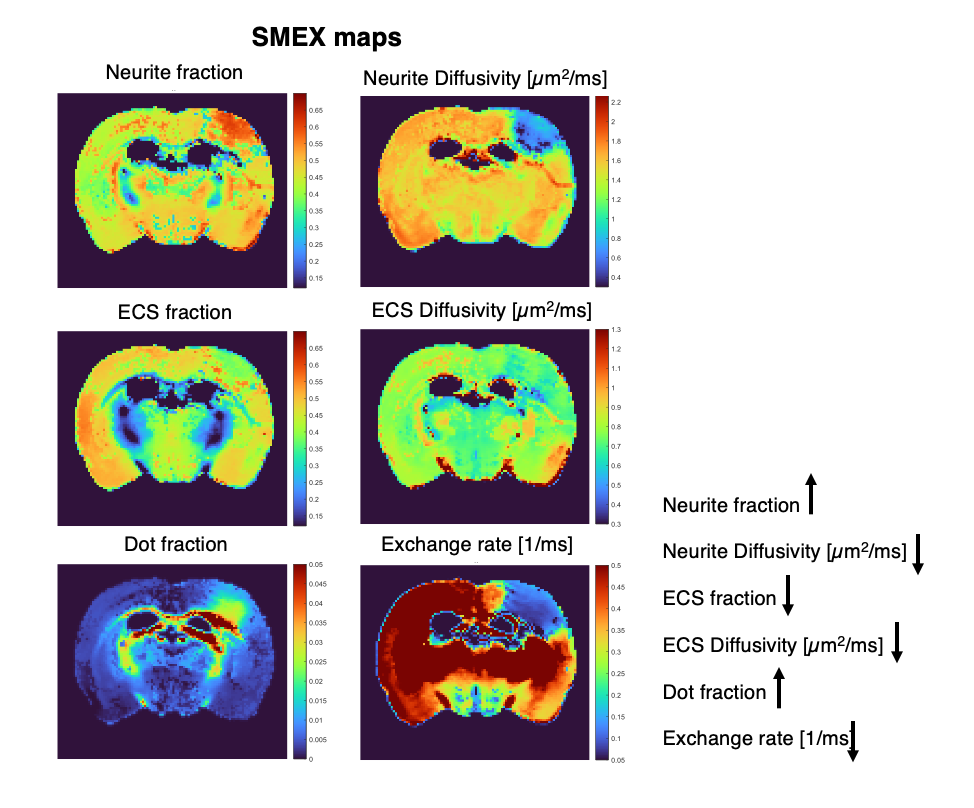
Figure 2 shows the powder-averaged signals for all b-values from a slice in a representative brain. Clear signal decays are observed for the entire b-value range both in grey matter and in white matter tissue, above the noise level. ROIs confirm the robustness of the decay, and the signatures for exchange are clearly observed in GM, and less so in WM. Maps arising from fitting the data to the SMEX model are shown in Figure 3 for a representative mouse brain, and the main effect directions are summarized on the right. Notably, in stroked GM, neurite fraction increases while the neurite diffusivity decreases, while extracellular fraction decreases somewhat with a small decrease in extracellular diffusivity. The dot fraction is much higher in the stroked WM, and strikingly, exchange rates are much lower in the stroked GM. These trends were consistent across the other brains scanned in this study. Figure 4A shows a representative histological section stained for neurons from another mouse brain. We focused on the microstructure in cortical layers II/III and layer IV, as well as in an ROI in CC. Notably, large-scale beading effects were observed in the stroked areas. Furthermore, when the tissues were stained for neuronal markers, we observed neuronal shrinkage and less neurons in the stroked area. Figure 5 quantifies the beading extent and cell loss. Notably, the coefficient of neurite diameter variation along its length is higher in stroked areas.Discussion
The decrease in neurite diffusivity and increase in fraction is consistent with extensive neurite beading effects5,9,10. Our histology qualitatively validated these findings, suggesting that the neurite density indeed reflects neurite microstructural changes in stroke. It is plausible that the more commonly observed ADC decreases in stroke predominantly reflect these neurite beading effects. The larger dot fraction may be related to the increase in very narrow “connectors” between the beads, but further experiments are necessary to elucidate the mechanism behind the dot fraction8. The striking decrease in exchange rates in the stroked GM may arise from metabolic dysfunction or alternatively from an epiphenomenon of decreased exchange upon beading (the water is trapped because it cannot exchange due to the failure of the ATP pumps).Conclusion
SMEX provides enhanced specificity towards subcellular microstructural features in stroke, which may assist in better delineating ischemic processes in the future and may further generalize to other forms of injury.Acknowledgements
CONGENTO, PORTUGAL 2020 European Regional Development Fund (ERDF) and Fundação para a Ciência e Tecnologia LISBOA-01-0145-FEDER-022170. RNH was supported by the Scientific Employment Stimulus 4th Edition from Fundação para a Ciência e Tecnologia, Portugal, ref 2021.02777.CEECIND.References
1. Olesen J, Østergaard L, Shemesh N, Jespersen S. Diffusion time dependence, power-law scaling, and exchange in gray matter. Neuroimage. 2022; 251:118976.
2. Jelescu I, de Skowronski A, Geffroy F, et al. Neurite Exchange Imaging (NEXI): A minimal model of diffusion in gray matter with inter-compartment water exchange. Neuroimage. 2022; 256:119277
3. Lätt J, Nilsson M, van Westen D, et al. Diffusion-weighted MRI measurements on stroke patients reveal water-exchange mechanisms in sub-acute ischaemic lesions. NMR Biomed. 2009; 22(6):619-628.
4. Watson B, Dietrich W, Busto R, et al. Induction of reproducible brain infarction by photochemically initiated thrombosis. Ann Neurol. 1985;17(5):497-504. doi:10.1002/ana.4101705135.
5. Alves R, Henriques R, Kerkelä L, Chavarrías C, Jespersen S, Shemesh N. Correlation Tensor MRI deciphers underlying kurtosis sources in stroke. Neuroimage. 2022;247.5. Olesen J, Ianus A, Østergaard L, et al. Tensor denoising of high-dimensional MRI data. Published online March 30, 2022.
6. Olesen J, Ianus A, Østergaard L, et al. Tensor denoising of high-dimensional MRI data. Published online March 30, 2022.
7. Eichner C, Cauley S, Cohen-Adad J, et al. Real diffusion-weighted MRI enabling true signal averaging and increased diffusion contrast. Neuroimage. 2015;122:373-384.
8. Tax C, Szczepankiewicz F, Nilsson M, et al. The dot-compartment revealed? Diffusion MRI with ultra-strong gradients and spherical tensor encoding in the living human brain. Neuroimage. 2020;210:116534.
9. Budde M, Frank J. Neurite beading is sufficient to decrease the apparent diffusion coefficient after ischemic stroke. Proc Natl Acad Sci U S A. 2010;107(32):14472-14477.
10. Skinner N, Kurpad S, Schmit B, et al. Detection of acute nervous system injury with advanced diffusion-weighted MRI: a simulation and sensitivity analysis. NMR Biomed. 2015;28(11):1489-1506.
Figures