4315
High Resolution In Vivo Diffusion Tensor Distribution MRI of the Whole Human Brain with 300 mT/m Gradients
Kulam Najmudeen Magdoom1,2, Alexandru V. Avram1,2, Dario Gasbarra3, Thomas Witzel4, Susie Yi Huang4, and Peter J Basser2
1The Henry M. Jackson Foundation for the Advancement of Military Medicine (HJF) Inc., Bethesda, MD, United States, 2National Institute of Health, Bethesda, MD, United States, 3University of Helsinki, Helsinki, Finland, 4Athinoula A. Martinos Center for Biomedical Imaging, Massachusetts General Hospital, Charlestown, MA, United States
1The Henry M. Jackson Foundation for the Advancement of Military Medicine (HJF) Inc., Bethesda, MD, United States, 2National Institute of Health, Bethesda, MD, United States, 3University of Helsinki, Helsinki, Finland, 4Athinoula A. Martinos Center for Biomedical Imaging, Massachusetts General Hospital, Charlestown, MA, United States
Synopsis
Keywords: Diffusion/other diffusion imaging techniques, Microstructure, Multiple diffusion encoding
Whole brain DTD MRI was performed at 1.2 mm isotropic resolution in-vivo using 300 mT/m gradients. An efficient and easy to implement interfused-PFG (iPFG) sequence was used to acquire multiple diffusion encoded images. Size, shape and orientation heterogeneity are measured and mapped from the estimated DTD along with a new form of tractography. The results show varying heterogeneity in different areas of the cerebral cortex, and subcortical and white matter regions. DTD tractography captured complex fiber configurations absent in DTI tractography.
Introduction
Imaging brain tissues properties at the mesoscopic scale is an invaluable method for studying normal and abnormal brain function. However, the low sensitivity of NMR makes it challenging to achieve native mesoscopic voxel resolution. Diffusion tensor distribution (DTD) MRI models the voxel an ensemble of microscopic diffusion tensors [1] thereby enabling the measurement of diffusion processes at the mesoscopic and microscopic scales, orders of magnitude smaller than the nominal voxel size. In this study, we used state-of-the-art 300 mT/m gradients with high imaging acceleration factors to acquire multiple diffusion encoded (MDE) data of a whole human brain in vivo at 1.2 mm isotropic resolution and estimate DTDs. The high spatial resolution of the scans reduces the structural complexity of the tissue within each voxel and allows us to probe intracortical heterogeneity effectively.Methods
The diffusion weighted signals were acquired using a novel double PFG pulse sequence called interfused-PFG, a.k.a. iPFG, with EPI readout and multi-band (MB) slice excitation (Figure 1), which uses efficient trapezoidal gradients with well-defined diffusion times. The sequence is also immune to concomitant gradient field artifacts known to bias DTD results. Diffusion encoding was obtained using rank-1 and rank-2 b-tensors. The two independent gradients in the diffusion block were estimated numerically to yield a set of 216 diffusion encoding b-tensors with uniform distribution of sizes (b = 0 – 2,500 s/mm2), shapes, and orientations for an unbiased estimation of the DTD [2].The DTD was assumed to be derived from a normal tensor variate distribution (NTVD) whose samples are constrained to be positive definite (CNTVD) to ensure physicality and estimated using methods outlined in [2]. CNTVD requires only rank-1 and rank-2 b-tensors for DTD estimation and yields a compact, maximum entropy distribution. The estimated DTD was used to synthesize micro-diffusion tensors within each voxel whose size, shape and orientation heterogeneity were quantified using measures derived from their eigenvalue and eigenvector distributions. The ODFs were computed for the mean tensor (i.e., DTI-ODF) and the distribution of tensors (i.e., DTD-ODF) to perform streamline tractography in MRTrix software environment [3].
MRI data in a healthy volunteer was acquired on a 3T scanner (MAGNETOM Connectome, Siemens Healthineers) with 300 mT/m peak gradient strength and a 200 T/m/s slew rate using 64-channel coil. Whole-brain DTD MRI data was acquired using the following parameters: δ\τm\Δ = 9\9\33 ms, FOV=180 x 180 x 148 mm, MB factor = 3, GRAPPA acceleration factor = 2, 3 averages, TR\TE = 5,500\82 ms, and a 1.2 mm isotropic spatial resolution. The b = 0 s/mm2 acquisition was repeated with reversed phase encoding to correct for susceptibility distortions. The background phase in the complex data was removed to yield real valued images [4] which were corrected for gradient nonlinearities, denoised [5], and registered using FSL [6].
Results and Discussion
The size, shape and orientation heterogeneity measures for a slice in the brain are shown in Figures 2, 3 and 4 respectively with special emphasis on cortical heterogeneity shown using insets of the visual cortex (Brodmann area, BA 17) and the operculum (Brodmann area, BA 44). The results show variability in the mesoscopic heterogeneity across different areas of the cortex at the length scale probed by our measurement. In BA17, there was high orientation heterogeneity but low size heterogeneity which may be due to powder averaging of equisized cells and/or splaying of white matter fibers as they enter the cortex. In BA 44, we observed large values of size, shape and orientation heterogeneities with the size and shape skewness measures displaying intracortical contrast akin to layers. This tripartite layering structure aligns with the known cytoarchitectonic features in this area [7]. The DTD contrast was also observed in sub-cortical regions and various white matter regions. The increased size heterogeneity in the white matter area shown using yellow arrow in Figure 2 might be due to differences in the diameter of axon bundles traversing the region. The orientational heterogeneity of white matter was also captured in DTD tractography result shown in Figure 5 which showed complex fiber organization in the μODF derived tracts absent in the DTI-ODF derived tracts.Conclusion
We have introduced a suite of new diffusion MRI tools to study mesoscopic heterogeneity in whole brain using DTD MRI. We classified the tissue heterogeneity into size, shape and orientation of micro-diffusion tensors and provide independent measures which characterize the brain tissue. We showed novel contrasts within various cortical and sub-cortical regions, and white matter.It should be noted that even at the spatial resolution and with the diffusion gradients used in this study, macroscopic heterogeneity may dominate in some voxels especially those with CSF. With the advent of advanced image readout strategies and stronger and faster gradients [8], it may be possible to achieve true mesoscopic resolution in a greater proportion of voxels by performing DTD at even higher k- and q-space resolution.
Acknowledgements
This work was funded by the Intramural Research Program of the Eunice Kennedy Shriver National Institute of Child Health and Human Development, and with some support from the NIH BRAIN Initiative: “Connectome 2.0: Developing the next generation human MRI scanner for bridging studies of the micro-, meso- and macro-connectome”, U01EB026996, and the Center for Mesoscale Mapping, an NIH-funded National Center for Biomedical Imaging and Biotechnology, P41EB030006. This work utilized computational resources of the NIH HPC Biowulf cluster (http://hpc.nih.gov). The opinions expressed herein are those of the authors and are not necessarily representative of those of the Uniformed Services University of the Health Sciences (USUHS), the Department of Defense (DOD), the NIH or any other US government agency, or the Henry M. Jackson Foundation for the Advancement of Military Medicine, Inc.References
- Jian, B., Vemuri, B. C., Ozarslan, E., Carney, P. R. & Mareci, T. H. A novel tensor distribution model for the diffusion-weighted MR signal. Neuroimage 37, 164–76 (2007).
- Magdoom, K. N., Pajevic, S., Dario, G. & Basser, P. J. A new framework for MR diffusion tensor distribution. Sci. Rep. 11, 2766 (2021).
- Tournier J-Donald, Calamante Fernando, Connelly Alan. MRtrix: Diffusion tractography in crossing fiber regions. International Journal of Imaging Systems and Technology 22(1):53-66 (2012).
- Eichner, Cornelius, et al. "Real diffusion-weighted MRI enabling true signal averaging and increased diffusion contrast." NeuroImage 122: 373-384 (2015)
- Veraart, J. et al. Denoising of diffusion MRI using random matrix theory. NeuroImage 142, 394–406 (2016).
- Jenkinson, M., Beckmann, C. F., Behrens, T. E. J., Woolrich, M. W. & Smith, S. M. FSL. NeuroImage 62, 782–790 (2012).
- Brigitte Stemmer and Harry A. Whitaker. CHAPTER 4 - Architectonic Language Research. In Handbook of the Neuroscience of Language 33-43 (2008)
- Huang, Susie Y., et al. "Connectome 2.0: Developing the next-generation ultra-high gradient strength human MRI scanner for bridging studies of the micro-, meso-and macro-connectome." NeuroImage 243 (2021): 118530.
Figures
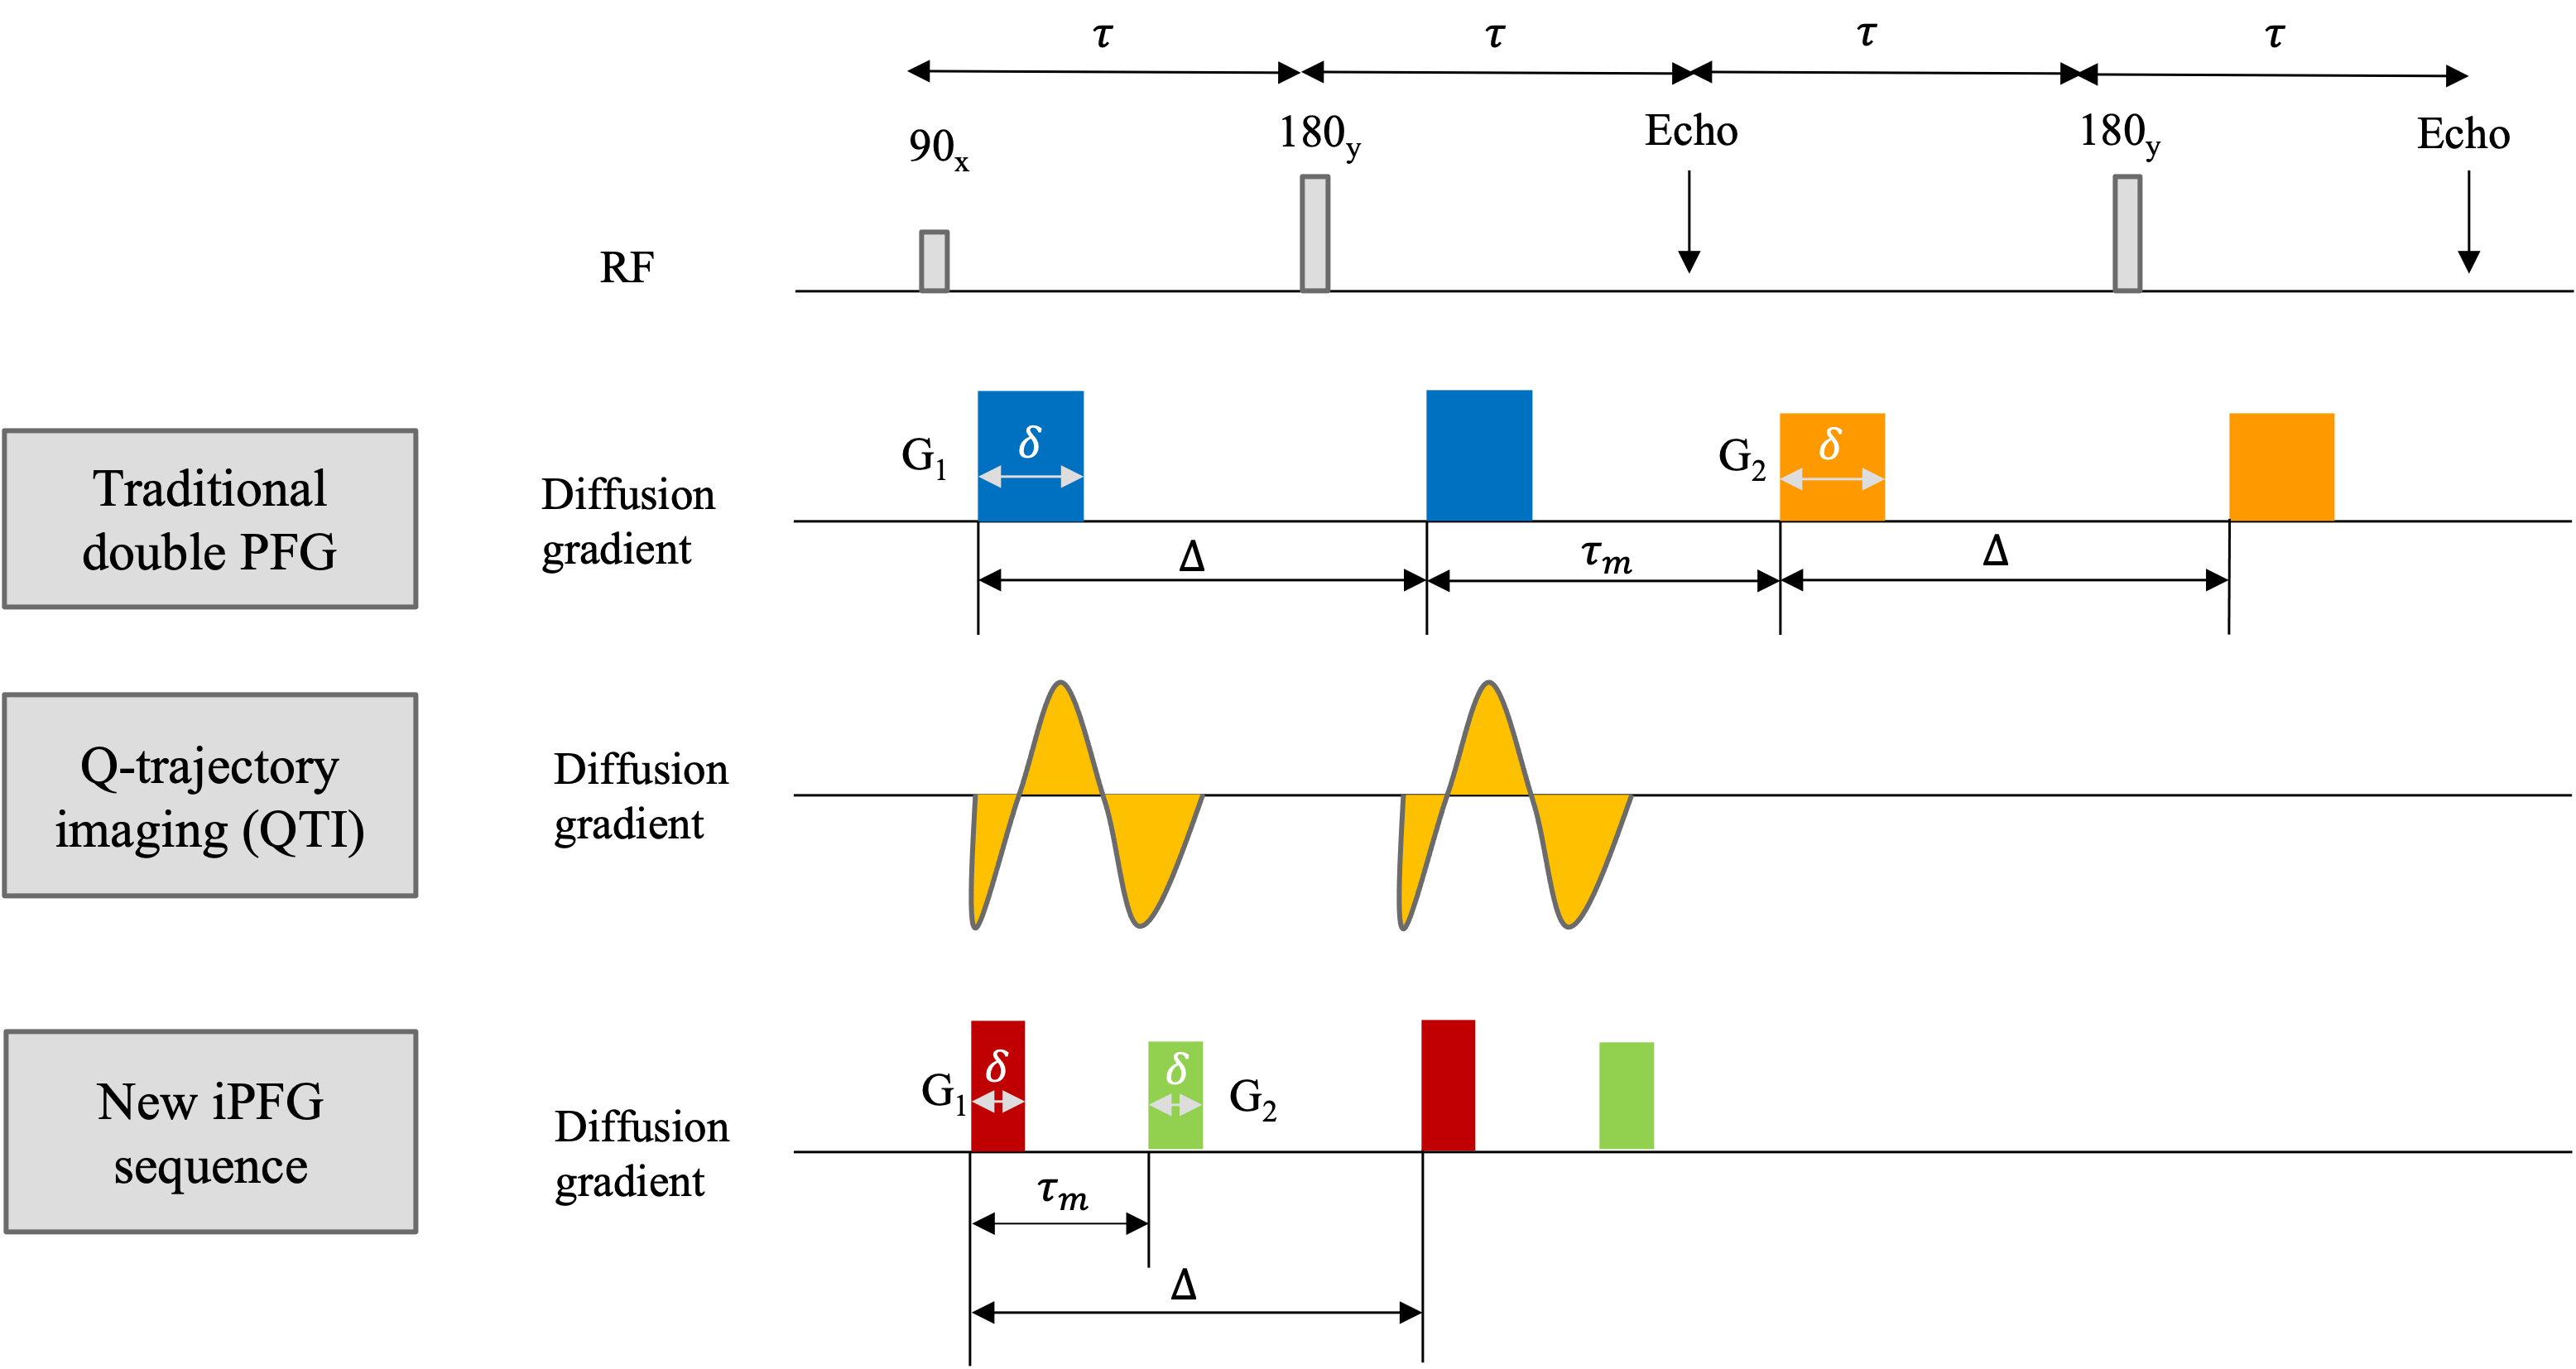
Figure 1: Interfused-pulsed field gradient (iPFG) capable of generating arbitrarily shaped rank-1 and rank-2 b-tensor in a single spin echo compared with the traditional method and recent q-trajectory imaging (QTI). The new sequence combines the advantage of traditional and QTI method while also immune to concomitant gradient and coherence artifacts. The two-diffusion encoding gradient pairs, G1 and G2, may be applied along the same or different directions. The duration of the individual diffusion gradient pulses, δ, mixing time, τm, and the diffusion time, Δ, are also indicated.
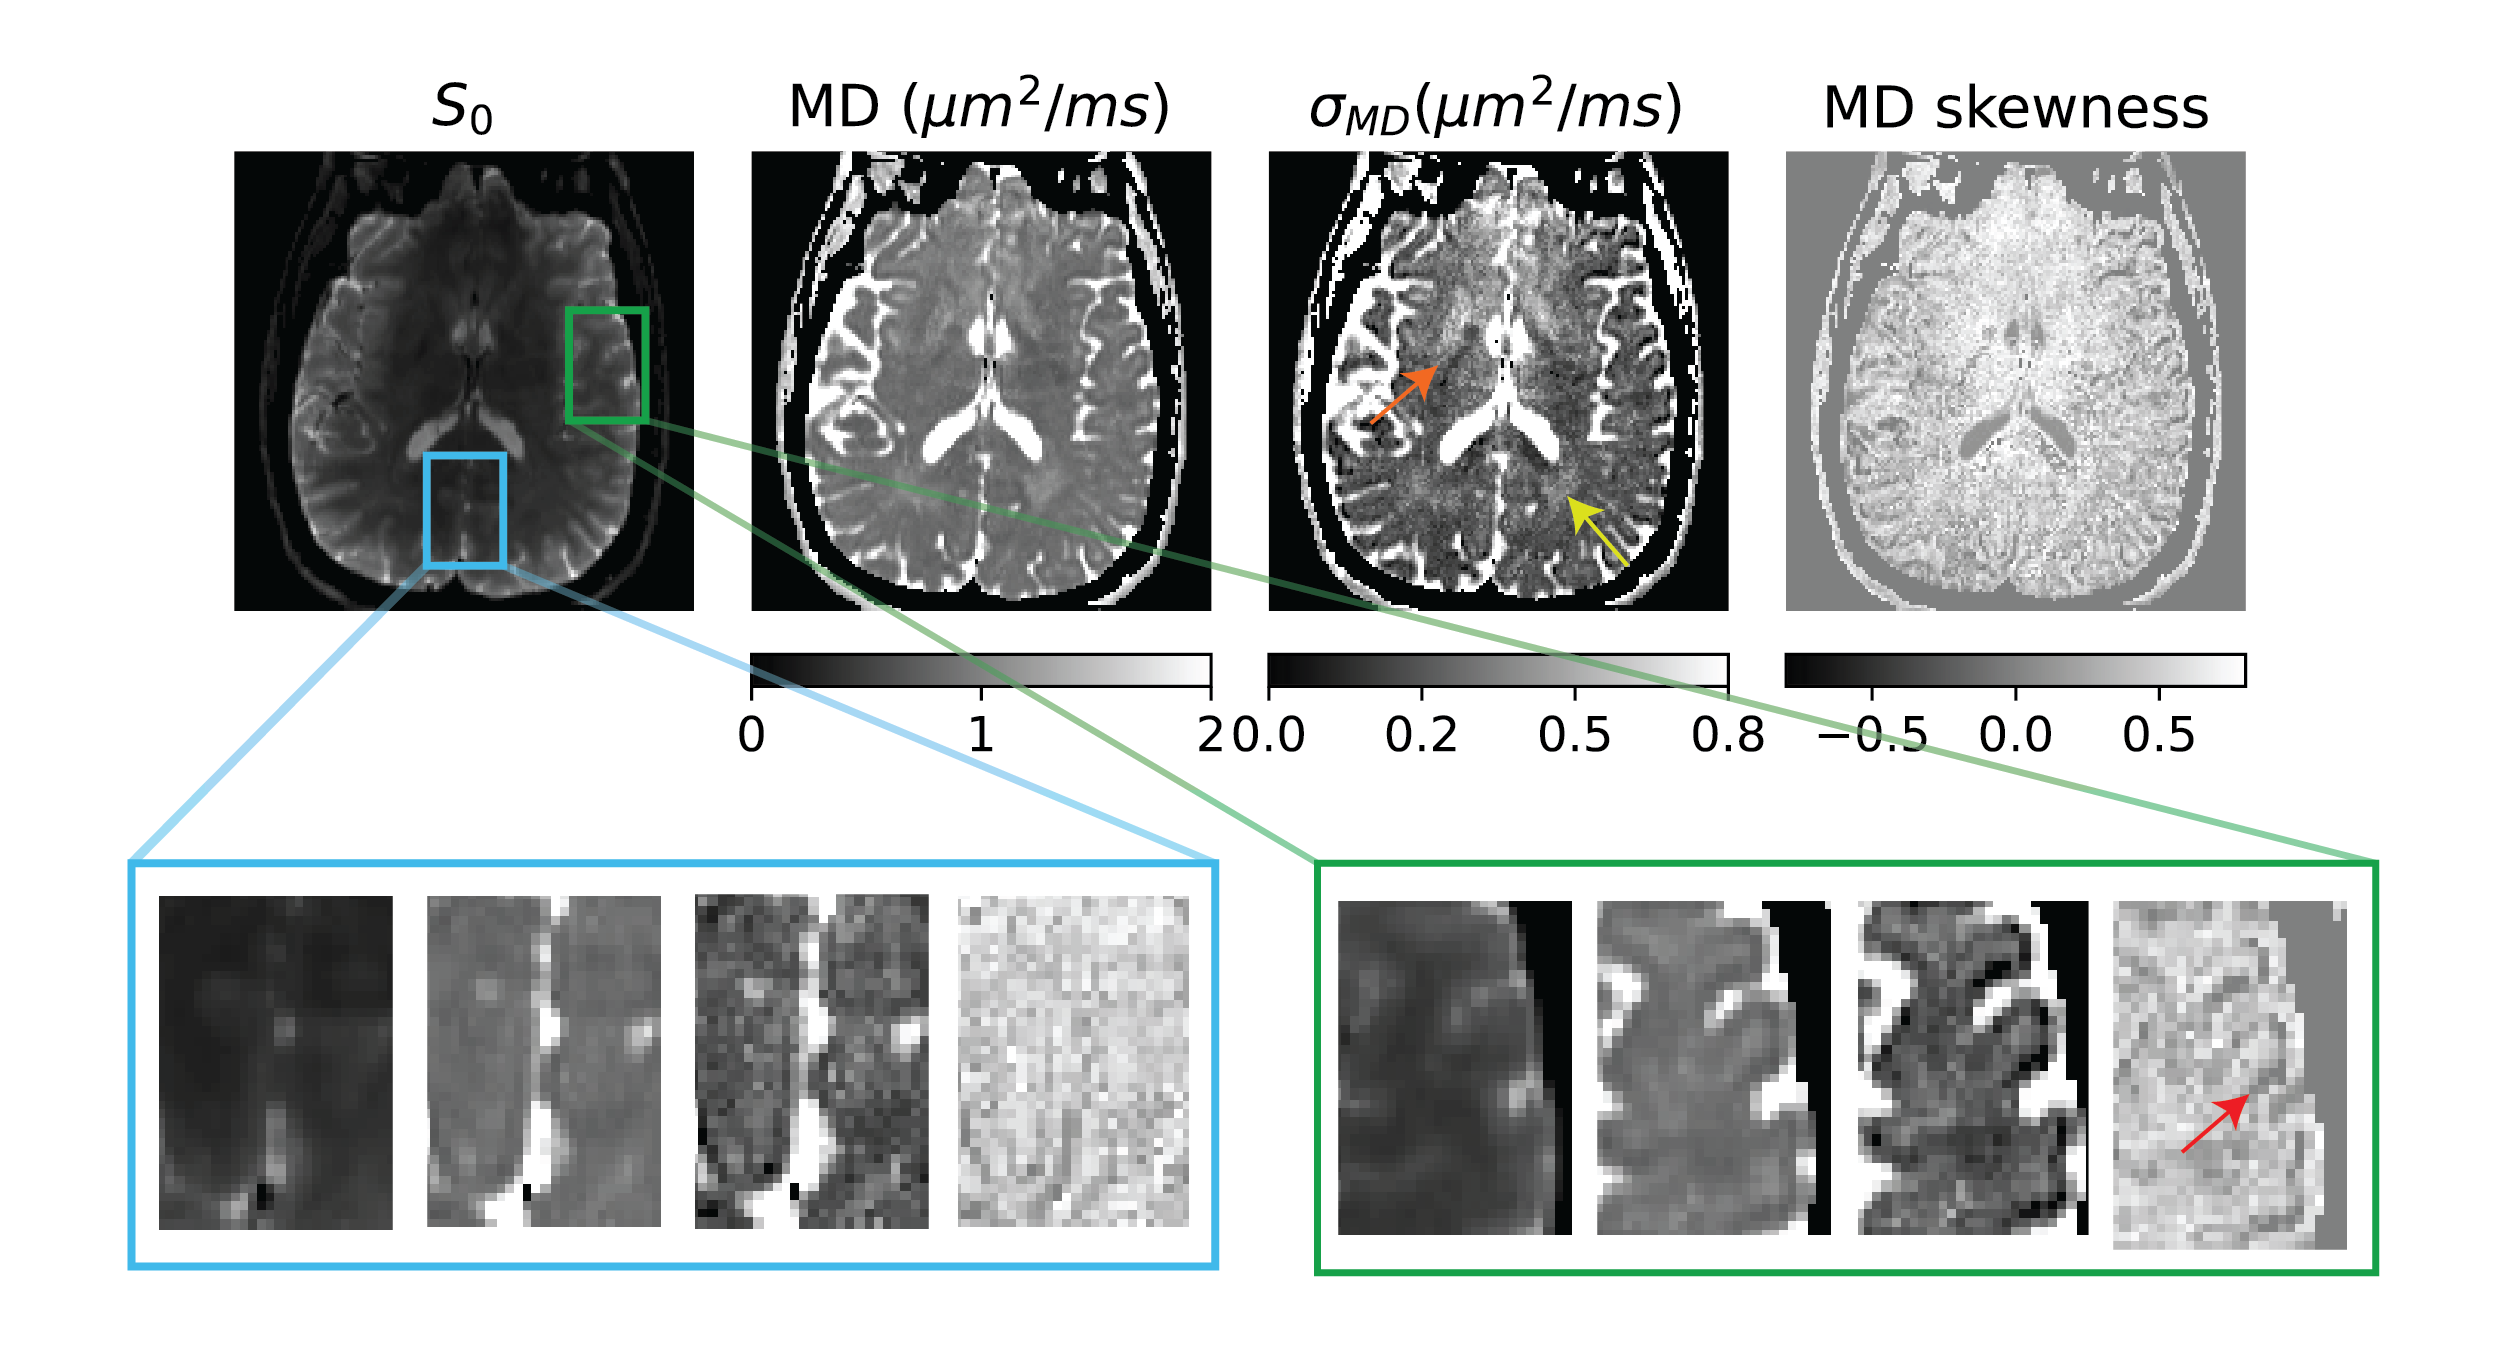
Figure 2: Size heterogeneity measure for a slice given by the moments of the mean diffusivity (MD) distribution of micro-diffusion tensors with blue and green insets showing contrast in the visual cortex and operculum respectively. There was no obvious size contrast in the visual cortex but not so in the operculum where the contrast sharpens with higher MD moments shown using the red arrow. There was also contrast in subcortical gray and white matter shown using orange and yellow arrows respectively.
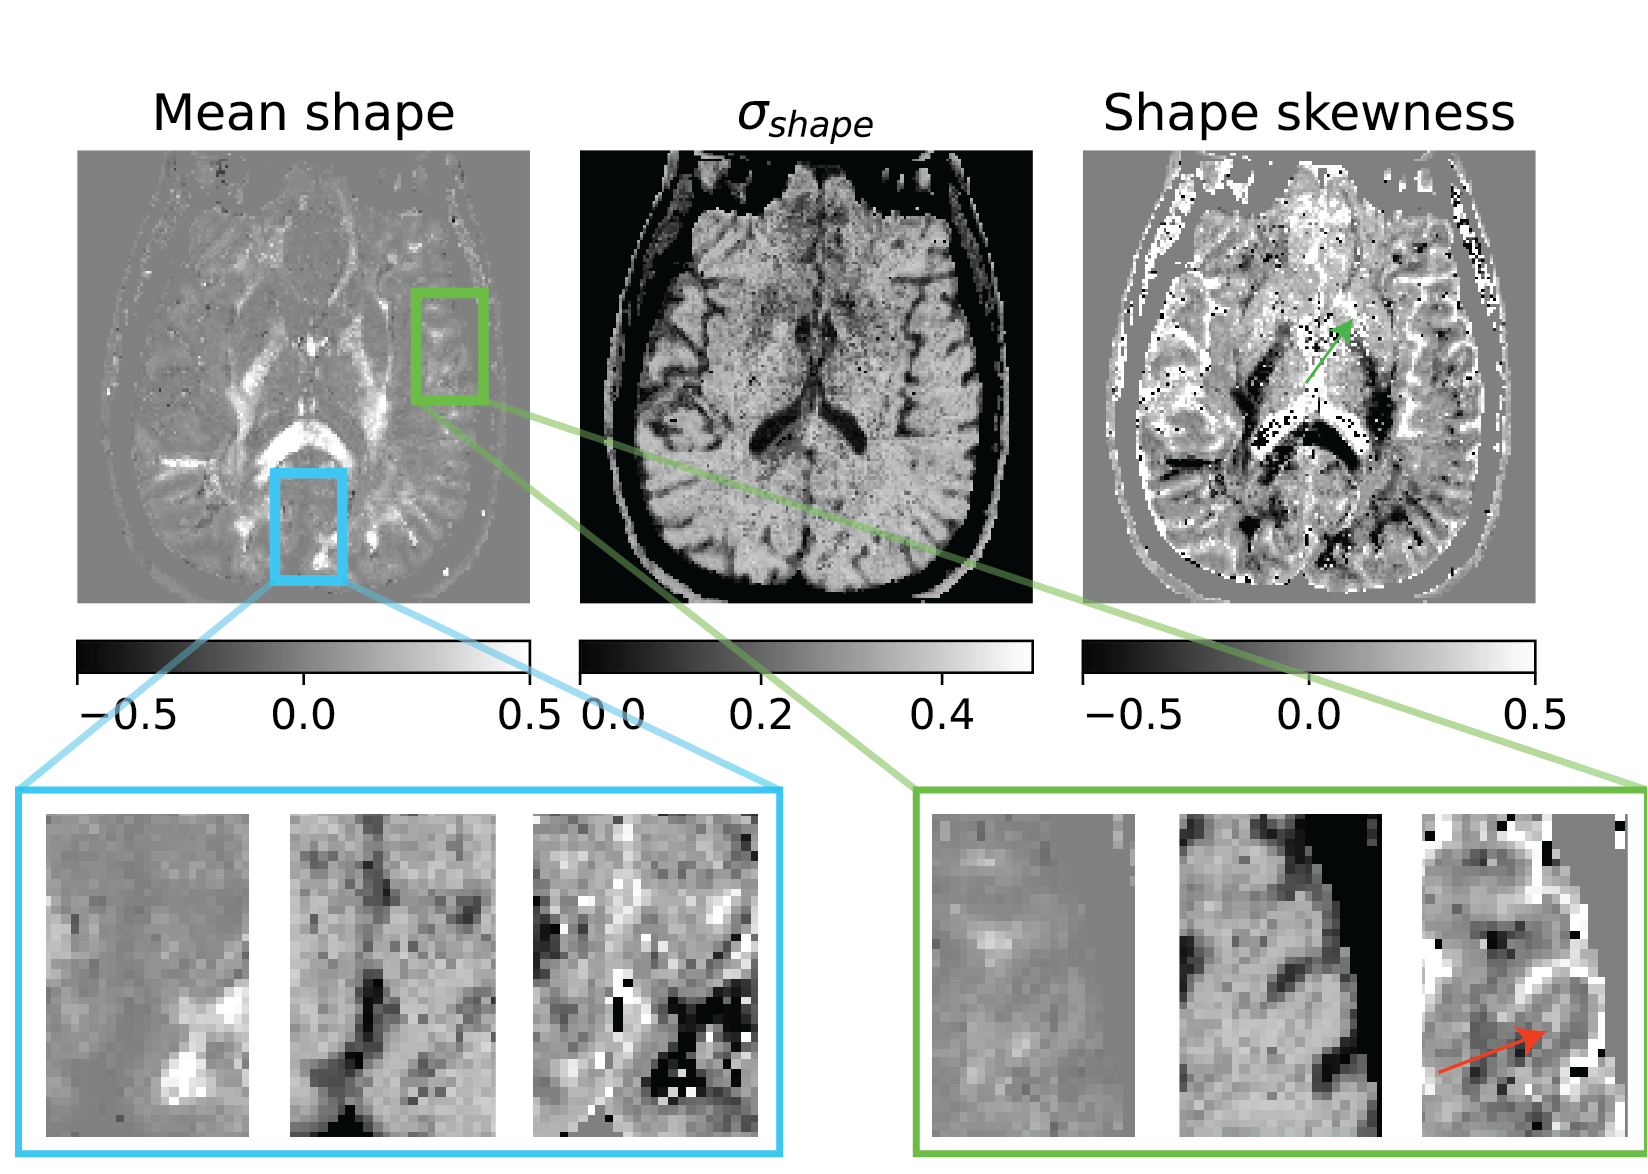
Figure 3: Shape heterogeneity measures in a slice given by the moments of eigenvalue skewness distribution of micro-diffusion tensors within a voxel. There was no obvious shape contrast in the visual cortex, but the shape skewness measure showed contrast in the operculum indicated by the red arrow which posits a changing skewness in cell shapes across the cortical layers. There was also shape skewness contrast in the subcortical gray matter shown using green arrow.
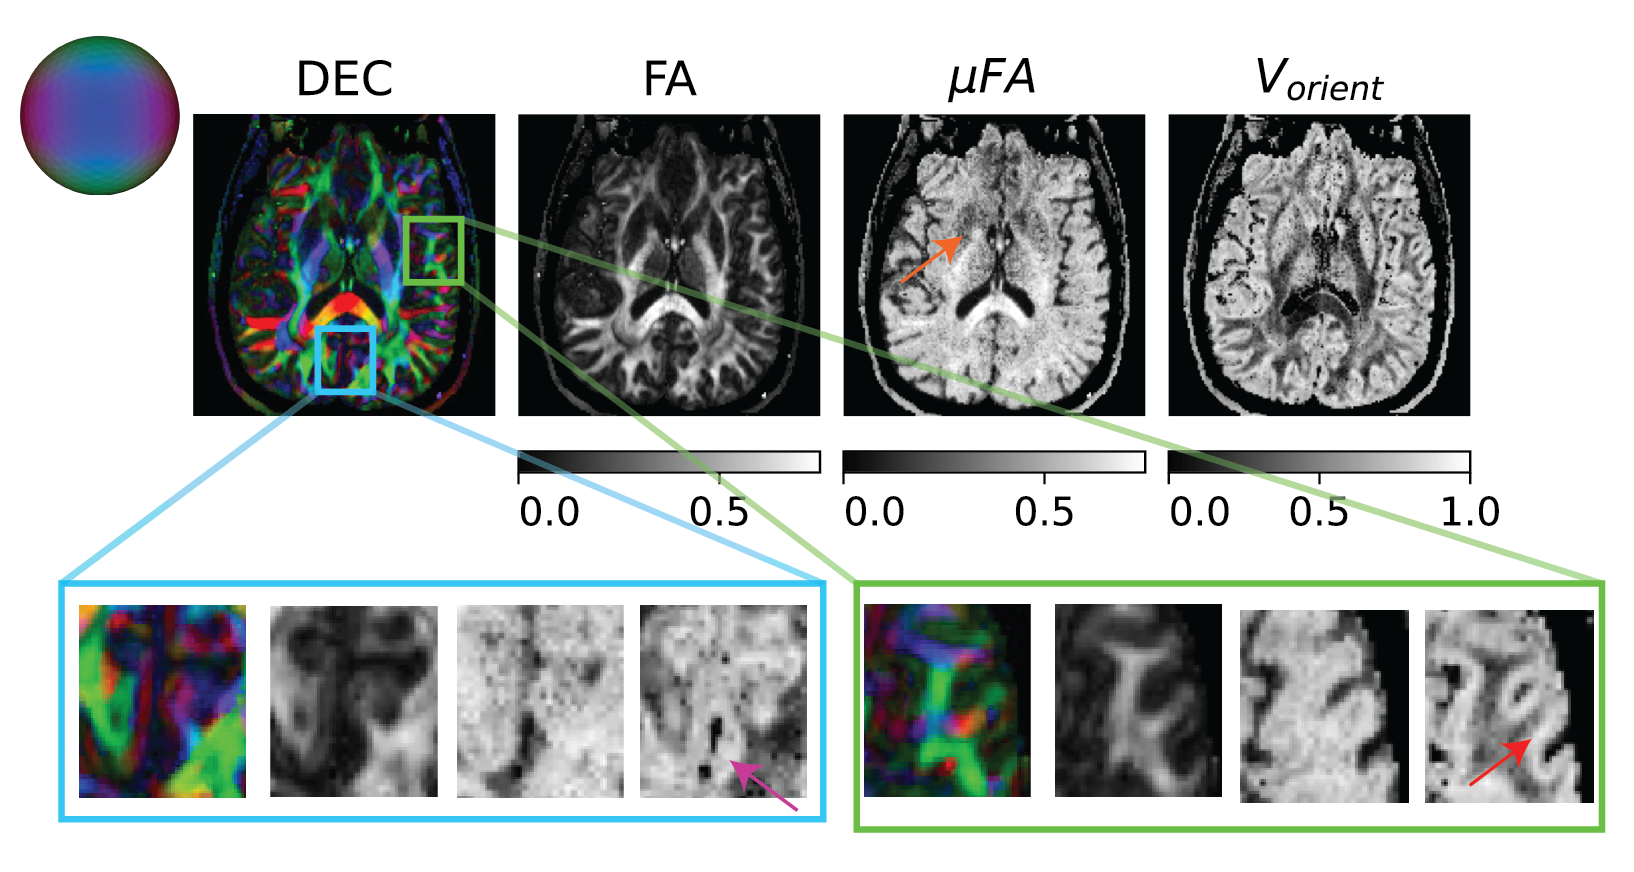
Figure 4: Orientation heterogeneity measures in a slice quantified by mFA and extent of orientation dispersion of primary eigenvector of micro-diffusion tensors (i.e., Vorient) along with DTI provided direction encoded color (DEC) and FA maps. The mFA was elevated in the parenchyma compared to FA except in the subcortical region shown using orange arrow. The Vorient was significantly elevated in the visual cortex and operculum compared to its surroundings shown using pink and red arrows respectively.
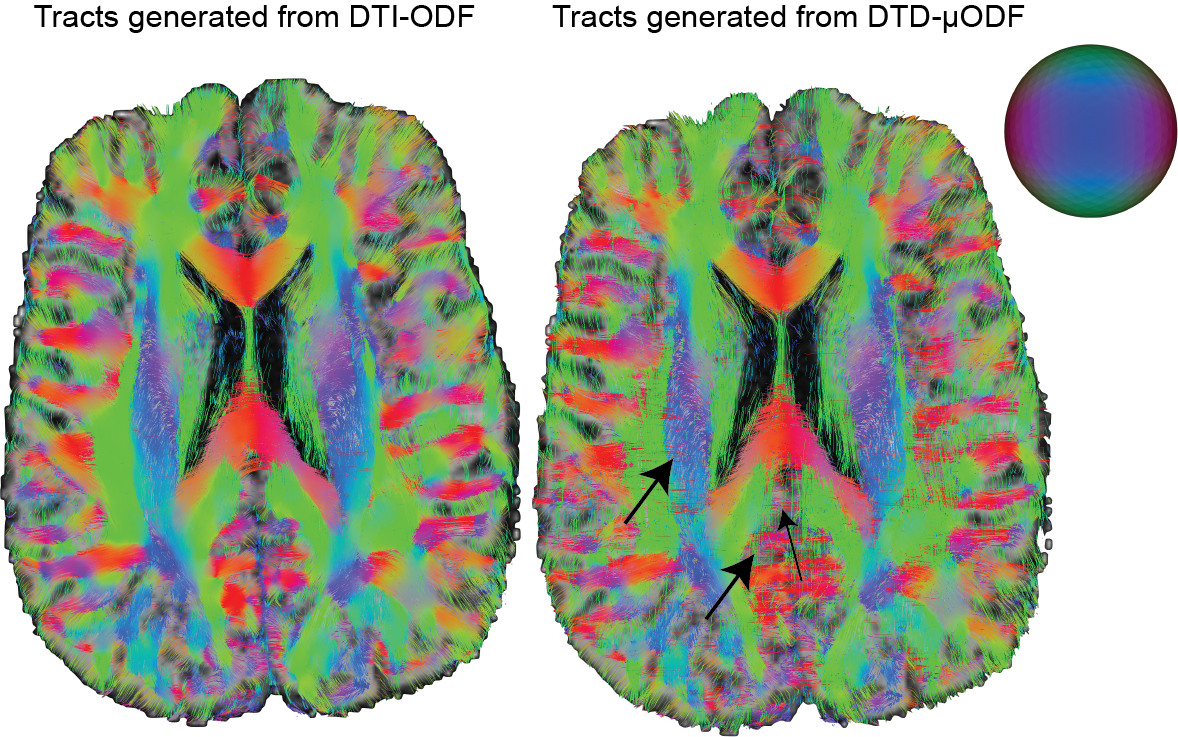
Figure 5: Results from streamline tractography performed using DTI provided macro and micro ODFs for a slice. The fiber crossing absent in DTI-ODF are clearly captured by DTD-micro ODF as shown by the arrows.
DOI: https://doi.org/10.58530/2023/4315