4313
Diffusion MRI with spherical tensor encoding at high b-values reveals cerebellar grey matter abnormalities in movement disorders1CUBRIC, Cardiff University, Cardiff, United Kingdom, 2Image Sciences Institute, University Medical Center Utrecht, Utrecht, Netherlands, 3Department of Neurosurgery, The Royal Children's Hospital, Parkville, Australia, 4Neuroscience and Mental Health Research Institute, Division of Psychological Medicine and Clinical Neurosciences, Cardiff University, Cardiff, United Kingdom, 5Diagnostic Radiology, Clinical Sciences Lund, Lund Unversity, Lund, Sweden, 6Cardiff and Vale University Health Board, University Hospital of Wales Cardiff, Cardiff, United Kingdom
Synopsis
Keywords: Diffusion/other diffusion imaging techniques, Microstructure, Movement disorders
Most work on understanding movement disorder pathophysiology has focused on grey/white matter volumetric (macrostructural) and white matter microstructural effects, limiting understanding of frequently implicated grey matter microstructural differences. Using ultra-strong diffusion MRI with spherical tensor encoding, a persistent MRI signal was seen in healthy cerebellar grey matter at ultra-high diffusion-weightings. This work quantifies the proportion of this signal, previously ascertained to originate from small spherical spaces, in a clinical cohort, including patients with diagnosed movement disorders where the cerebellum has been implicated in symptom pathophysiology. Significant differences were found in individuals diagnosed with SCA6 and dystonia compared to age-matched controls.Introduction
Investigation of brain microstructure in individuals diagnosed with movement disorders has focused predominantly on dMRI imaging changes in white matter (WM), but post-mortem studies suggest that changes to grey matter (GM) cellular properties are also of pathophysiological importance.1 In addition, most work has relied on diffusion tensor magnetic resonance imaging (DT-MRI) using low-to-moderate diffusion weightings and conventional linear tensor encoding (LTE), which challenges attribution of signal changes to specific microstructural compartments.This study investigates the potential of high b-value spherical tensor encoding (STE) – which isolates signal from small sphere-like spaces thereby eliminating contributions from e.g. axons and loosely packed extracellular space – in detecting changes of cerebellar GM microstructure in movement disorders.2-5 Specifically, this work investigates changes in those associated with predominant cerebellar dysfunction (spinocerebellar ataxia type 6, SCA6), those where the cerebellum is recognised to play a contributing role (adult-onset idiopathic focal cervical dystonia, AOIFCD), and those known to demonstrate more diffuse degenerative changes (Parkinson’s disease, PD).Methods
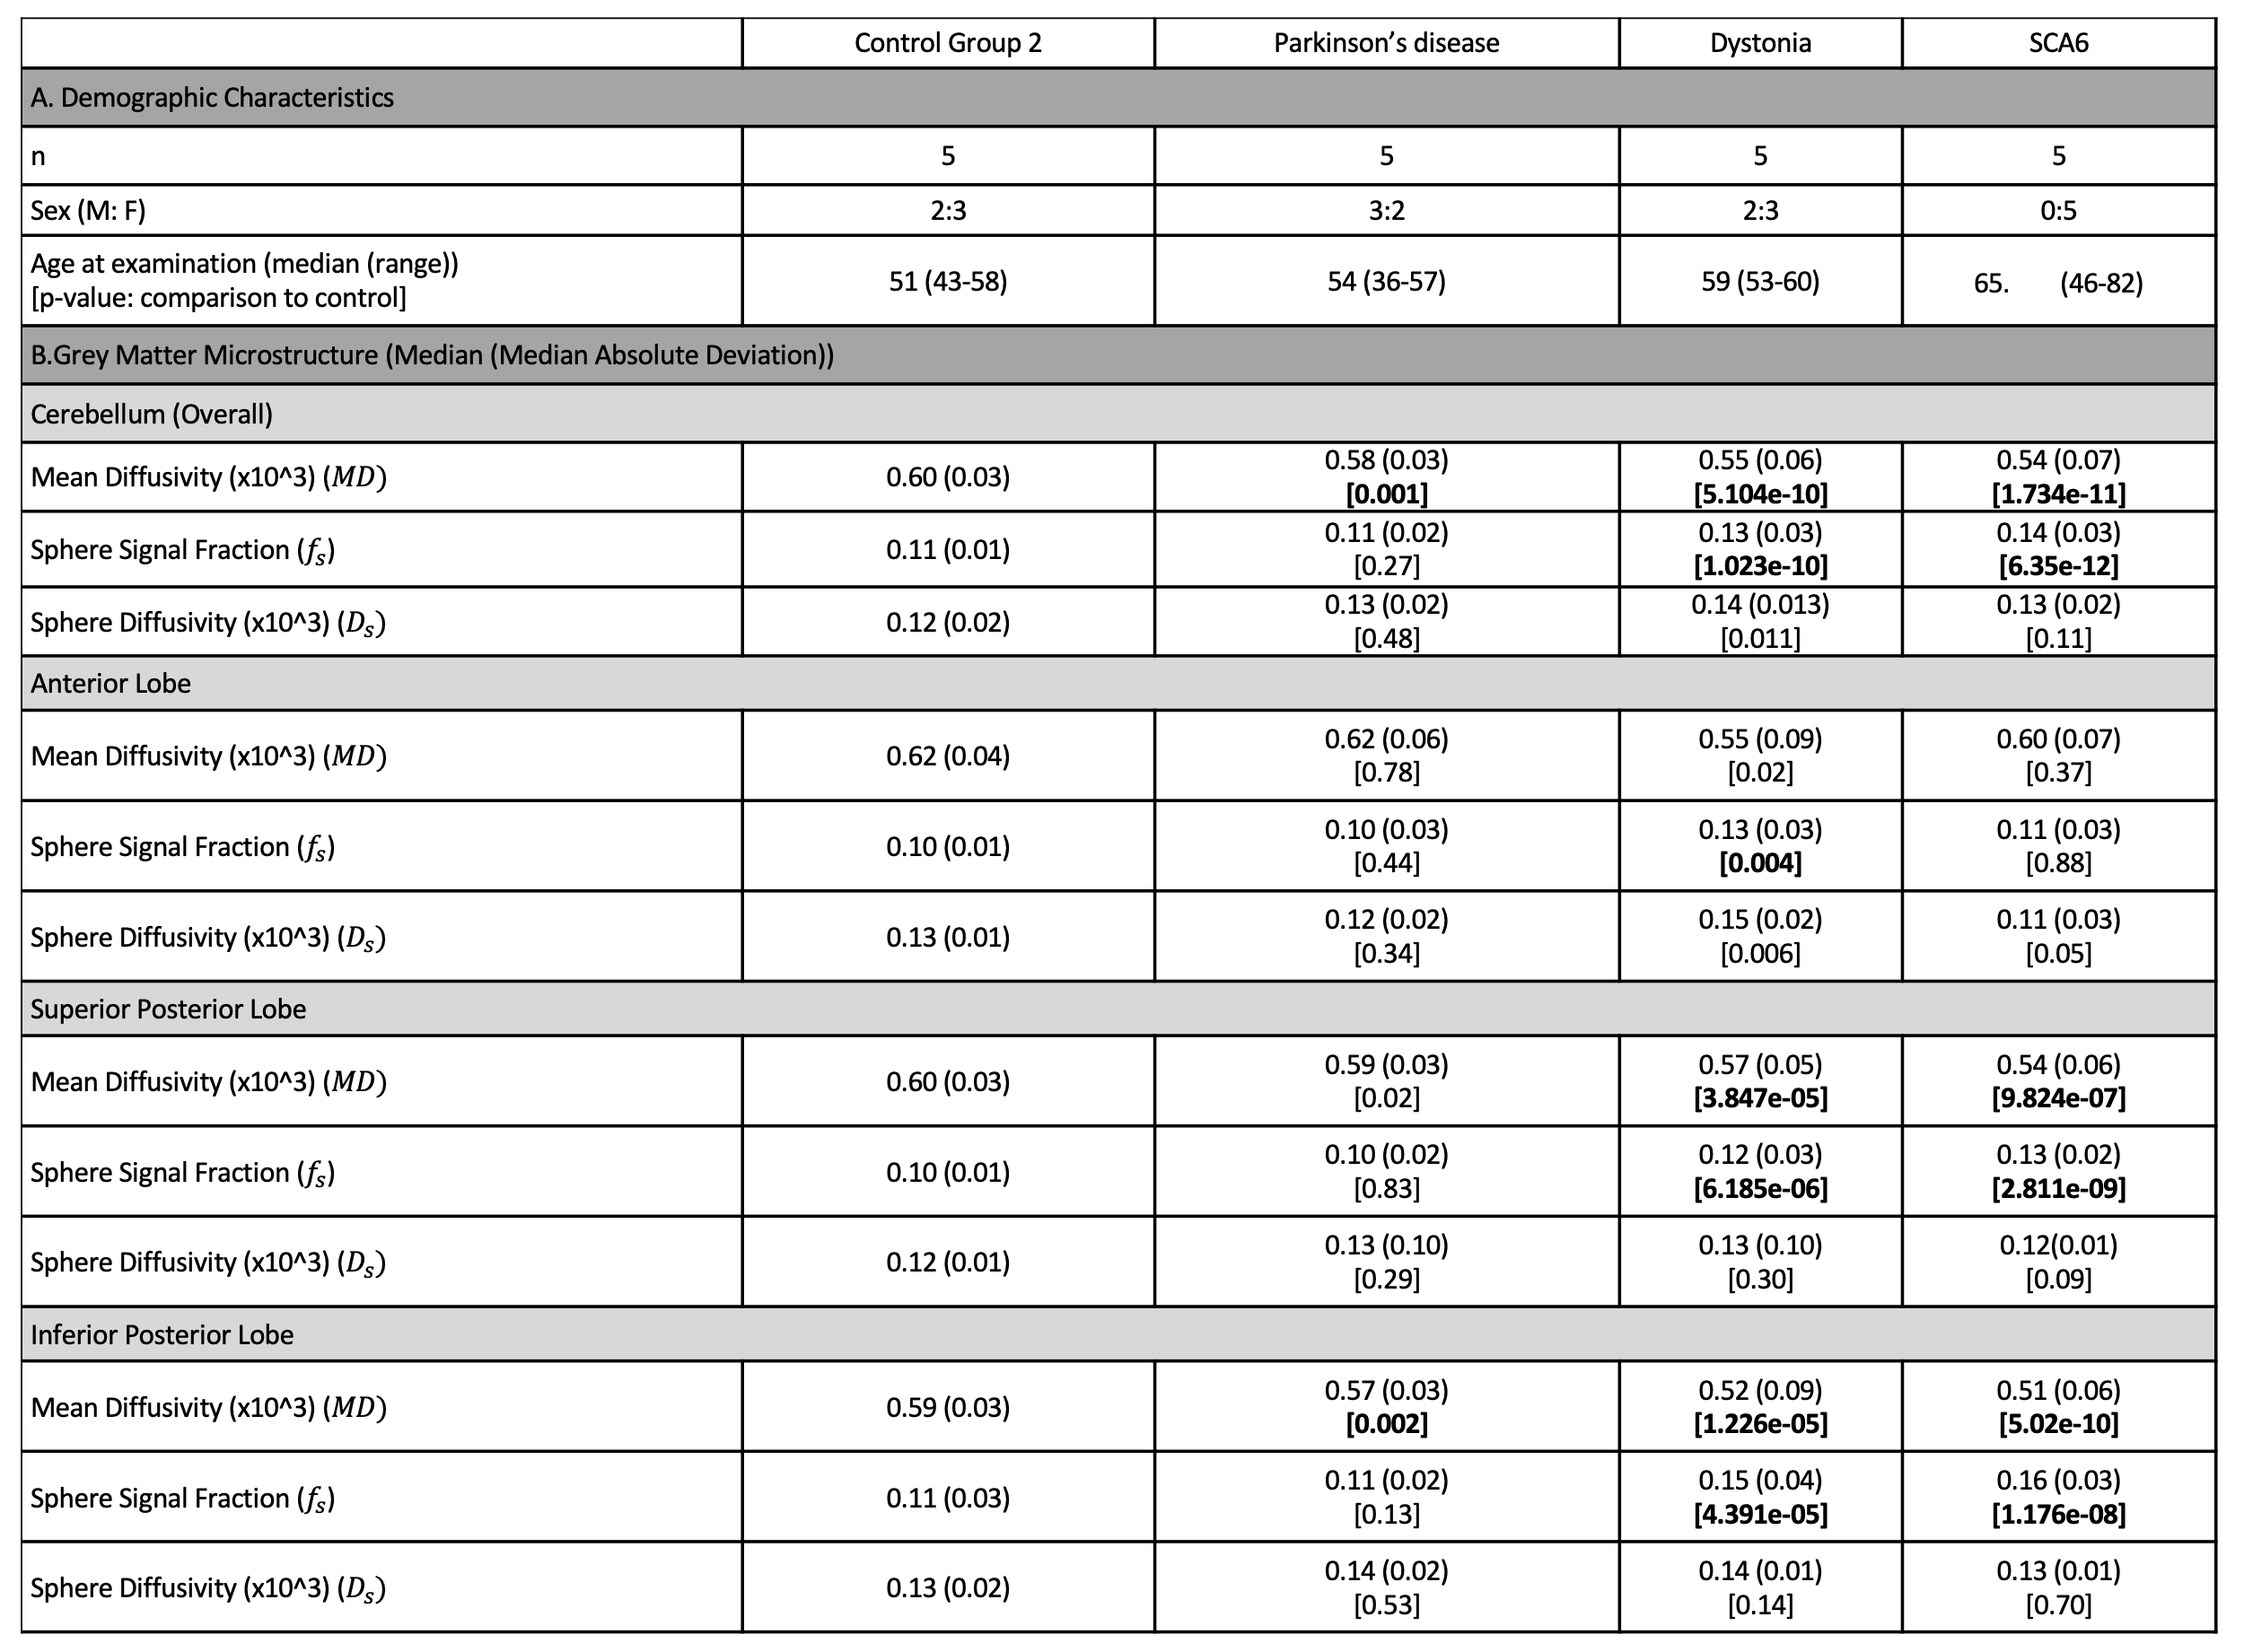
Participants. Fifteen participants diagnosed with a movement disorder (13F:7M, 56.8±10.42 years), ten non-age-matched, unaffected control participants (6F:4M, 27.4±5.64 years) of which five underwent repeat imaging (Control Group 1) and five age-matched unaffected controls (3F:2M, 51.4±6.27 years) (Control Group 2) were recruited. The movement disorder cohort included those diagnosed with idiopathic PD (n=5), AOIFCD (n=5) and SCA6 (n=5).Acquisition. MPRAGE and dMRI sequences were acquired, the latter with prototype spin-echo EPI sequence and user-defined gradient waveforms (Fig.1A).6,7 STE was performed with b = [250,1500,3000,4500,6000,7500,9000,10500,12000,13500,15000] s/mm2, and repeated [6,9,12,15,18,21,24,27,30,33,36] times, respectively. No in-plane acceleration was used, and imaging parameters were; voxel size=4×4×4 mm3 to achieve high signal-to-noise ratio, matrix=64×64, 34 slices, TR=4300 ms, partial-Fourier=6/8, bandwidth=1594 Hz/pixel.
Processing. The dMRI data were corrected for noise bias,8 signal drift,9 Gibbs ringing,10 image-misalignment due to subject motion and eddy currents by an initial rigid registration according to the interleaved b0 images and a subsequent affine registration of each DWI to the mean per b-value, geometrical distortions due to susceptibility effects (with reversed phase-encoding images)11 and gradient nonlinearities (including computation of spatially varying b-values).12
Analysis. For multiple non-exchanging Gaussian diffusion compartments the STE signal is a sum of the signal fractions and mean apparent diffusivities of each compartment. At high b-values (b>10000 s/mm2), the remaining signal was used to estimate the signal and apparent diffusivity associated with the spherical compartment (denoted as $$$S_{0,s}$$$ and $$$D_s$$$, respectively, Fig.2A). At low b-values (b<1500 s/mm2), a bi-exponential decay was fitted to the STE signal to estimate a free-water-eliminated tissue $$$MD$$$, tissue fraction $$$f_t$$$ and b=0 signal $$$S_0$$$. The tissue signal fraction of the spherical compartment is then $$$f_s=S_{0,s}/(f_tS_0)$$$.
The MPRAGE was used to segment the cerebellum13 and lobules were grouped into lobes: anterior, superior posterior; inferior posterior; flocculonodular (Fig.2B). Median $$$f_s$$$, $$$D_s$$$, and $$$MD$$$ were computed for each lobule and considered per lobe (Fig.2B bottom). Non-parametric statistical analyses (Mann-Whitney test) were used for comparison of each individual disease group to the age-matched controls, with Bonferroni correction for multiple comparisons.
Results
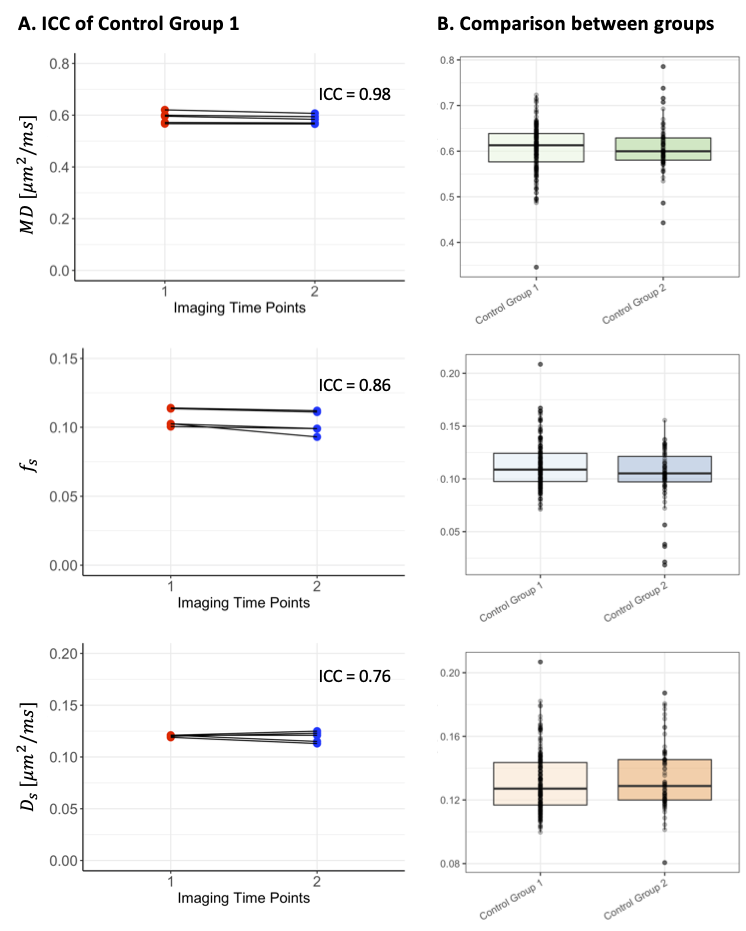
Reproducibility. High levels of reproducibility were demonstrated across the cerebellum for all measures ($$$MD,f_s$$$ and $$$D_s$$$), with intraclass correlation coefficients (ICC) of 0.98, 0.86 and 0.76 respectively (Fig.3A).Comparison between control groups. No significant differences were observed in cerebellar morphometric properties calculated from MPRAGEs. No overall significant differences were found for the dMRI measures (Fig.3B), but a significantly higher $$$D_s$$$ was observed in the superior posterior lobe (p<0.001) in the older control group (Group 2), compared to that of the younger control group (Group 1).
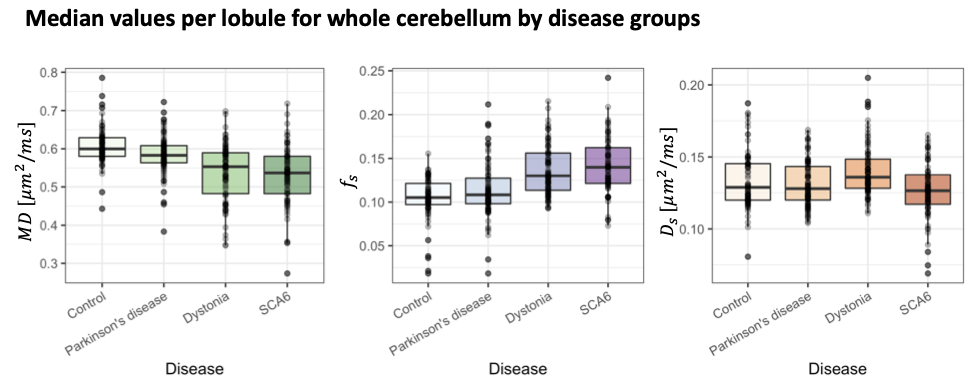
Comparison between movement disorders cohorts and age-matched controls. No significant differences apart from a slightly reduced cortical thickness in the SCA6 group (p=0.03) were observed. Significantly lower $$$MD$$$ in SCA6 (p=1.734e-11), primary dystonia (p=5.104e-10) and PD (p=0.001) cohorts (Fig.4) were observed. In addition, significantly higher $$$f_s$$$ values were observed in the primary dystonia (p=1.023e-10) and SCA6 cohorts (p=6.35e-12). When analysing individual lobes (Fig.5), significantly lower $$$MD$$$ was found in all movement disorder groups in the inferior posterior lobe and in dystonia and SCA6 in the superior posterior lobe. $$$f_s$$$ was significantly higher in dystonia and SCA6 cohorts in the superior posterior (p=6.185e-06 and p=2.811e-09 respectively) and inferior posterior (p=4.391e-05 and p=1.176e-08 respectively), and only the primary dystonia cohort (p=0.004) in the anterior lobe.
Discussion & Conclusion
This is the first application of ultra-high b-values and spherical tensor encoding in a movement disorder patient cohort, suggesting a promising, non-invasive, in vivo measure of cerebellar GM microstructural differences across degenerative (SCA6) and non-degenerative (AOIFCD) movement disorders, with potential for enhancing sensitivity and specificity to small spherical spaces, rather than the more time-consuming modelling of all compartments. Future work will involve further elucidating the microstructural origins of the residual signal, with the which could originate from within small spaces that may be intra-cellular (e.g. dendritic spines or dendritic arbor) or extra-cellular (e.g. between densely packed granule cells), or both.Acknowledgements
CMWT is supported by the Wellcome Trust [215944/Z/19/Z] and the Dutch Research Council (NWO) [17331].References
1. Pang JT, Giunti P, Chamberlain S, et al. Neuronal intranuclear inclusions in SCA2: A genetic, morphological and immunohistochemical study of two cases. Brain. 2002. doi:10.1093/brain/awf060
2. Burciu RG, Hess CW, Coombes SA, et al. Functional activity of the sensorimotor cortex and cerebellum relates to cervical dystonia symptoms. Hum Brain Mapp. 2017. doi:10.1002/hbm.23684
3. Adanyeguh IM, Perlbarg V, Henry PG, et al. Autosomal dominant cerebellar ataxias: Imaging biomarkers with high effect sizes. NeuroImage Clin. 2018. doi:10.1016/j.nicl.2018.06.011
4. Selvadurai LP, Corben LA, Delatycki MB, et al. Multiple mechanisms underpin cerebral and cerebellar white matter deficits in Friedreich ataxia: The IMAGE-FRDA study. Hum Brain Mapp. 2020. doi:10.1002/hbm.24921
5. Maiti B, Koller JM, Snyder AZ, Tanenbaum AB, Norris SA, Campbell MC PJ. Cognitive Correlates of Cerebellar Resting-State Functional Connectivity in Parkinson Disease. Neurology. 2020;28(94(4)):e384-e396.
6. Tax CMW, Szczepankiewicz F, Nilsson M, Jones DK. The dot-compartment revealed? Diffusion MRI with ultra-strong gradients and spherical tensor encoding in the living human brain. Neuroimage. 2020. doi:10.1016/j.neuroimage.2020.116534
7. Szczepankiewicz F, Westin CF, Nilsson M. Maxwell-compensated design of asymmetric gradient waveforms for tensor-valued diffusion encoding. Magn Reson Med. 2019. doi:10.1002/mrm.27828
8. Koay CG, Özarslan E, Basser PJ. A signal transformational framework for breaking the noise floor and its applications in MRI. J Magn Reson. 2009. doi:10.1016/j.jmr.2008.11.015
9. Vos SB, Tax CMW, Luijten PR, Ourselin S, Leemans A, Froeling M. The importance of correcting for signal drift in diffusion MRI. Magn Reson Med. 2017. doi:10.1002/mrm.26124
10. Kellner E, Dhital B, Kiselev VG, Reisert M. Gibbs-ringing artifact removal based on local subvoxel-shifts. Magn Reson Med. 2016. doi:10.1002/mrm.26054
11. Andersson JLR, Skare S, Ashburner J. How to correct susceptibility distortions in spin-echo echo-planar images: Application to diffusion tensor imaging. Neuroimage. 2003. doi:10.1016/S1053-8119(03)00336-7
12. Bammer R, Markl M, Barnett A, et al. Analysis and generalized correction of the effect of spatial gradient field distortions in diffusion-weighted imaging. Magn Reson Med. 2003. doi:10.1002/mrm.10545
13. Romero JE, Coupé P, Giraud R, et al. CERES: A new cerebellum lobule segmentation method. Neuroimage. 2017. doi:10.1016/j.neuroimage.2016.11.003
Figures
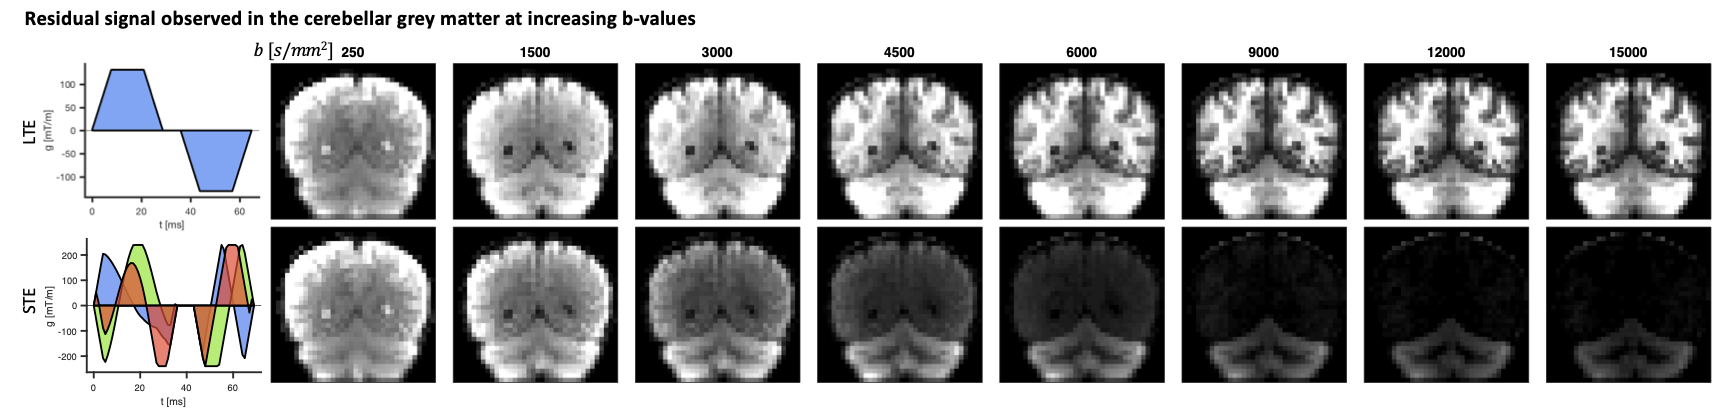
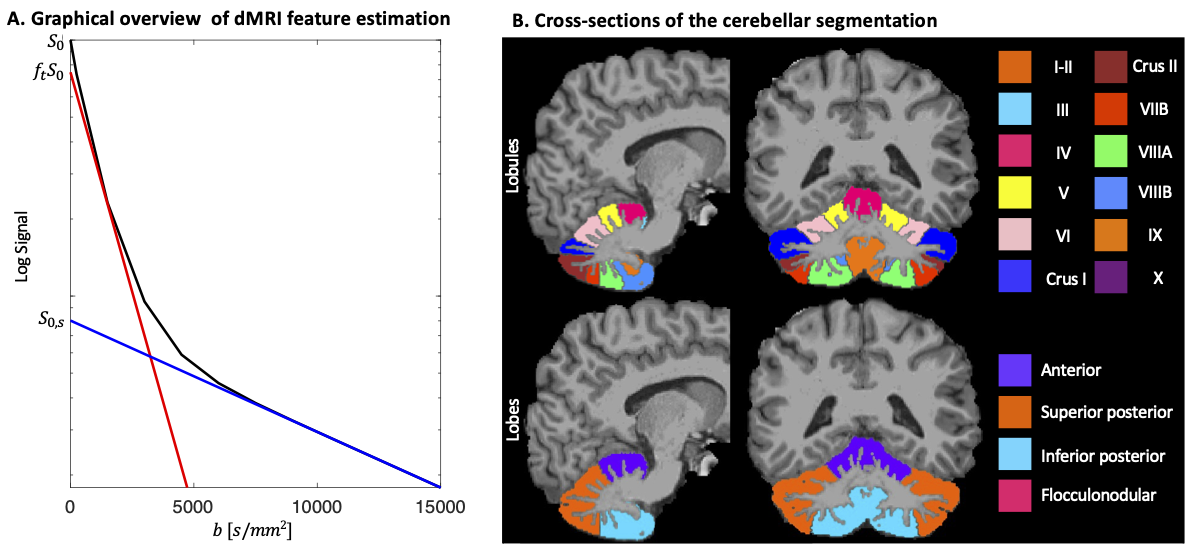
Fig.2: A. STE signal (black line), simulated as tri-exponential decay with $$$f$$$=[0.2,0.72,0.08] and $$$D$$$=[3, 1,0.1] μm2/ms where the first and last mimic free and spherically restricted water, respectively. The blue line is estimated by fitting a mono-exponential to b>10000 s/mm2 with slope $$$D_s$$$ and y-intercept $$$S_{0,s}$$$, and the red line by fitting a bi-exponential function $$$S=S_0(f_t exp(-b⋅MD)+(1-f_t ) exp(-b⋅3))$$$ to b <1500 s/mm2 with slope $$$MD$$$ and y-intercept $$$f_t S_0$$$. B. Cerebellar segmentation in lobules (top) and lobes (bottom).